Ecosyste.ms: Awesome
An open API service indexing awesome lists of open source software.
https://github.com/rayluo/charts.css.py
`charts.css.py` brings `charts.css` to Python. Online documentation and samples is available at the link below.
https://github.com/rayluo/charts.css.py
chart charts css data-visualization python visualization
Last synced: about 2 months ago
JSON representation
`charts.css.py` brings `charts.css` to Python. Online documentation and samples is available at the link below.
- Host: GitHub
- URL: https://github.com/rayluo/charts.css.py
- Owner: rayluo
- License: mit
- Created: 2021-05-03T04:27:37.000Z (over 3 years ago)
- Default Branch: dev
- Last Pushed: 2021-07-10T14:56:55.000Z (about 3 years ago)
- Last Synced: 2024-05-27T11:49:10.817Z (4 months ago)
- Topics: chart, charts, css, data-visualization, python, visualization
- Language: Python
- Homepage: https://rayluo.github.io/charts.css.py/
- Size: 89.8 KB
- Stars: 5
- Watchers: 3
- Forks: 1
- Open Issues: 0
-
Metadata Files:
- Readme: README.md
- License: LICENSE
Awesome Lists containing this project
README
# charts.css.py
`charts.css.py` provides a python API to convert your 2-dimension data lists into html snippet,
which will be rendered into charts by CSS, when serving inside a browser.
* The output of `charts.css.py` is *not* images. Consequently,
`charts.css.py` is a pure Python package without any image library dependency.
You can use `charts.css.py` on any platform.
* The output of charts.css.py is a normal HTML table.
Search engines and screen readers will be able to consume your data
even when CSS rendering is unavailable.
* Once the html snippet is delivered into the browser window,
the rendering is done by CSS, which is typically
[faster than JS-heavy chart libraries](https://chartscss.org/docs/#alternatives).
* Since the output is normal HTML, you could customize its size and position,
by defining your own CSS styles.
## Installation
`pip install charts.css.py`
## Usage
Just combine the output of `charts.css.py` functions and the predefined CSS style
``
into your html page.
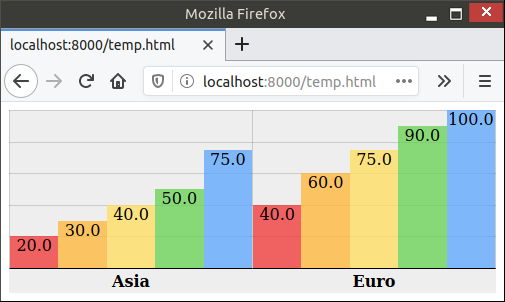
For example, the following code snippet can convert a 2-dimension list into column chart:
```python
from charts.css import column
STYLESHEET = ''
chart = column(
[
["Continent", "1st year", "2nd year", "3rd year", "4th year", "5th year"],
["Asia", 20.0, 30.0, 40.0, 50.0, 75.0],
["Euro", 40.0, 60.0, 75.0, 90.0, 100.0],
],
headers_in_first_row=True,
headers_in_first_column=True,
)
# Now, variable chart contains html snippet of "...", and
# STYLESHEET is just a constant string of "".
# You can somehow insert them into the proper places of your full html page.
# Here in this sample, we take a shortcut by simply concatenating them.
open("output.html", "w").write(STYLESHEET + chart)
```
The output.html will be rendered in browser like this:
## Advanced Usage
There are currently 4 different charts implemented: `bar`, `column`, `line`, `area`.
All those methods support many parameters to further customize the chart appearance.
`bar()` and `column()` also support stacking by value or stacking by percentage.
All those features are demonstrated in the
[different samples in this document](https://rayluo.github.io/charts.css.py/).
Lastly, this package also provides a command-line tool `csv2chart`.
You can use it to convert csv file into an html file.
For example, `csv2chart sample.csv output.html`.
You can also run `csv2chart -h` to know all the parameters it supports.
## Versioning
`charts.css.py` uses [Semantic Versioning](https://semver.org/).