https://github.com/reshamas/pyohio-plotly
PyOhio: Annotating Plotly Visualizations
https://github.com/reshamas/pyohio-plotly
covid19-tracker data-visualization pandas-python plotly python
Last synced: over 1 year ago
JSON representation
PyOhio: Annotating Plotly Visualizations
- Host: GitHub
- URL: https://github.com/reshamas/pyohio-plotly
- Owner: reshamas
- License: mit
- Created: 2021-05-12T20:45:44.000Z (about 5 years ago)
- Default Branch: main
- Last Pushed: 2021-10-02T18:12:55.000Z (almost 5 years ago)
- Last Synced: 2025-03-01T00:36:56.493Z (over 1 year ago)
- Topics: covid19-tracker, data-visualization, pandas-python, plotly, python
- Language: Jupyter Notebook
- Homepage:
- Size: 15.2 MB
- Stars: 4
- Watchers: 2
- Forks: 2
- Open Issues: 1
-
Metadata Files:
- Readme: README.md
- License: LICENSE
Awesome Lists containing this project
README
# PyOhio: Annotating Plotly Visualizations
### Speaker: Reshama Shaikh [(@reshamas)](https://twitter.com/reshamas)
### Slides: [PyOhio 2021: Enriching Data Visualizations with Annotations in Plotly](https://docs.google.com/presentation/d/1SFaoSvKxqnun0cYtSluE9fBm-113ivxm_DmggVR7i4A/edit?usp=sharing)
### Video: [PyOhio 2021: Enriching Data Visualizations with Annotations in Plotly](https://youtu.be/D2vsLy85rog)
### Article on Medium: [Creating Annotations in Python Plotly](https://medium.com/@reshamas/enriching-data-visualizations-with-annotations-in-plotly-using-python-6127ff6e0f80)
### Video Preview: [Annotation Examples](https://youtu.be/k7kcMg4Ao7Y)

### Conference
- [PyOhio](https://www.pyohio.org/2021/)
- July 31, 2021 (Saturday)
### Talk
Enriching Data Visualizations with Annotations in Plotly
### Session Type
Thunder talk: 10 minutes
### Talk Description
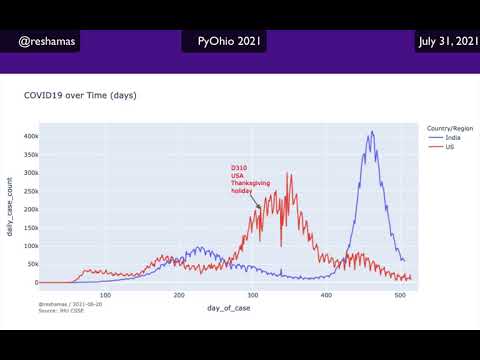
[Plotly](https://plotly.com/python/) is a versatile python graphing library which lets us make interactive graphs. In this talk, I will show how to go from a typical static visualization to one enriched with annotations which will convey to your audience a more complete interpretation of your visualization.
Here are some sample [plotly visualizations](https://reshamas.github.io/covid19-plots/) I have made, and in this talk, I will share how to create them.
### Talk objective
Getting started annotating graphs.
### Link to GitHub Repo
https://github.com/reshamas/pyohio-plotly
### Link to Video Demo
https://twitter.com/reshamas/status/1406792972226682881