https://github.com/reza55n/ExcelColorizeRows
Group your data visually.
https://github.com/reza55n/ExcelColorizeRows
database excel group grouping pivot-table pivot-tables pivottable pivottables table visualization
Last synced: 12 months ago
JSON representation
Group your data visually.
- Host: GitHub
- URL: https://github.com/reza55n/ExcelColorizeRows
- Owner: reza55n
- Created: 2021-09-05T04:10:04.000Z (almost 5 years ago)
- Default Branch: main
- Last Pushed: 2023-02-10T09:25:26.000Z (over 3 years ago)
- Last Synced: 2024-08-13T07:18:16.717Z (almost 2 years ago)
- Topics: database, excel, group, grouping, pivot-table, pivot-tables, pivottable, pivottables, table, visualization
- Language: VBA
- Homepage:
- Size: 24.4 KB
- Stars: 2
- Watchers: 1
- Forks: 0
- Open Issues: 0
-
Metadata Files:
- Readme: README.md
Awesome Lists containing this project
- jimsghstars - reza55n/ExcelColorizeRows - Group your data visually. (VBA)
README
# ExcelColorizeRows
**Group your data visually!**
This script colorizes and thickens borders of Excel rows based on one or more columns.
## How to implement
1. Copy the code
2. Open your document
3. Press `Alt+F11` (`Fn+F11` on Mac) to open VBA Editor
4. Open desired sheet's code
5. Paste the code
Now you can save your document as `Excel Macro-Enabled Workbook (*.xlsm)` format to use it later.
## How to use
1. Sort your table based on intended columns
2. Determine columns in the script (See next title)
3. (Optional) Select entire sheet or table and from `Home` tab, click on `Borders` drop-down and select `All Borders`
4. Press `Alt+F8` (`Fn+F8` on Mac) to open Macro dialog box
5. Select `[YourSheet].Colorize` and click Run
## Configuration
You can make some configurations by pressing `Alt+F11` (`Fn+F11` on Mac) and editing respective part of the code:
- **`Cols`: For example, write `Cols = [{5, 6}]` to colorize based on columns 5 and 6 and write `Cols = [{1}]` to colorize only based on first column.**
- `HeaderRowsCount`: Number of rows at the header to exclude from colorizing, default: `1`.
- `UseColor`, `UseBorder` (`True`/`False`): Restrict function of the script, default: `True`.
- `BreakRows` (`True`/`False`): Breaks page at columns' change, default: `False`.
- `AddHeaderCols` (`True`/`False`): Adds columns' caption at the beginning of each group, default: `False`.
- `fixed`, `random`, `InANewRow`, `Delimiter`, `ChangeStyle`, `InCol`: Detailed configurations.
## Example 1
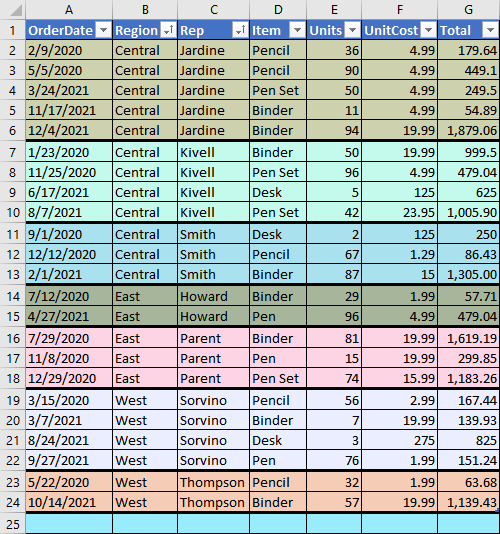
(Sample data from [contextures.com](https://www.contextures.com/xlsampledata01.html))
In example above, rows are sorted based on columns 2 and 3 and then, colorizing took place on same columns.
Configuration: `Cols = [{2, 3}]`
## Example 2
Page break preview:
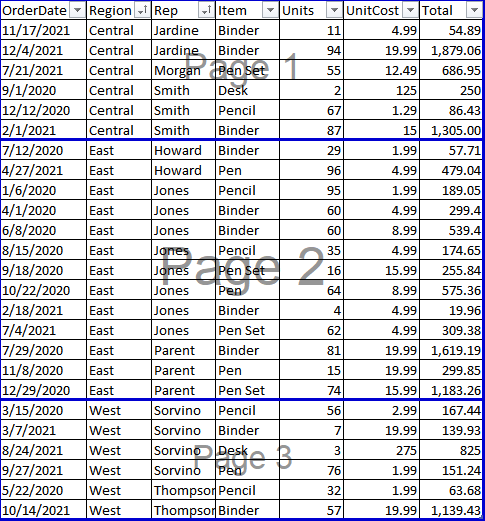
Configuration:
``` VBA
Cols = [{2}]
UseColor = False
UseBorder = False
BreakRows = True
```
## Example 3
Page break preview:
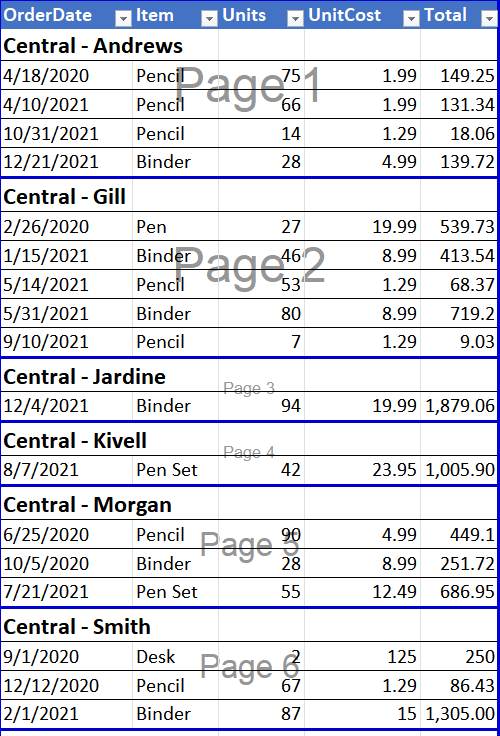
Configuration (Also made cols 2 and 3 hidden):
``` VBA
Cols = [{2, 3}]
UseColor = False
BreakRows = True
AddHeaderCols = True
```