https://github.com/rhettadam/mdsview
Browse, plot, and compare MITgcm MDS binary output from the CLI or an optional GUI.
https://github.com/rhettadam/mdsview
binary-data cli climate-modeling matplotlib mds mitgcm ocean-modeling python scientific-visualization
Last synced: 6 days ago
JSON representation
Browse, plot, and compare MITgcm MDS binary output from the CLI or an optional GUI.
- Host: GitHub
- URL: https://github.com/rhettadam/mdsview
- Owner: rhettadam
- License: mit
- Created: 2026-06-14T17:37:31.000Z (14 days ago)
- Default Branch: main
- Last Pushed: 2026-06-14T21:12:23.000Z (14 days ago)
- Last Synced: 2026-06-14T22:20:42.873Z (14 days ago)
- Topics: binary-data, cli, climate-modeling, matplotlib, mds, mitgcm, ocean-modeling, python, scientific-visualization
- Language: Python
- Homepage: https://rhettadam.github.io/mdsview/
- Size: 636 KB
- Stars: 0
- Watchers: 0
- Forks: 0
- Open Issues: 0
-
Metadata Files:
- Readme: README.md
- License: LICENSE
Awesome Lists containing this project
README

Browse, plot, and compare MITgcm MDS (`.data`/`.meta`) binary output. Use the CLI on a cluster or the optional GUI on your laptop or PC.
[](https://pypi.org/project/mdsview/)
[](https://www.python.org/)
[](LICENSE)
**Site:** [rhettadam.github.io/mdsview](https://rhettadam.github.io/mdsview/)
[MITgcm](https://mitgcm.org/) (MIT General Circulation Model) is a widely used ocean and climate model. A typical run writes out many 3-D fields (temperature, salinity, sea surface height, velocities) at regular time steps, often from MPI jobs on a cluster. The default binary format is **MDS**: each field is a **`.meta`** file (dimensions, precision, iteration) plus a **`.data`** file (raw array, usually big-endian float32). Tiled MPI output adds more filename suffixes but the same basic layout.
After a run you usually have a directory with hundreds or thousands of these file pairs and no built-in viewer. MITgcm ships [`MITgcmutils`](https://github.com/MITgcm/MITgcm/tree/master/utils/python/MITgcmutils) for reading and writing MDS in Python, but you still need scripts to list what's there, pick an iteration and level, plot a slice, subtract two snapshots, or export subsets. mdsview fills that gap: catalog a run folder without loading `.data`, plot 2-D slices with grid coordinates, diff two snapshots (including cross-run), export to NetCDF, extract subsets, build time series, and save figures from the terminal or a local GUI.
For huge LLC runs or lazy xarray loading, use [`xmitgcm`](https://xmitgcm.readthedocs.io/). mdsview targets quick inspection of run directories.
## Install
From [PyPI](https://pypi.org/project/mdsview/):
```bash
pip install mdsview # CLI (headless)
pip install "mdsview[gui]" # + desktop GUI (CustomTkinter)
```
From source:
```bash
git clone https://github.com/rhettadam/mdsview.git
cd mdsview
pip install -e .
pip install -e ".[gui]"
```
On Windows, if `mdsview` is not on PATH:
```bash
python -m mdsview.cli info -d C:\path\to\run
```
Requires Python 3.9+, NumPy, matplotlib, MITgcmutils, cmocean, Pillow, and netCDF4 (for `export`). GUI needs CustomTkinter.
## Quick start
```bash
mdsview info -d /path/to/run
mdsview plot -v T -i 480 -l 4 -d /path/to/run
mdsview plot -v T -i 480 -l 4 --save-figure t.png --no-show -d /path/to/run # headless
mdsview gui -d /path/to/run
```
`-d FOLDER` is the run directory (default: `.`). `-v NAME` is the field prefix (`T`, `S`, `Eta`, …). Most commands accept `--json`. Run `mdsview COMMAND --help` for options.
## Sample data
Synthetic run directories for testing without MITgcm:
```bash
mdsview generate-sample -o sample_data --preset demo
```
See `sample_data/SAMPLE_README.txt` after generation. Other presets and options: `mdsview generate-sample --help`.
## CLI
### `info`
List variables or show metadata. Reads `.meta` only, safe with thousands of snapshots.
```bash
mdsview info
mdsview info -v T
mdsview info -v T --show-meta
mdsview info -v T --json
```
### `plot`
One 2-D slice. With `--level`, reads a single horizontal slab, not the full volume.
```bash
mdsview plot -v T -i 480 -l 4
mdsview plot -v Eta -i last
mdsview plot -v T -i 0 -l 10 --cmap haline --vmin 0 --vmax 30 --save-figure out.png --no-show
mdsview plot -v T -i 0 --no-coords # index axes, not XC/YC
```
### `diff`
`field(LATER) − field(EARLIER)`. Default is one slice; `--save-field` without `--level` loads full volumes.
`-d` is the **later** run (minuend). `--dir-b` / `--earlier-dir` is the **earlier** run when comparing two model directories at the same (or different) iterations.
```bash
mdsview diff -v T --later 2520 --earlier 0 -l 20
mdsview diff -v T --later 2520 --earlier 0 -l 20 --plot --save-figure diff.png --no-show
mdsview diff -v T --later 2520 --earlier 0 --save-field T_diff
mdsview diff -v T 480 0 -l 4 # positional iters also work
mdsview diff -v T --later 2520 --earlier 2520 -l 20 -d /scratch/warm --dir-b /scratch/ref
```
### `export`
Write variables to NetCDF with CF-style `time`, `depth` (when present), and horizontal `y`/`x` coordinates (or `lat`/`lon` for geographic degree grids). Optional 2-D `xc`/`yc` arrays are included when grid files exist. All variables in one file must share the same MDS shape (e.g. `T` and `S` together, not `T` and `Eta`).
```bash
mdsview export -v T,S -o run.nc --iterations all
mdsview export -v T -o surface.nc --iterations all --levels 0
mdsview export -v T -o patch.nc --iterations last --region 10,50,20,40
```
Shared selection flags: `--iterations` (`all`, `last`, `0,360`, `0:1200:120`), `--levels`, `--region I0,I1,J0,J1`, `--rec`, `--json`.
### `extract`
Copy snapshots to a new folder as MDS files. Reads one iteration at a time.
```bash
mdsview extract -v T -o subset/ --iterations 0:1200:120 --levels 0:10
mdsview extract -v T -o patch/ --iterations all --region 100,200,50,150
mdsview extract -v Eta -o eta_only/ --iterations last
```
Uses the same `--iterations`, `--levels`, and `--region` flags as `export`.
### `timeseries`
Build a CSV or JSON time series without loading full volumes. A line plot opens by default.
```bash
mdsview timeseries -v T -l 4 --iterations all --at 40,30 -o point.csv
mdsview timeseries -v T -l 10 --iterations all --box 0,80,0,60 -o box.csv
mdsview timeseries -v Eta --iterations all --save-figure ssh.png --no-show
mdsview timeseries -v T -l 0 --iterations 0:480:120 --json --no-plot
```
Default reduction is a domain mean over the chosen level. For 3-D fields without `-l`, mid-depth is used. Use `--at I,J` for a point, `--box I0,I1,J0,J1` for a box mean, `--save-figure` / `--no-show` for headless plots, and `--no-plot` for data only.
### `combine`
Stack iterations into one array. Loads every listed iteration; use for small tests only.
```bash
mdsview combine -v T --iterations 0,360,720 --save-field T_stack
```
### `generate-sample`
Create synthetic `.data`/`.meta` for tests. See [Sample data](#sample-data).
### Plot options
Used by `plot` and `diff`:
- `-l`, `--level K`: vertical index (0 = top)
- `--cmap`: default `thermal` (plot) or `balance` (diff); matplotlib + cmocean names
- `--vmin`, `--vmax`
- `--save-figure FILE`, `--no-show`
Diff plots use a symmetric diverging scale. Full list: `mdsview/colormaps.py`.
## GUI
```bash
pip install "mdsview[gui]"
mdsview gui -d /path/to/run
```
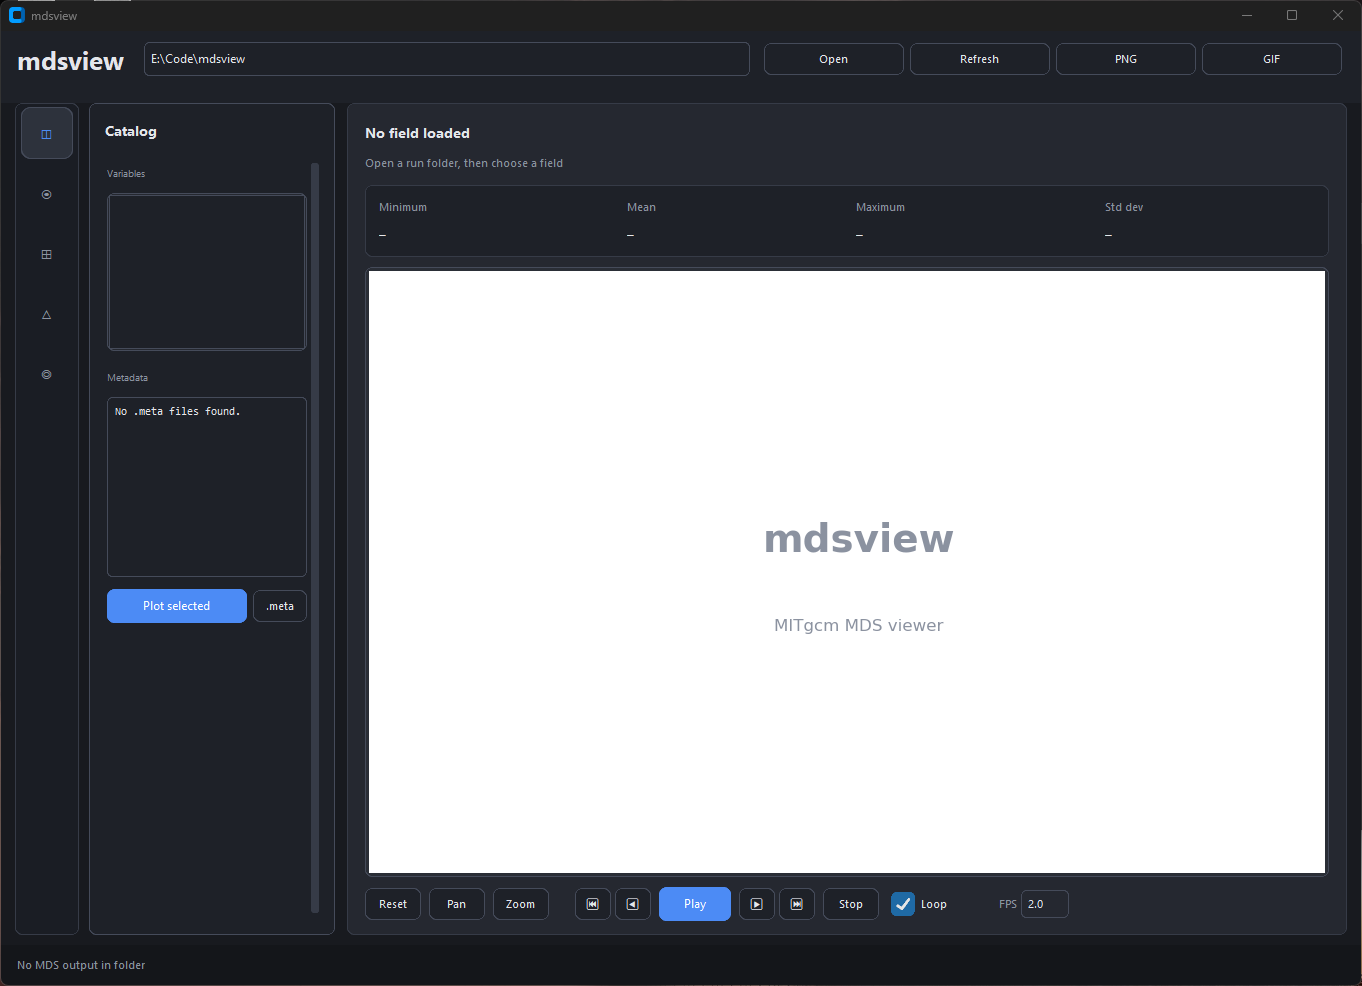
Run directory at the top. Left rail switches Catalog, Field, and Grid panels; controls sit beside the plot. Stats (min, mean, max, std) update with each field.
Large runs (many iterations or variables) are indexed in the background: the catalog lists snapshot counts without reading every `.meta` file up front. Use **Field** to plot one 2-D slice at a time; use **`mdsview diff`** on the CLI for snapshot differences.
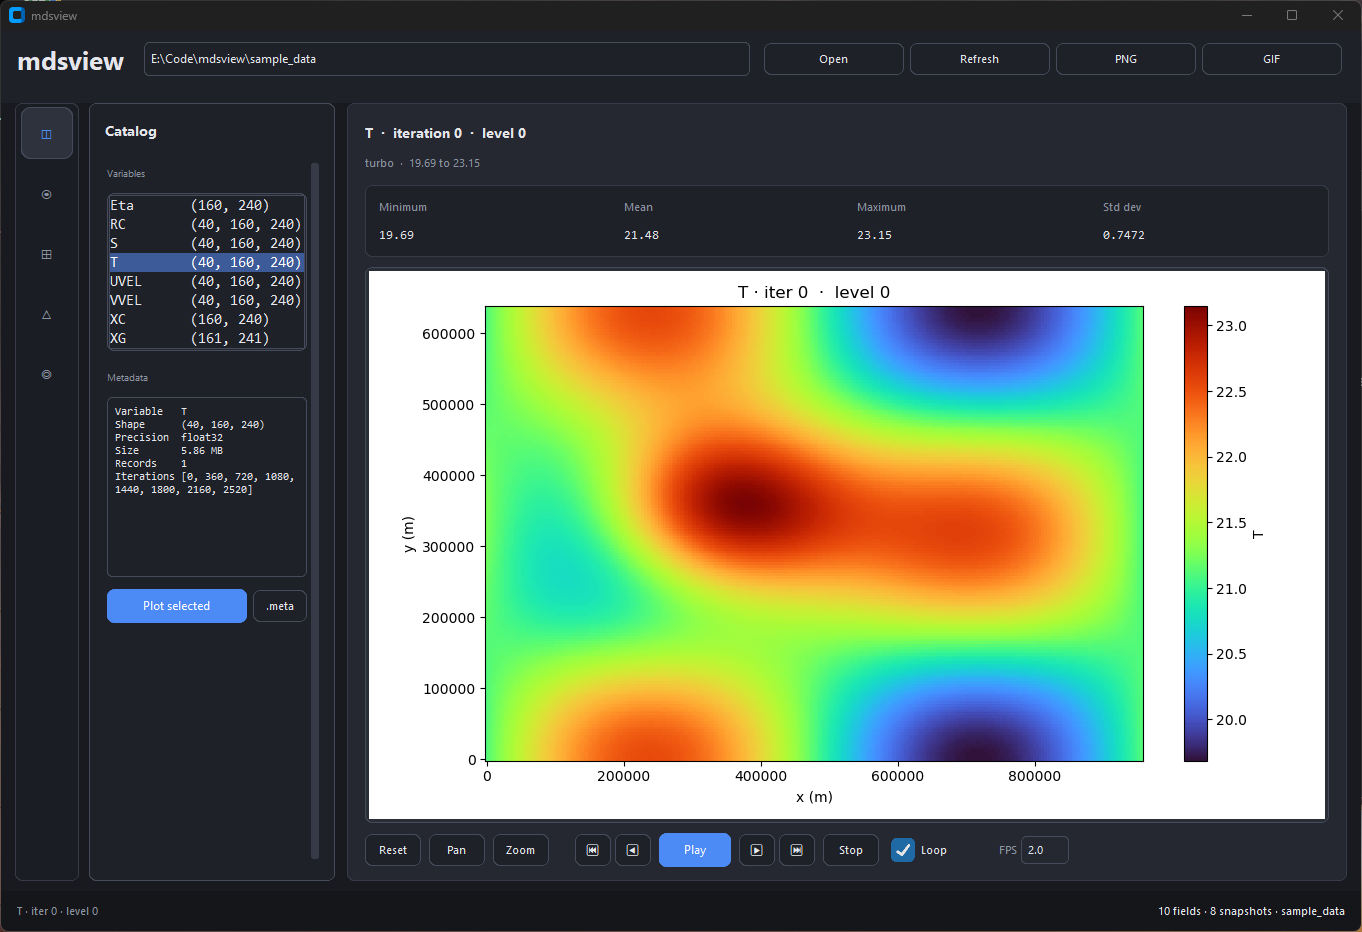
Lists every variable in the run. Selecting one loads metadata below; double-click or **Plot selected** opens it in Field.
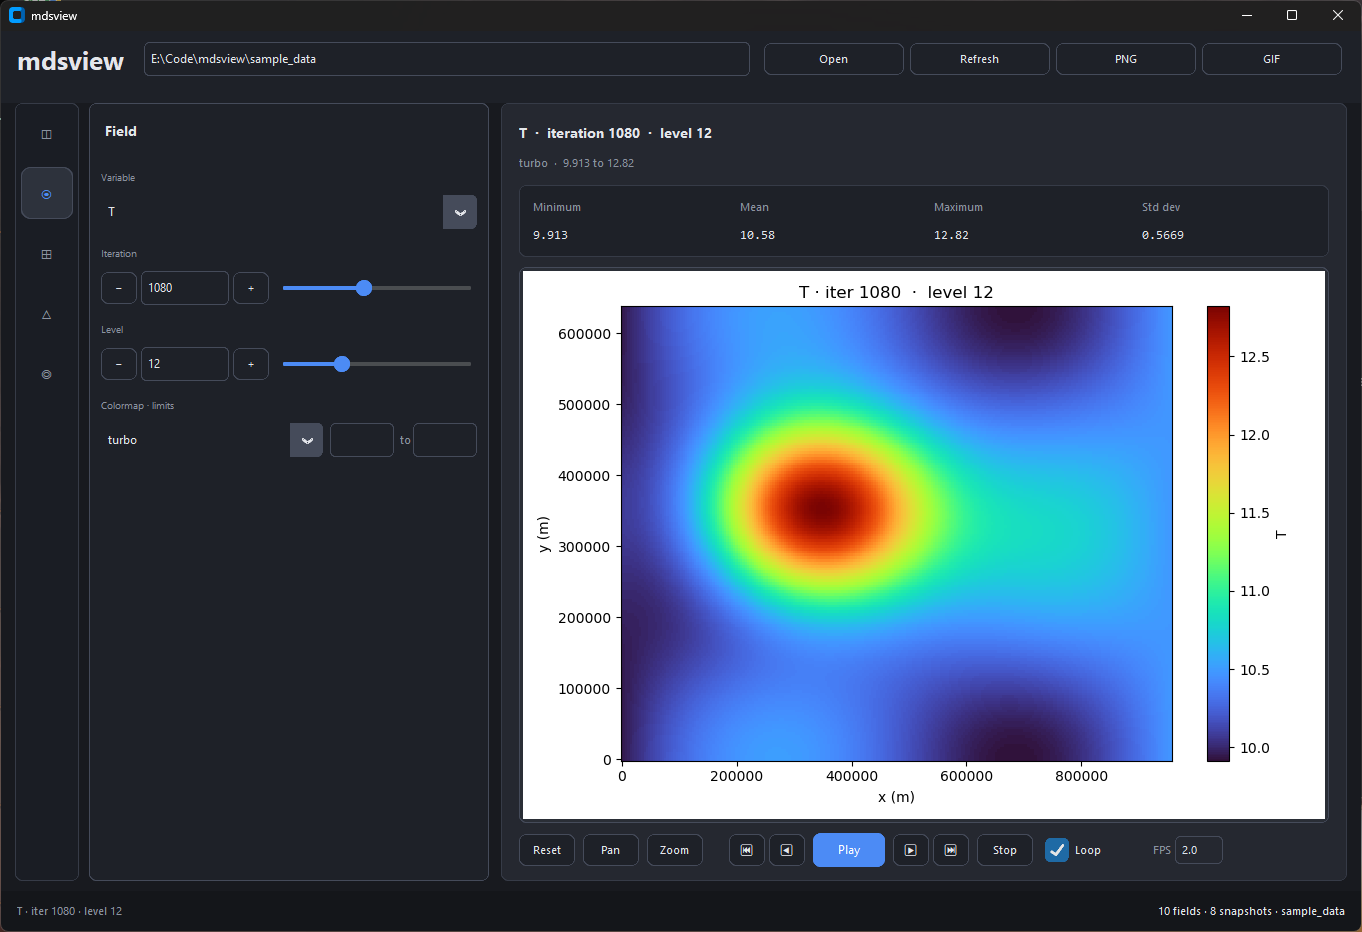
Pick variable, iteration, and level. Sliders auto-refresh the plot. Footer controls step through time or export a GIF.
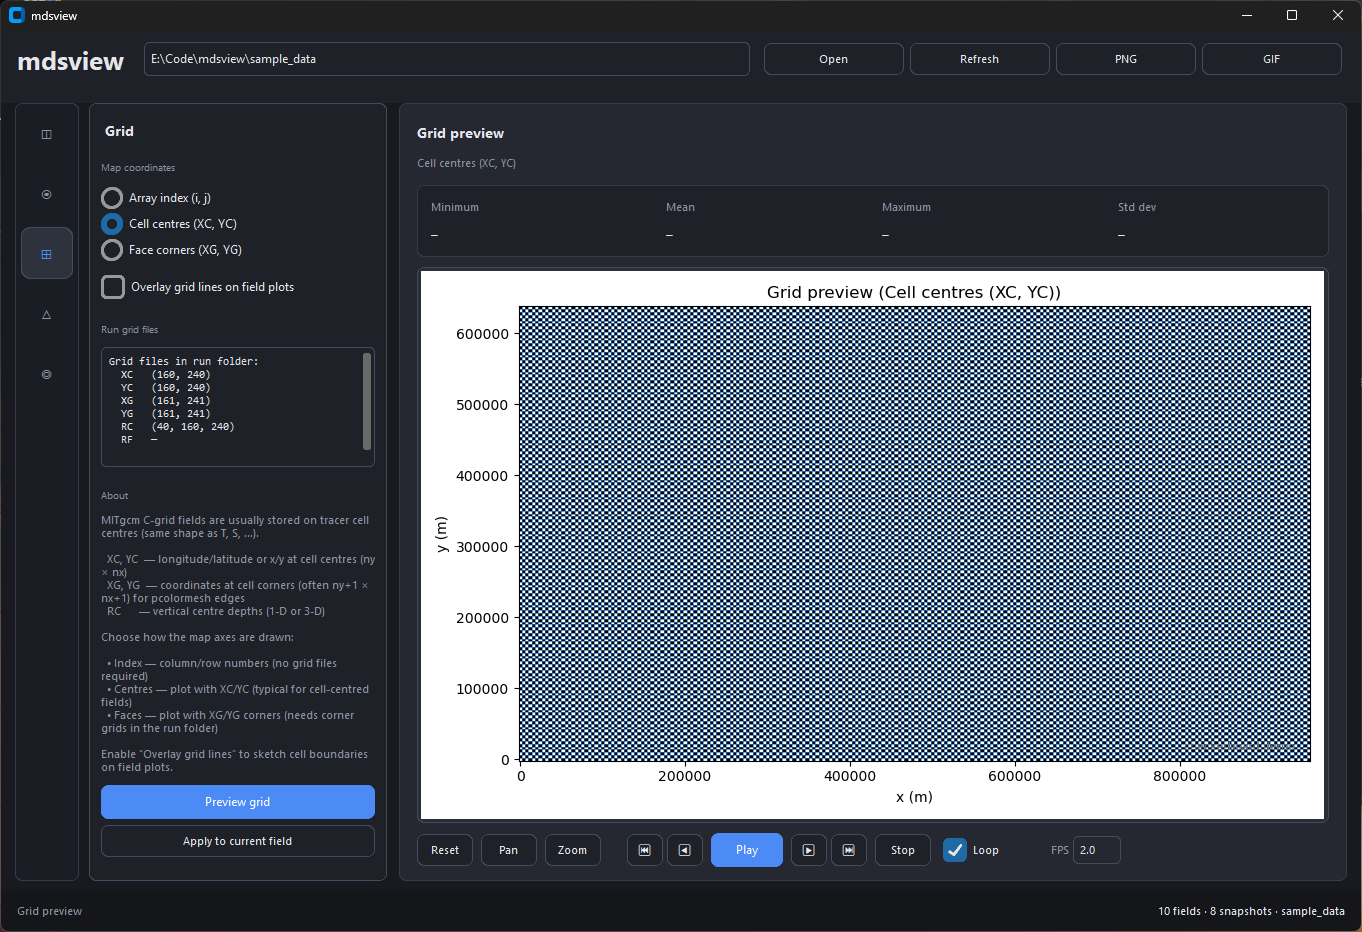
Preview XC/YC (or other grid files) and optionally overlay grid lines on field plots.
Top bar: **Open** (`Ctrl+O`), **Refresh** (`Ctrl+R`), **PNG** (`Ctrl+S`), **GIF** (export dialog). Matplotlib pan/zoom sits under the plot. For remote sessions (X2GO, SSH with X forwarding), prefer the CLI; the GUI is tuned for local use.
## HPC / batch
CLI uses the Agg backend by default (no display). Use `--save-figure` and `--no-show`:
```bash
mdsview info -d /scratch/run001
mdsview plot -v T -i last -l 20 -d /scratch/run001 --save-figure t.png --no-show
mdsview diff -v T --later 2520 --earlier 0 -l 20 -d /scratch/run001 --json
mdsview export -v T,S -o run.nc -d /scratch/run001 --iterations all --levels 0
mdsview timeseries -v Eta -d /scratch/run001 --iterations all -o ssh.csv --no-plot
```
Exit codes: `0` ok, `1` error, `2` bad args, `130` interrupt. Errors go to stderr. Tracebacks: `MDSVIEW_DEBUG=1`.
### Memory
- `info`: `.meta` filenames only
- `plot` / `diff` with `-l`: one slab per snapshot
- `export`, `extract`, `timeseries`: one iteration (or slab) at a time
- `diff --save-field` (no level): full volume; `combine`: all listed iters in RAM
## Python API
```python
from mdsview import io, ops, plotting
slab = io.read_level_slice("/path/to/run", "T", 480, level=4)
diff2d, meta = ops.diff_slice("/path/to/run", "T", later=480, earlier=0, level=4)
diff2d, meta = ops.diff_slice("/warm", "T", 2520, 2520, level=20, data_dir_b="/ref")
plotting.plot_field("/path/to/run", "T", 480, level=4, save="t.png", show=False)
```
## Limitations
- Standard MDS only, not `pkg/mnc` tiles (use `gluemnc` first)
- No 3-D volume rendering; LLC unfolding is partial (needs XC/YC in the run dir)
## License
MIT License. See [LICENSE](LICENSE). Copyright (c) 2026 Rhett R. Adam.