https://github.com/ritu-thombre99/server-simulation-for-monitoring-rul
Server simulation for monitoring remaining useful life of turbofan jet engines
https://github.com/ritu-thombre99/server-simulation-for-monitoring-rul
flask flask-application lstm lstm-model lstm-neural-networks rul simulation
Last synced: 8 months ago
JSON representation
Server simulation for monitoring remaining useful life of turbofan jet engines
- Host: GitHub
- URL: https://github.com/ritu-thombre99/server-simulation-for-monitoring-rul
- Owner: ritu-thombre99
- License: mit
- Created: 2022-08-18T17:26:43.000Z (about 3 years ago)
- Default Branch: main
- Last Pushed: 2022-08-18T17:48:55.000Z (about 3 years ago)
- Last Synced: 2025-01-05T06:27:23.043Z (9 months ago)
- Topics: flask, flask-application, lstm, lstm-model, lstm-neural-networks, rul, simulation
- Language: HTML
- Homepage:
- Size: 5.71 MB
- Stars: 0
- Watchers: 1
- Forks: 1
- Open Issues: 0
-
Metadata Files:
- Readme: README.md
- License: LICENSE
Awesome Lists containing this project
README
# Server-simulation-for-monitoring-RUL
Server simulation for monitoring remaining useful life of turbofan jet engines
To demonstrate the working of proposed models in a real-time environment of https://github.com/ritu-thombre99/RUL-Prediction, we
developed a website to simulate the server that can monitor the health of the engines as
follows:
+ After the simulation is started, health scores of 20 engines are displayed in a table
+ Health of an engine falls under four categories:
+ Extremely Critical (0-0.25)
+ Critical (0.25-0.5)
+ Normal (0.5-0.75)
+ Optimal (0.75-1)
+ Statistics of health and range of health scores of engines is displayed as a pie
chart and a line graph
+ Health scores of engines are refreshed every 1-2 second
# Back-end Implementation
1. We used flask for the web development.
2. All the models (regression and LSTM) are saved using pickle and
save_model.
3. These models are imported in the backend app.py file.
4. VAR forecasts time-series of the randomly chosen 20 engines for 20 cycles
into the future.
5. LSTM with lookback=1 then predicts RUL for these 20 cycles and the
corresponding health score is calculated.
6. These health scores are then sent one cycle at a time to monitor.html file.
# Front-end Implementation
1. We have 3 html files: home.html, monitor.html and finish.html.
2. home.html will let a user to start the simulation and redirects to monitor.html.
3. Once the simulation ends, monitor.html redirects to finish.html, from where
user can restart the simulation.
4. monitor.html file receives the health scores of 20 engines one cycle at a time
from the backend.
5. These health scores are displayed in a table as shown in the following figure 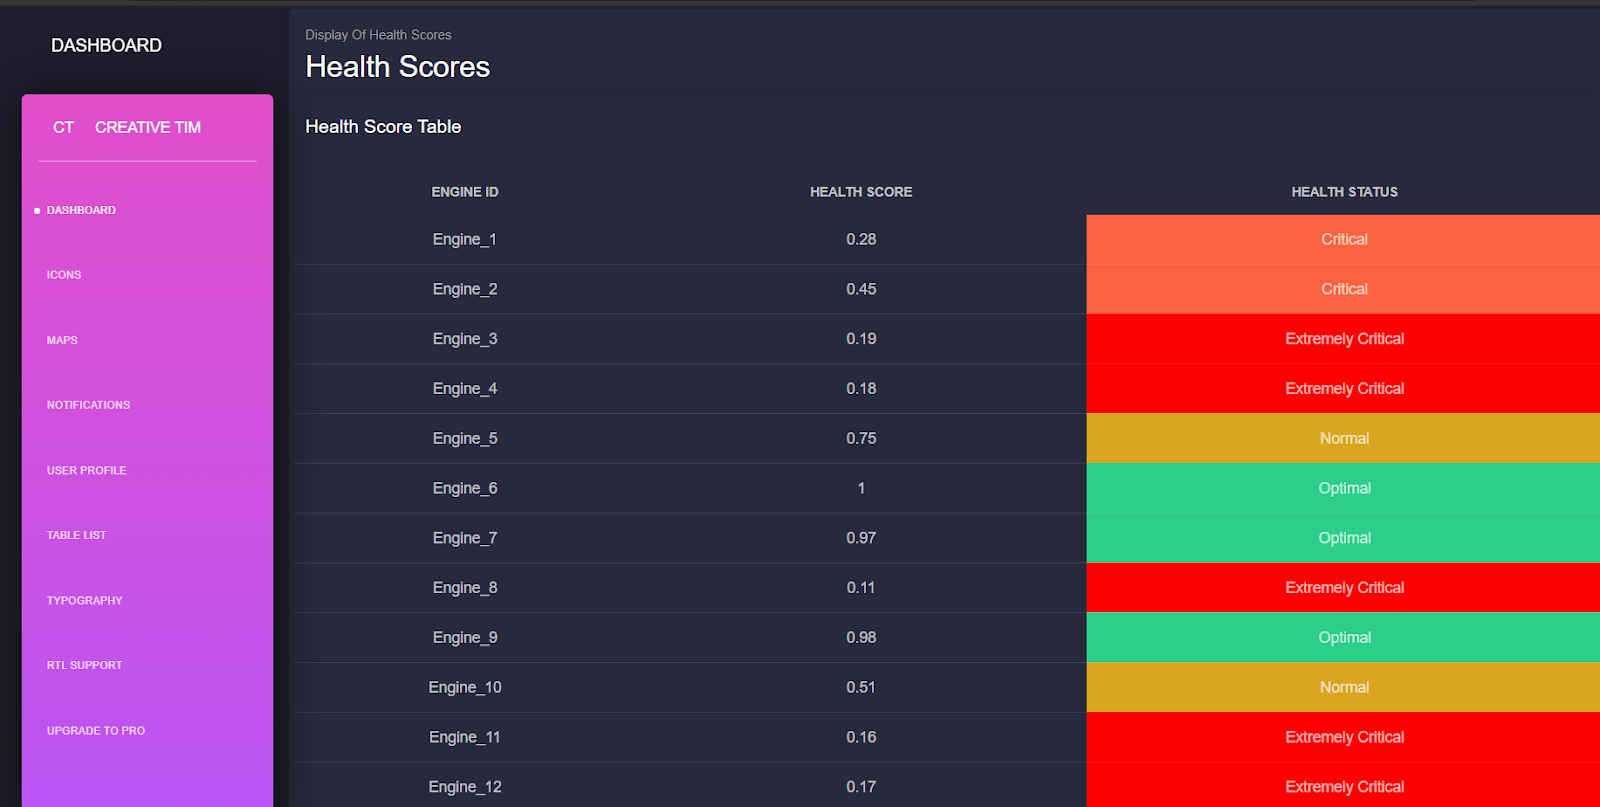.
6. Range of health scores and categories are generated using jinja2 and they are
displayed in a bar chart and a pie chart respectively, using google
visualization tools as shown in the following figure .
## To run the simulation type ```python app.py``` in Anaconda Powershell Prompt.