Ecosyste.ms: Awesome
An open API service indexing awesome lists of open source software.
https://github.com/rochaporto/collectd-ceph
collectd plugins and dashboards for ceph
https://github.com/rochaporto/collectd-ceph
Last synced: 6 days ago
JSON representation
collectd plugins and dashboards for ceph
- Host: GitHub
- URL: https://github.com/rochaporto/collectd-ceph
- Owner: rochaporto
- License: gpl-2.0
- Created: 2014-05-13T03:48:26.000Z (over 10 years ago)
- Default Branch: master
- Last Pushed: 2017-03-08T10:15:42.000Z (over 7 years ago)
- Last Synced: 2024-08-03T11:03:02.487Z (3 months ago)
- Language: Python
- Homepage:
- Size: 394 KB
- Stars: 61
- Watchers: 15
- Forks: 65
- Open Issues: 24
-
Metadata Files:
- Readme: README.md
- License: LICENSE
Awesome Lists containing this project
README
collectd-ceph
==================
## Overview
A set of collectd plugins monitoring and publishing metrics for Ceph components.
## Screenshots
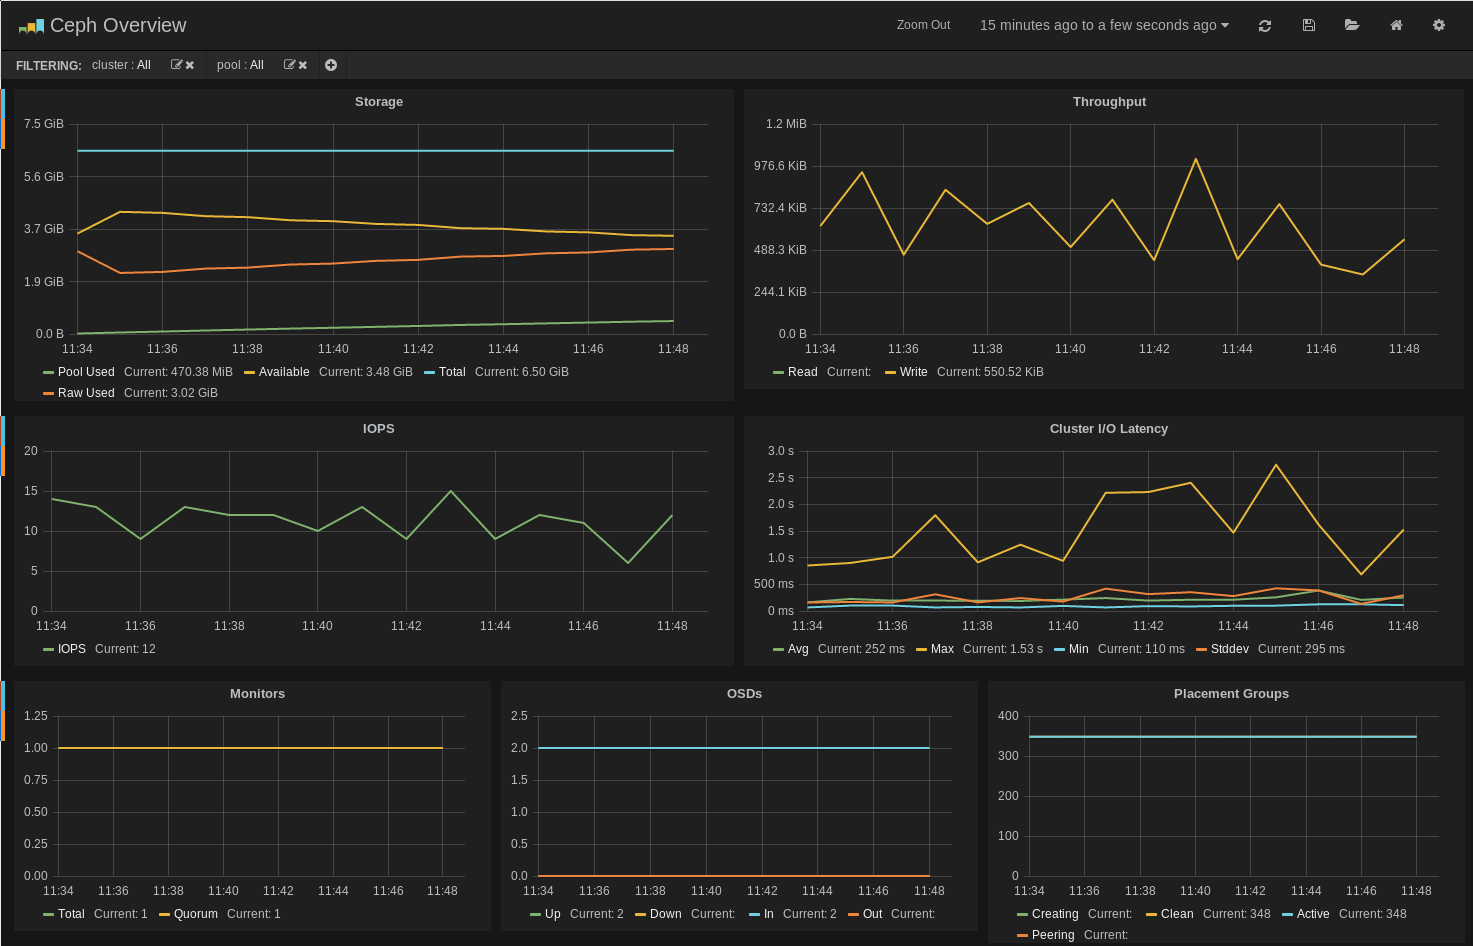
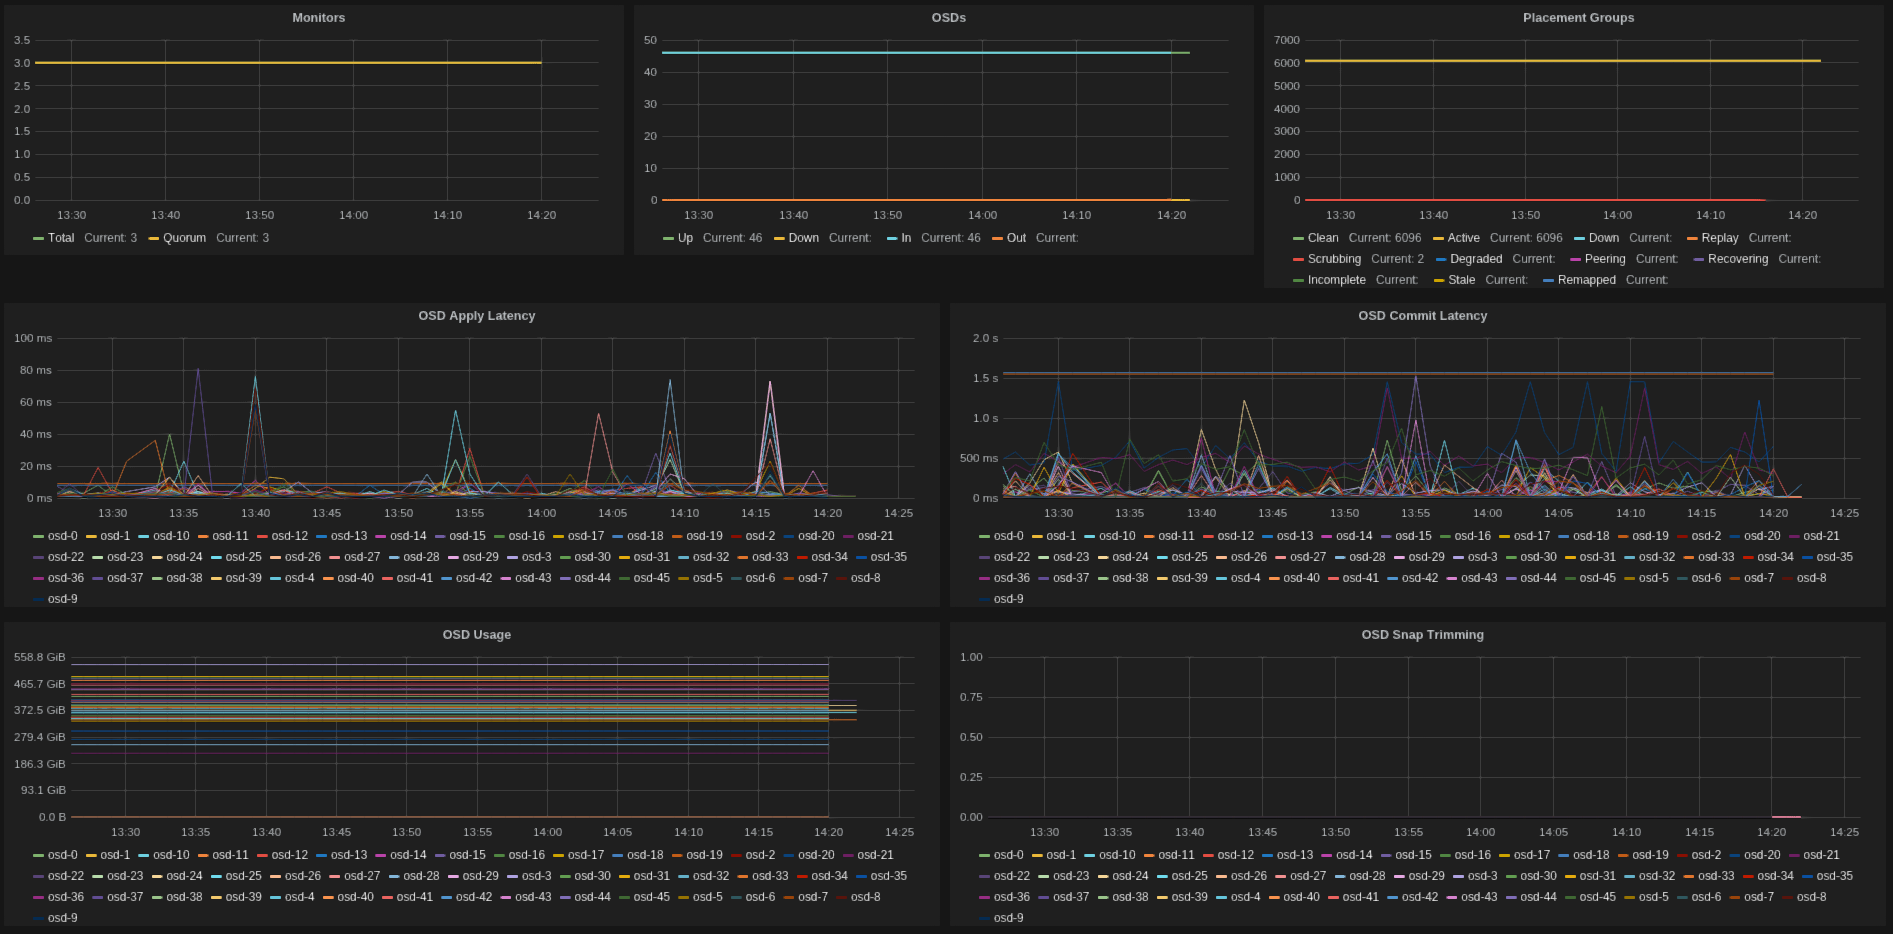
Sample Grafana dashboard displaying common metrics from the plugins.


[Check here](grafana/ceph-overview.json) for the dashboard definition.
## Plugins and Metrics
There are several plugins, usually mapping to the ceph command line tools.
Find below a list of the available plugins and the metrics they publish.
* ceph_monitor_plugin
* ceph-<cluster>.mon.gauge.number (total number of monitors)
* ceph-<cluster>.mon.gauge.quorum (number of monitors in quorum)
* ceph_osd_plugin
* ceph-<cluster>.osd.gauge.up (number of osds 'up')
* ceph-<cluster>.osd.gauge.down (number of osds 'down')
* ceph-<cluster>.osd.gauge.in (number of osds 'in')
* ceph-<cluster>.osd.gauge.out (number of osds 'out')
* ceph_pool_plugin
* ceph-<cluster>.pool-<name>.gauge.read_bytes_sec (per pool read bytes/sec)
* ceph-<cluster>.pool-<name>.gauge.write_bytes_sec (per pool write bytes/sec)
* ceph-<cluster>.pool-<name>.gauge.op_per_sec (per pool iops)
* ceph-<cluster>.pool-<name>.gauge.bytes_used (per pool bytes used)
* ceph-<cluster>.pool-<name>.gauge.kb_used (per pool KBytes used)
* ceph-<cluster>.pool-<name>.gauge.objects (per pool number of objects)
* ceph-<cluster>.cluster.gauge.total_avail (cluster space available)
* ceph-<cluster>.cluster.gauge.total_space (cluster total raw space)
* ceph-<cluster>.cluster.gauge.total_used (cluster raw space used)
* ceph_pg_plugin
* ceph-<cluster>.pg.gauge.<state> (number of pgs in <state>)
* ceph-<cluster>.osd-<id>.gauge.fs_commit_latency (fs commit latency for osd)
* ceph-<cluster>.osd-<id>.gauge.apply_commit_latency (apply commit latency for osd)
* ceph-<cluster>.osd-<id>.gauge.kb_used (kb used by osd)
* ceph-<cluster>.osd-<id>.gauge.kb (total space of osd)
* ceph_latency_plugin
* ceph-<cluster>.cluster.gauge.avg_latency (avg cluster latency)
* ceph-<cluster>.cluster.gauge.max_latency (max cluster latency)
* ceph-<cluster>.cluster.gauge.min_latency (min cluster latency)
* ceph-<cluster>.cluster.gauge.stddev_latency (stddev of cluster latency)
## Requirements
It assumes an existing installation of [collectd](http://collectd.org/documentation.shtml) - check docs for details.
If you want to publish to [graphite](http://graphite.readthedocs.org/), configure the [write_graphite](https://collectd.org/wiki/index.php/Plugin:Write_Graphite) collectd plugin.
And you might want the awesome [grafana](http://grafana.org) too, which provides awesome displays.
## Setup and Configuration
The example configuration(s) below assume the plugins to be located under `/usr/lib/collectd/plugins/ceph`.
If you're under ubuntu, consider installing from [this ppa](https://launchpad.net/~rocha-porto/+archive/collectd).
Each plugin should have its own config file, under `/etc/collectd/conf.d/.conf`, which
should follow something similar to:
```
# cat /etc/collectd/conf.d/ceph_pool.conf
Globals true
ModulePath "/usr/lib/collectd/plugins/ceph"
Import "ceph_pool_plugin"
Verbose "True"
Cluster "ceph"
Interval "60"
TestPool "test"
```
### Puppet
If you use puppet for configuration, then try this excelent [collectd](https://github.com/pdxcat/puppet-module-collectd) module.
It has plenty of docs on how to use it, but for our specific plugins:
```
collectd::plugin::python { 'ceph_pool':
modulepath => '/usr/lib/collectd/plugins/ceph',
module => 'ceph_pool_plugin',
config => {
'Verbose' => 'true',
'Cluster' => 'ceph',
'Interval' => 60,
'TestPool' => 'test',
},
}
```
### Docker
Check [this repo](https://github.com/bobrik/ceph-collectd-graphite) for a nice docker setup to run collectd-ceph (thanks to Ian Babrou).
## Limitations
The debian packaging files are provided, but not yet available in the official repos.
## Development
All contributions more than welcome, just send pull requests.
## License
GPLv2 (check LICENSE).
## Contributors
Ricardo Rocha
## Support
Please log tickets and issues at the [github home](https://github.com/rochaporto/collectd-ceph/issues).
## Additional Notes
Some [handy instructions](docs/ubuntu.md) on how to build for ubuntu.