Ecosyste.ms: Awesome
An open API service indexing awesome lists of open source software.
https://github.com/ropensci/tsbox
tsbox: Class-Agnostic Time Series in R
https://github.com/ropensci/tsbox
graphics r time-series
Last synced: 3 months ago
JSON representation
tsbox: Class-Agnostic Time Series in R
- Host: GitHub
- URL: https://github.com/ropensci/tsbox
- Owner: ropensci
- Created: 2017-03-07T13:06:53.000Z (almost 8 years ago)
- Default Branch: main
- Last Pushed: 2024-07-17T16:36:03.000Z (7 months ago)
- Last Synced: 2024-10-07T15:02:13.873Z (5 months ago)
- Topics: graphics, r, time-series
- Language: R
- Homepage: https://docs.ropensci.org/tsbox
- Size: 22.3 MB
- Stars: 147
- Watchers: 8
- Forks: 12
- Open Issues: 7
-
Metadata Files:
- Readme: README.Rmd
- Contributing: .github/CONTRIBUTING.md
- Codemeta: codemeta.json
Awesome Lists containing this project
README
---
output: github_document
---
```{r, include = FALSE}
knitr::opts_chunk$set(
collapse = TRUE,
comment = "#>",
fig.path = "man/figures/README-",
out.width = "100%"
)
```
# tsbox: Class-Agnostic Time Series in R
[](https://www.repostatus.org/#active)
[](https://app.codecov.io/gh/ropensci/tsbox?branch=main)
[](https://github.com/ropensci/software-review/issues/464)
[](https://github.com/ropensci/tsbox/actions/workflows/R-CMD-check.yaml)
The R ecosystem knows a [vast
number](https://CRAN.R-project.org/view=TimeSeries) of time series
standards. Instead of creating the ultimate [15th](https://xkcd.com/927/) time
series class, tsbox provides a set of tools that are **agnostic towards the
existing standards**. The tools also allow you to handle time series as plain
data frames, thus making it easy to deal with time series in a
[dplyr](https://CRAN.R-project.org/package=dplyr) or
[data.table](https://CRAN.R-project.org/package=data.table) workflow.
See [tsbox.help](https://docs.ropensci.org/tsbox/) for the full documentation of
the package.
To install the stable version from CRAN:
```r
install.packages("tsbox")
```
To install the development version:
```r
# install.packages("remotes")
remotes::install_github("ropensci/tsbox")
install.packages("ropensci/tsbox", repos = "https://ropensci.r-universe.dev")
```
### Convert everything to everything
tsbox is built around a set of converters, which convert time series stored as
**ts**, **xts**, **data.frame**, **data.table**, **tibble**, **zoo**,
**zooreg**, **tsibble**, **tibbletime**, **timeSeries**, **irts** or **tis** to
each other:
```r
library(tsbox)
x.ts <- ts_c(fdeaths, mdeaths)
x.xts <- ts_xts(x.ts)
x.df <- ts_df(x.xts)
x.dt <- ts_dt(x.df)
x.tbl <- ts_tbl(x.dt)
x.zoo <- ts_zoo(x.tbl)
x.zooreg <- ts_zoo(x.zoo)
x.tsibble <- ts_tsibble(x.zooreg)
x.tibbletime <- ts_tibbletime(x.tsibble)
x.timeSeries <- ts_timeSeries(x.tibbletime)
x.irts <- ts_irts(x.tibbletime)
x.tis <- ts_tis(x.irts)
all.equal(ts_ts(x.tis), x.ts)
#> [1] TRUE
```
### Use same functions for time series classes
Because this works reliably, it is easy to write
functions that work for all classes. So whether we want to **smooth**,
**scale**, **differentiate**, **chain**, **forecast**, **regularize** or
**seasonally adjust** a time series, we can use the same commands to whatever
time series class at hand:
```r
ts_trend(x.ts)
ts_pc(x.xts)
ts_pcy(x.df)
ts_lag(x.dt)
```
### Time series of the world, unite!
A set of helper functions makes it easy to combine or align multiple time
series of all classes:
```r
# collect time series as multiple time series
ts_c(ts_dt(EuStockMarkets), AirPassengers)
ts_c(EuStockMarkets, mdeaths)
# combine time series to a new, single time series
ts_bind(ts_dt(mdeaths), AirPassengers)
ts_bind(ts_xts(AirPassengers), ts_tbl(mdeaths))
```
### And plot just about everything
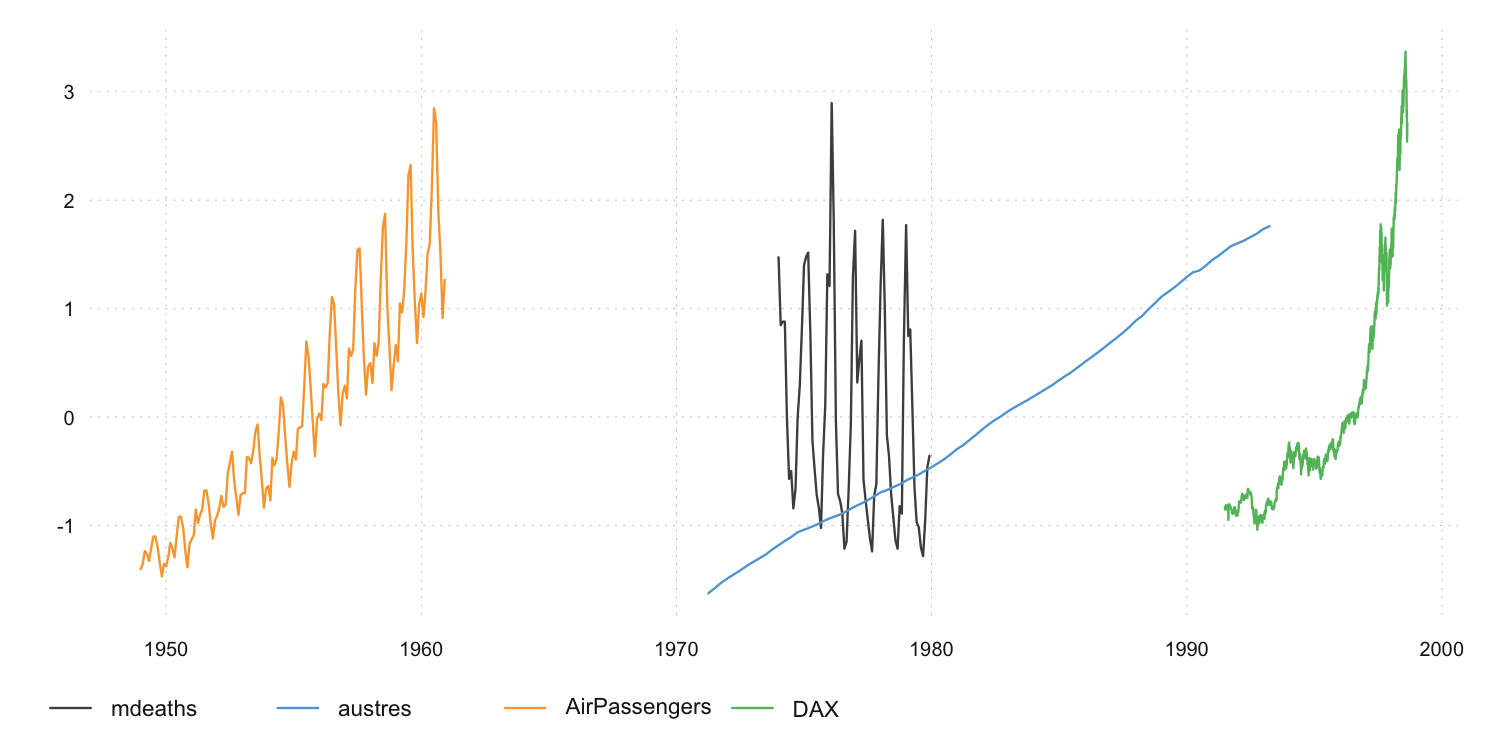
Plotting all kinds of classes and frequencies is as simple as it should be. And
we finally get a legend!
```
ts_plot(ts_scale(ts_c(mdeaths, austres, AirPassengers, DAX = EuStockMarkets[ ,'DAX'])))
```

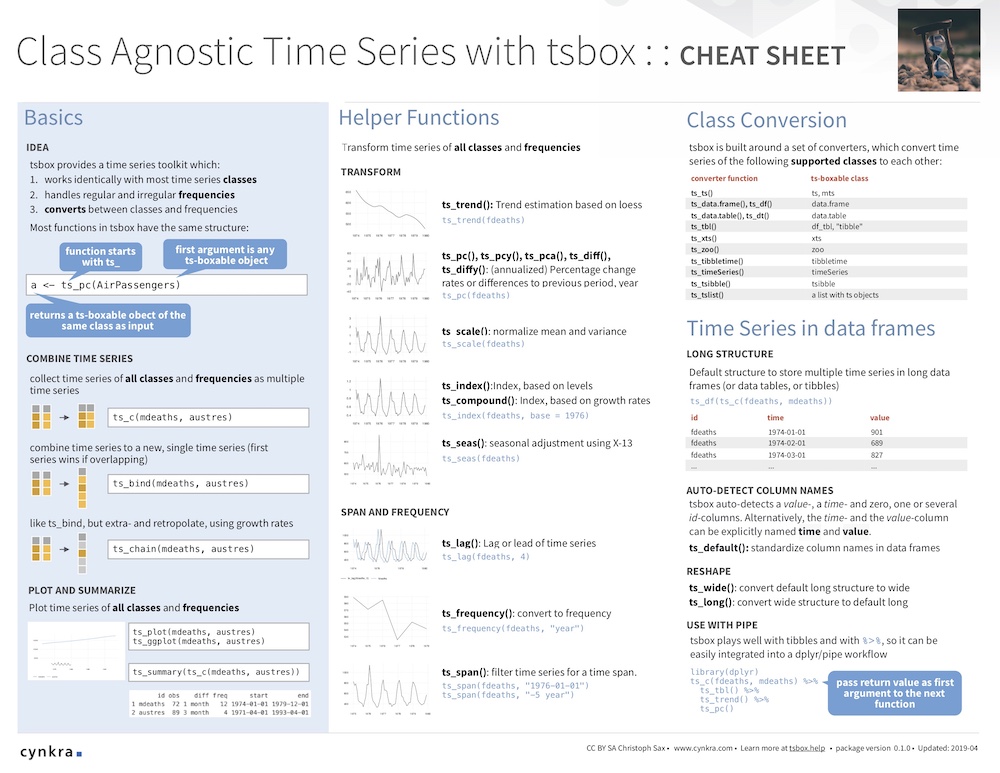
### Cheatsheet
