https://github.com/rose-stl-lab/rose_colormap
Colormap inspired by rose for Python matplotlib or plotly visualization
https://github.com/rose-stl-lab/rose_colormap
Last synced: about 1 year ago
JSON representation
Colormap inspired by rose for Python matplotlib or plotly visualization
- Host: GitHub
- URL: https://github.com/rose-stl-lab/rose_colormap
- Owner: Rose-STL-Lab
- License: mit
- Created: 2022-11-12T19:34:51.000Z (over 3 years ago)
- Default Branch: main
- Last Pushed: 2022-11-14T01:17:17.000Z (over 3 years ago)
- Last Synced: 2025-07-03T01:18:00.180Z (about 1 year ago)
- Language: Python
- Homepage:
- Size: 3.37 MB
- Stars: 0
- Watchers: 0
- Forks: 0
- Open Issues: 0
-
Metadata Files:
- Readme: README.md
- License: LICENSE
Awesome Lists containing this project
README
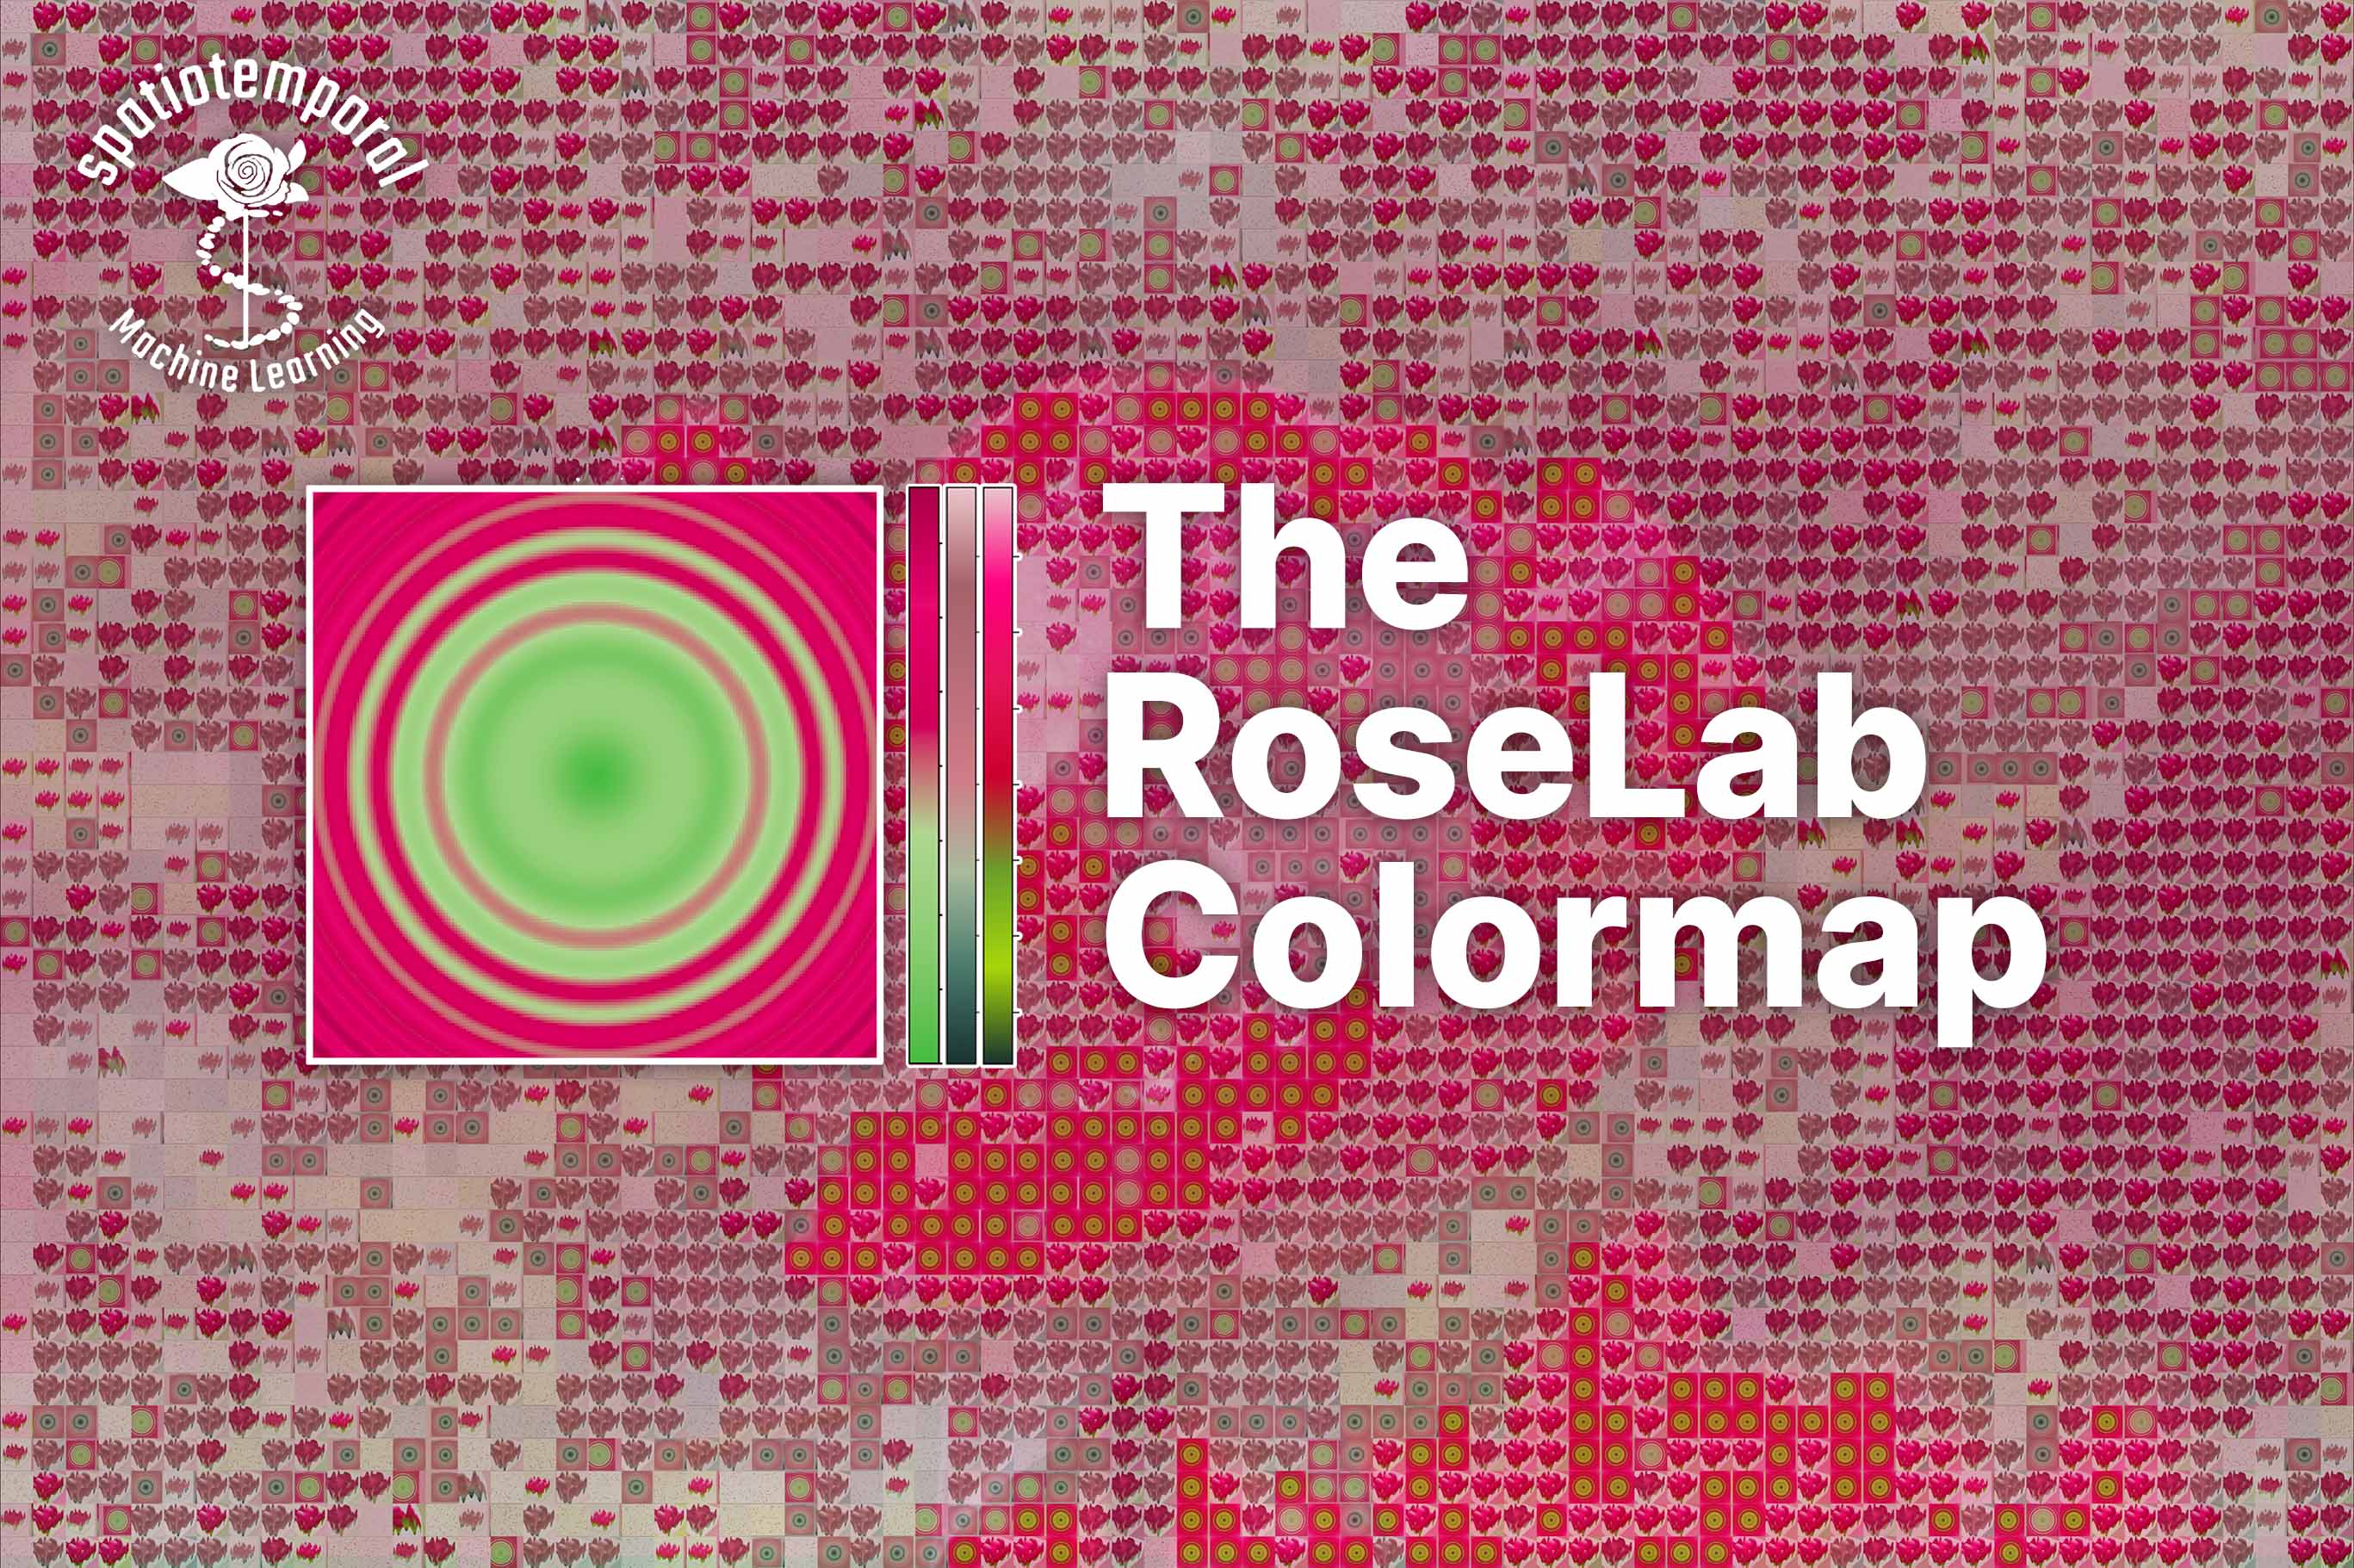
The Rose Colormap - Rose-inspired Python Colormaps

For Spatiotemporal Visualization


## What is the Rose Colormap?

The Rose Colormap is a series of Python colormaps / colorscales including *Rose*, *Rose Muted* and *Rose Vivid*. The pink tops and the green basis constitute a sharp contrast such that it is perfect for visualizing peaks in spatiotemporal dynamics.


    Visualizing spatiotemporal event arrival rate using Rose Vivid


## How do I install the Rose Colormap?

The Rose Colormap can be installed via pip from [PyPI](https://pypi.org/).

```

pip install rose_colormap

```

## How do I use the Rose Colormap?

The Rose colormap can be used with either **Matplotlib** or **Plotly.py**.

**(1) Matplotlib example usage**

```python

import matplotlib.pyplot as plt

import numpy as np

from rose_colormap import rose, rose_muted, rose_vivid

x = np.random.rand(100)

y = np.random.rand(100)

t = np.arange(100)

plt.scatter(x, y, c=t, cmap=rose_vivid)

plt.colorbar()

plt.show()

```

**(2) Plotly Express example usage**

```python

import plotly.express as px

import numpy as np

from rose_colormap.plotly import rose, rose_muted, rose_vivid

x = np.random.rand(100)

y = np.random.rand(100)

t = np.arange(100)

fig = px.scatter(x=x, y=y, color=t, color_continuous_scale=rose_vivid)

fig.show()

```

**(3) Plotly Graph Object example usage**

```python

import plotly.graph_objects as go

import numpy as np

from rose_colormap.plotly import rose, rose_muted, rose_vivid

x = np.outer(np.linspace(-3, 3, 32), np.ones(32))

y = x.copy().T

z = (np.sin(x ** 2) + np.cos(y ** 2))

fig = go.Figure(go.Surface(x=x, y=y, z=z, colorscale=rose_vivid))

fig.show()

```

## Uninstall

```

pip uninstall rose_colormap

```

### Thanks To:

Members of the Rose lab for supporting this work.