https://github.com/rpgove/greadability
Graph layout readability metrics.
https://github.com/rpgove/greadability
graph javascript visualization
Last synced: about 1 year ago
JSON representation
Graph layout readability metrics.
- Host: GitHub
- URL: https://github.com/rpgove/greadability
- Owner: rpgove
- License: bsd-3-clause
- Created: 2016-11-22T16:27:53.000Z (over 9 years ago)
- Default Branch: master
- Last Pushed: 2018-11-20T21:37:08.000Z (over 7 years ago)
- Last Synced: 2024-10-11T11:10:11.664Z (almost 2 years ago)
- Topics: graph, javascript, visualization
- Language: JavaScript
- Homepage:
- Size: 188 KB
- Stars: 77
- Watchers: 5
- Forks: 3
- Open Issues: 3
-
Metadata Files:
- Readme: README.md
- License: LICENSE
Awesome Lists containing this project
README
# Greadability.js
**Greadability.js** is a JavaScript library for computing global **g**raph **readability** metrics on graph layouts. These readability metrics help us answer questions like, which layout is better? Or, has the layout converged, or should it continue running?
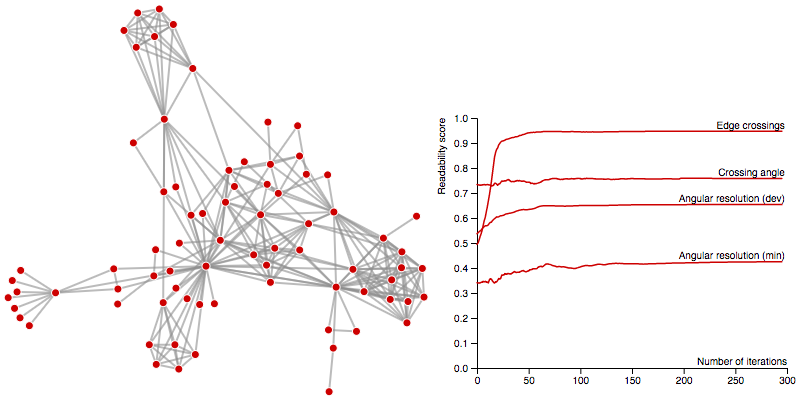
At present, Greadability.js includes four global graph readability metrics:
* *Edge crossings* measures the fraction of edges that cross (intersect) out of an approximate maximum number that can cross.
* *Edge crossing angle* measures the mean deviation of edge crossing angles from the ideal edge crossing angle (70 degrees).
* *Angular resolution (minimum)* measures the mean deviation of adjacent incident edge angles from the ideal minimum angles (360 degrees divided by the degree of that node).
* *Angular resoluction (deviation)* measures the average deviation of angles between incident
edges on each vertex.
Each is a number in the range [0, 1] with higher numbers indicating better layouts. You can use this to measure when a graph layout algorithm has stopped improving (i.e. when it has [converged](https://bl.ocks.org/rpgove/8c8b08cc0ae1e1e969f5d2904a6a0e26)), or to find [good graph layout algorithm parameters](https://bl.ocks.org/rpgove/553450ed8ef2a48acd4121a85653d880).
[ ](https://bl.ocks.org/rpgove/8c8b08cc0ae1e1e969f5d2904a6a0e26)[
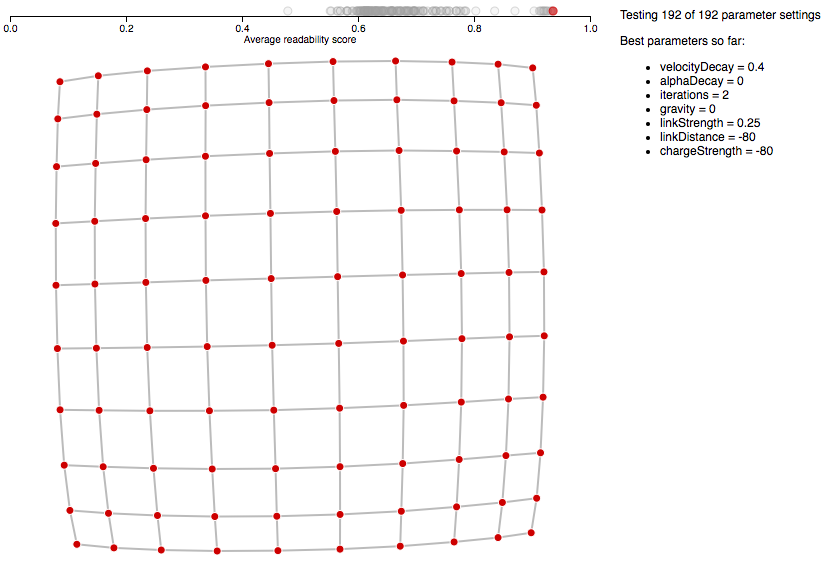 ](https://bl.ocks.org/rpgove/553450ed8ef2a48acd4121a85653d880)
To use this module, create a layout for a graph (e.g. using [D3.js](https://d3js.org)) so that each vertex (also known as a *node*) has `x` and `y` properties for its coordinates and each edge (also known as a *link*) has `source` and `target` properties that point to vertices.
If you use this library please cite the following paper for the definition of the angular resolution (deviation) metric and the proof that it yields values in the range [0, 1]:
Robert Gove. "It Pays to Be Lazy: Reusing Force Approximations to Compute Better Graph Layouts Faster." Proceedings of Forum Media Technology, 2018. [Preprint PDF.](https://osf.io/wgzn5/)
For the other metrics and a general discussion of graph layout readability metrics, see Dunne *et al* and [their earlier tech report](http://www.cs.umd.edu/hcil/trs/2009-13/2009-13.pdf):
C. Dunne, S. I. Ross, B. Shneiderman, and M. Martino. "Readability metric feedback for aiding node-link visualization designers," IBM Journal of Research and Development, 59(2/3) pages 14:1--14:16, 2015.
## Installing
Download the latest version from the [Greadability.js GitHub repository](https://github.com/rpgove/greadability/releases).
You can then use it in a webpage, like this:
```html
var simulation = d3.forceSimulation()
.force("link", d3.forceLink().id(function(d) { return d.id; }).links(graph.links))
.force("charge", d3.forceManyBody())
.nodes(graph.nodes)
.on("end", computeReadability);
function computeReadability () {
var nodes = simulation.nodes();
var links = simulation.force("link").links();
console.log(greadability.greadability(nodes, links));
}
```
Or similarly in Node.js:
```js
const greadability = require('./greadability.js');
var simulation = d3.forceSimulation()
.force("link", d3.forceLink().id(function(d) { return d.id; }).links(graph.links))
.force("charge", d3.forceManyBody())
.nodes(graph.nodes)
.on("end", computeReadability);
function computeReadability () {
var nodes = simulation.nodes();
var links = simulation.force("link").links();
console.log(greadability.greadability(nodes, links));
}
```
## API Reference
# greadability.greadability(nodes, links[, id]) [<>](https://github.com/rpgove/greadability/blob/master/greadability.js#L7 "Source")
Computes the readability metrics of the graph formed by the *nodes* and *links*. Each node in *nodes* must have `x` and `y` attributes specifying each node's position. This function returns an object with the readability metrics as the properties and values:
```javascript
{
crossing: 1,
crossingAngle: 0.7,
angularResolutionMin: 0.34,
angularResolutionDev: 0.56
}
```
If *id* is specified, sets the node id accessor to the specified function. If *id* is not specified, uses the default node id accessor, which defaults to the node's index. Note that if each link's `source` and `target` properties are objects, then the node id accessor is not used. This is the same behavior as the forceSimulation in D3.js.