https://github.com/rstudio/leaflet.mapboxgl
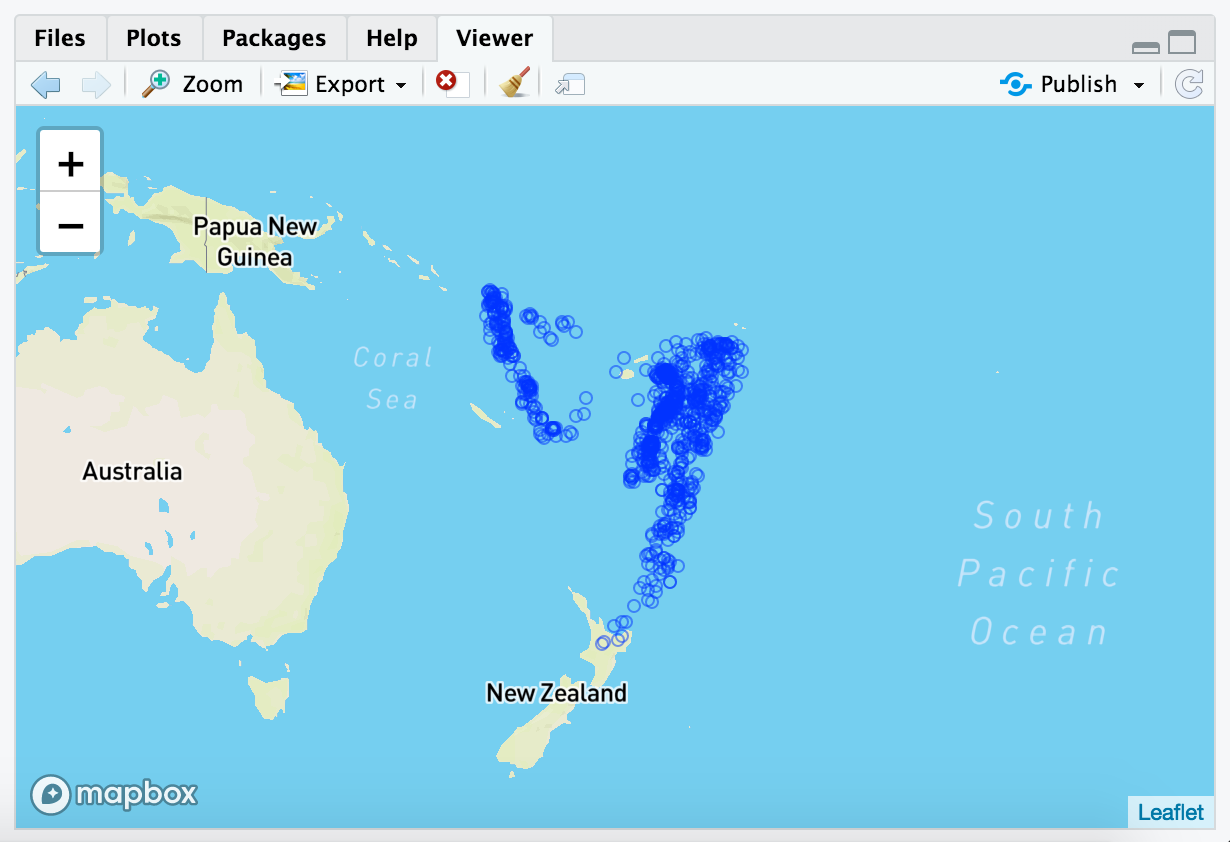
Extends the R Leaflet package with a Mapbox GL JS plugin to allow easy drawing of vector tile layers.
https://github.com/rstudio/leaflet.mapboxgl
Last synced: 3 months ago
JSON representation
Extends the R Leaflet package with a Mapbox GL JS plugin to allow easy drawing of vector tile layers.
- Host: GitHub
- URL: https://github.com/rstudio/leaflet.mapboxgl
- Owner: rstudio
- License: other
- Created: 2019-03-04T19:42:54.000Z (over 6 years ago)
- Default Branch: master
- Last Pushed: 2019-03-14T07:05:53.000Z (over 6 years ago)
- Last Synced: 2024-08-06T03:04:17.620Z (11 months ago)
- Language: R
- Size: 3.62 MB
- Stars: 50
- Watchers: 9
- Forks: 5
- Open Issues: 2
-
Metadata Files:
- Readme: README.md
- License: LICENSE
Awesome Lists containing this project
README
        # leaflet.mapboxgl

Provides an R interface to extend the [R Leaflet](https://rstudio.github.io/leaflet/) package with the [Mapbox GL Leaflet](https://github.com/mapbox/mapbox-gl-leaflet) plugin.

## Compatibility

WebGL support is required. Most modern web browsers are supported, but IE11 may not work.

RStudio 1.1 on Windows and Linux do not support WebGL and will not work. RStudio 1.1 for Mac should work.

RStudio 1.2 will work if the rendering engine is set to Desktop OpenGL, which is the default on many systems. If your maps fail to render, you can try changing the rendering engine from the default value of "Auto-detect" to "Desktop OpenGL" by going to Tools | Global Options | General | Advanced | Rendering Engine. (Tip: If this puts your IDE into an unusable state, holding Ctrl during startup will bring up a dialog that lets you revert the Rendering Engine setting to "Auto-detect".)

## Installation

This package is not yet available on CRAN.

```r

devtools::install_github("rstudio/leaflet.mapboxgl")

```

## Usage

First, you must provide your [Mapbox access token](https://docs.mapbox.com/help/how-mapbox-works/access-tokens/#creating-and-managing-access-tokens) as a global R option. (If you are using non-Mapbox datasource, you still need to provide a value, but it can just be `NA`.)

```r

options(mapbox.accessToken = "...")

```

Then, create your Leaflet map, and call the `addMapboxGL` function.

```r

library(leaflet)

library(leaflet.mapboxgl)

leaflet(quakes) %>%

  addMapboxGL(style = "mapbox://styles/mapbox/streets-v9") %>%

  addCircleMarkers(weight = 1, fillOpacity = 0, radius = 3)

```


## License

MIT