https://github.com/rubixml/colors
Demonstrating unsupervised clustering using the K Means algorithm and synthetic color data.
https://github.com/rubixml/colors
clustering contingency-table cross-validation k-means k-means-clustering k-means-plus-plus kmeans machine-learning machine-learning-tutorial php php-machine-learning php-ml rubix-ml synthetic-data synthetic-dataset-generation tutorial unsupervised-learning
Last synced: 11 months ago
JSON representation
Demonstrating unsupervised clustering using the K Means algorithm and synthetic color data.
- Host: GitHub
- URL: https://github.com/rubixml/colors
- Owner: RubixML
- License: mit
- Created: 2018-12-22T00:35:40.000Z (over 7 years ago)
- Default Branch: master
- Last Pushed: 2022-04-29T03:59:58.000Z (about 4 years ago)
- Last Synced: 2024-11-24T20:47:06.771Z (over 1 year ago)
- Topics: clustering, contingency-table, cross-validation, k-means, k-means-clustering, k-means-plus-plus, kmeans, machine-learning, machine-learning-tutorial, php, php-machine-learning, php-ml, rubix-ml, synthetic-data, synthetic-dataset-generation, tutorial, unsupervised-learning
- Language: PHP
- Homepage: https://rubixml.com
- Size: 251 KB
- Stars: 17
- Watchers: 4
- Forks: 3
- Open Issues: 0
-
Metadata Files:
- Readme: README.md
- License: LICENSE
Awesome Lists containing this project
README
# Rubix ML - Color Clusterer
The K Means algorithm is a popular unsupervised learner for clustering samples. In this tutorial, we'll generate a synthetic dataset of colors so that we can demonstrate how K Means clusters them into groups.
- **Difficulty**: Easy
- **Training time**: Less than a minute
## Installation
Clone the project locally using [Composer](https://getcomposer.org/):
```sh
$ composer create-project rubix/colors
```
## Requirements
- [PHP](https://php.net) 7.4 or above
## Tutorial
### Introduction
In machine learning, synthetic data are often used for demonstration purposes or to augment a smaller dataset with more training samples. In this tutorial we'll use synthetic data to train and test a [K Means](https://rubixml.github.io/ML//latest/clusterers/k-means.html) clusterer to group samples by color. K Means is a highly-scalable algorithm that works by finding the center vectors (called *centroids*) for every *k* clusters of the training set. During inference, the distance from an unknown sample to each centroid is measured to determine the cluster it belongs to.
> **Note:** The source code for this example can be found in the [train.php](https://github.com/RubixML/Colors/blob/master/train.php) file in project root.
### Generating the Data
Rubix ML provides a number of dataset [Generators](https://rubixml.github.io/ML//latest/datasets/generators/api.html) which output a dataset in a particular shape and dimensionality. For this example project, we are going to generate [Blobs](https://rubixml.github.io/ML//latest/datasets/generators/blob.html) of color channel data using red, green, and blue (RGB) values for the features. The [Agglomerate](https://rubixml.github.io/ML//latest/datasets/generators/agglomerate.html) will combine and label the individual color generators to form a [Labeled](https://rubixml.github.io/ML//latest/datasets/labeled.html) dataset consisting of all 10 colors weighted equally.
```php
use Rubix\ML\Datasets\Generators\Agglomerate;
use Rubix\ML\Datasets\Generators\Blob;
$generator = new Agglomerate([
'red' => new Blob([255, 0, 0], 20.0),
'orange' => new Blob([255, 128, 0], 10.0),
'yellow' => new Blob([255, 255, 0], 10.0),
'green' => new Blob([0, 128, 0], 20.0),
'blue' => new Blob([0, 0, 255], 20.0),
'aqua' => new Blob([0, 255, 255], 10.0),
'purple' => new Blob([128, 0, 255], 10.0),
'pink' => new Blob([255, 0, 255], 10.0),
'magenta' => new Blob([255, 0, 128], 10.0),
'black' => new Blob([0, 0, 0], 10.0),
]);
```
To generate the dataset, call the `generate()` method with the number of samples (*n*) to be generated as an argument. The return value is a [Dataset](https://rubixml.github.io/ML//latest/datasets/generators/api.html) object that allows you to process the data fluently using its methods if needed. For example we could stratify and split the dataset into a training and testing set such that each subset contains a proportion of the dataset and each color is represented fairly in each subset. The proportion of samples in the *left* (training) set to the *right* (testing) set is given by the *ratio* parameter of the `stratifiedSplit()` method. For this example, we'll choose to generate a set of 5,000 samples and then split it 80/20 (4000 for training and 1000 for testing).
```php
[$training, $testing] = $generator->generate(5000)->stratifiedSplit(0.8);
```
Now, let's take a look at the data we've generated using some plotting software such as [Plotly](https://plot.ly). You'll notice that each color forms a distinct blob in 3-dimensional space.

### Instantiating the Learner
Next, we'll instantiate our [K Means](https://rubixml.github.io/ML//latest/clusterers/k-means.html) clusterer by defining its hyper-parameters. K Means is a fast online clustering algorithm that minimizes the inertia cost function using Mini Batch Gradient Descent. The algorithm finds a set of *k* cluster centroids or multivariate means of the target cluster. The number of target clusters (k) is passes as a hyper-parameter to the learners constructor. For this example, we already know that the number of clusters should be 10 so we'll set k to 10.
```php
use Rubix\ML\Clusterers\KMeans;
$estimator = new KMeans(10);
```
### Training
Once the learner has been instantiated, call the `train()` method with the training set we generated earlier as an argument.
```php
$estimator->train($training);
```
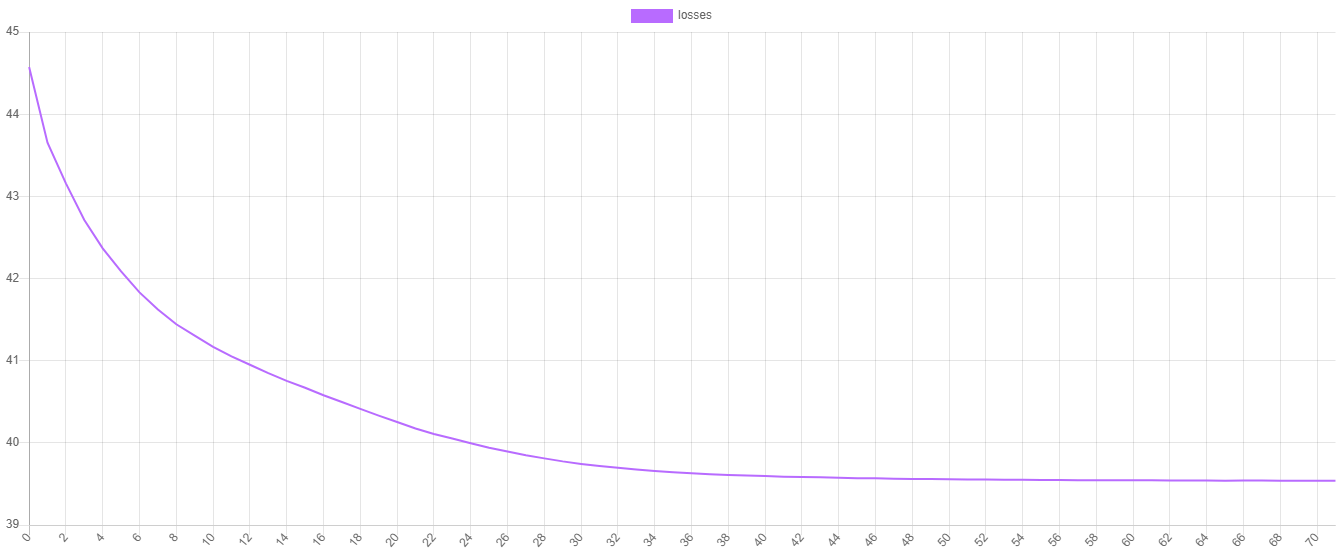
### Training Loss
K Means uses the inertia cost function to measure the goodness of fit of each of the k centroids. We can visualize the training progress by plotting the values of the cost function at each epoch. To obtain the training losses call the `steps()` method on the estimator. To save the progress to a file we can pass the iterator returned by the `steps()` method to the `export()` method of a [Writable](https://rubixml.github.io/ML//latest/extractors/api.html) extractor.
```php
use Rubix\ML\Extractors\CSV;
$extractor = new CSV('progress.csv', true);
$extractor->export($estimator->steps());
```
Now, we can plot the values using our favorite plotting software. As you can see, the value of the cost function decreases at each epoch until it stops when K Means has met its stopping criteria.
### Making Predictions
To make the predictions, pass the testing set to the `predict()` method on the estimator instance.
```php
$predictions = $estimator->predict($testing);
```
### Cross Validation
Lastly, to test the model we just created, let's generate a cross validation report that compares the predictions to some ground truth given by the labels we've assigned to the generators. A [Contingency Table](https://rubixml.github.io/ML//latest/cross-validation/reports/contingency-table.html) is a clustering report similar to a [Confusion Matrix](https://rubixml.github.io/ML//latest/cross-validation/reports/confusion-matrix.html) but for clustering instead of classification. It counts the number of times a particular cluster was assigned to a given label. A good clustering has a contingency table where each cluster contains samples with roughly the same label. We'll need the predictions we generated earlier as well as the labels from the testing set for the report's `generate()` method.
```php
use Rubix\ML\CrossValidation\Reports\ContingencyTable;
$report = new ContingencyTable();
$results = $report->generate($predictions, $testing->labels());
```
Now we're ready to run the training and validation script from the command line.
```php
$ php train.php
```
Here is an excerpt of the Contingency Report. You'll notice a misclustered magenta point within the red cluster. Not bad, nice work!
```json
{
"8": {
"red": 100,
"orange": 0,
"yellow": 0,
"green": 0,
"blue": 0,
"aqua": 0,
"purple": 0,
"pink": 0,
"magenta": 1,
"black": 0
},
}
```
> **Note:** Due to the stochastic nature of the K Means algorithm, each clustering will be a little different. If a particular clustering is poor, you can try retraining the learner.
### Next Steps
Congratulations on completing the tutorial on K Means and synthetic data generation. Try generating some more data in other shapes using the [Circle](https://rubixml.github.io/ML//latest/datasets/generators/circle.html) or [Half Moon](https://rubixml.github.io/ML//latest/datasets/generators/half-moon.html) generator. Is K Means able to detect clusters of different shapes and sizes?
## License
The code is licensed [MIT](LICENSE) and the tutorial is licensed [CC BY-NC 4.0](https://creativecommons.org/licenses/by-nc/4.0/).