Ecosyste.ms: Awesome
An open API service indexing awesome lists of open source software.
https://github.com/s3k/latte-charts
Elm Charts
https://github.com/s3k/latte-charts
chart elm elm-lang pet-project
Last synced: 2 months ago
JSON representation
Elm Charts
- Host: GitHub
- URL: https://github.com/s3k/latte-charts
- Owner: s3k
- Created: 2017-12-11T07:40:24.000Z (about 7 years ago)
- Default Branch: master
- Last Pushed: 2018-02-11T19:16:09.000Z (almost 7 years ago)
- Last Synced: 2024-09-30T05:23:03.969Z (3 months ago)
- Topics: chart, elm, elm-lang, pet-project
- Language: Elm
- Homepage:
- Size: 457 KB
- Stars: 8
- Watchers: 1
- Forks: 0
- Open Issues: 0
-
Metadata Files:
- Readme: readme.md
Awesome Lists containing this project
README

### Hello
It is an experimental Elm charting library. Here I’m attempting to figure out how to use Elm language in practice.
At this moment my project goes through **alpha** version, so your feedback, suggestions and pull requests are welcome!
Check [Interactive Demo](https://s3k.github.io/latte-charts/).
Or clone this repo to your local machine and explore [examples](https://github.com/s3k/latte-charts/tree/master/example) through `elm-reactor`.
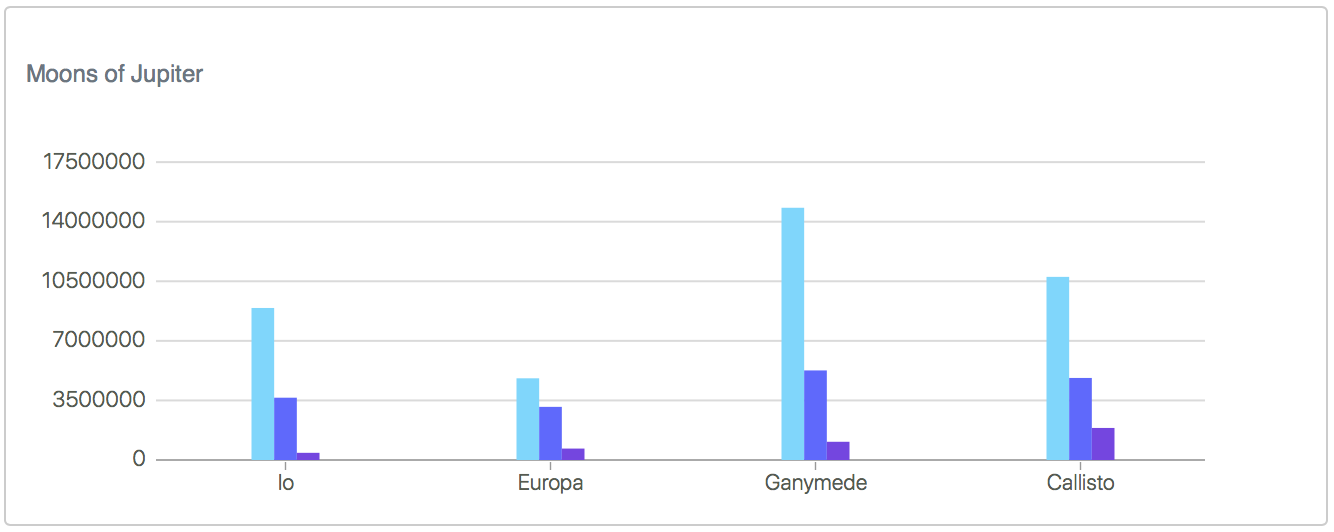
**Multiple Bar Chart**
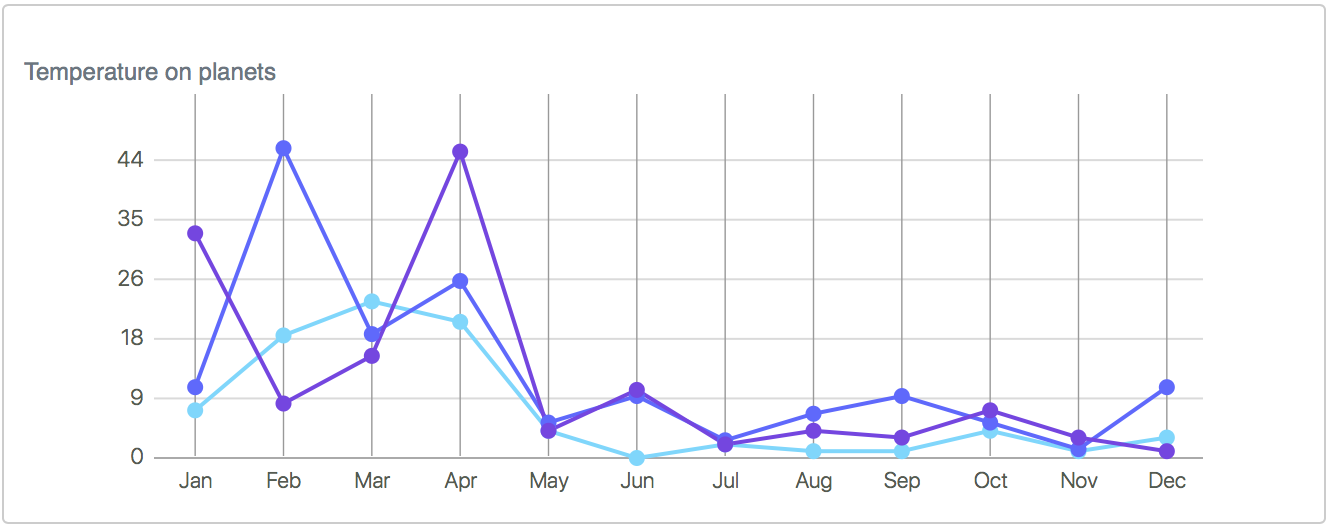
**Line Chart**
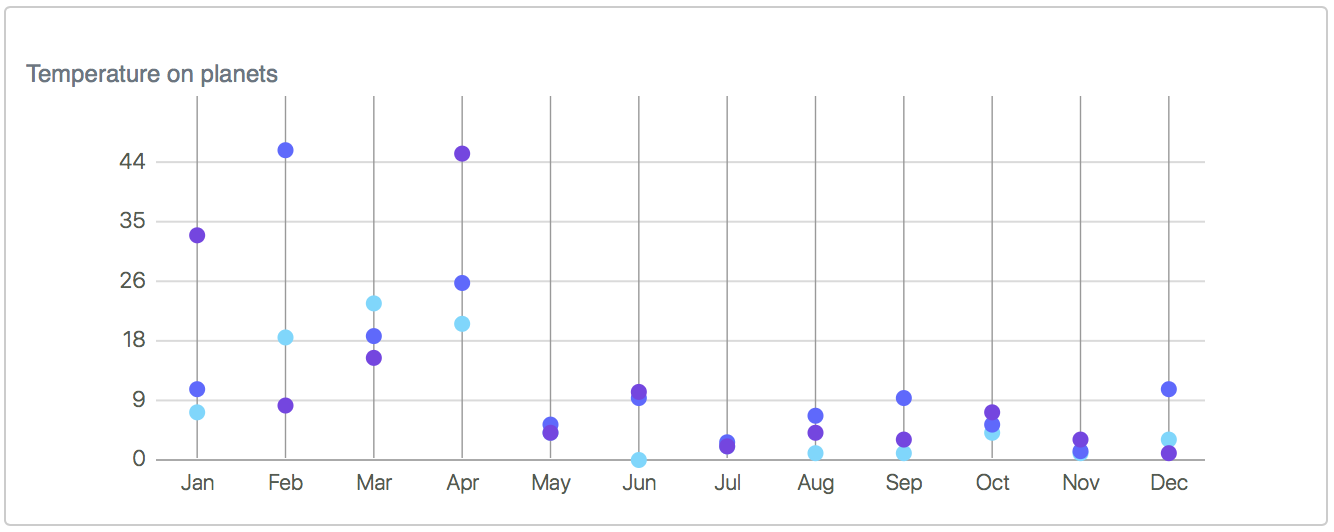
**Scatter Chart**
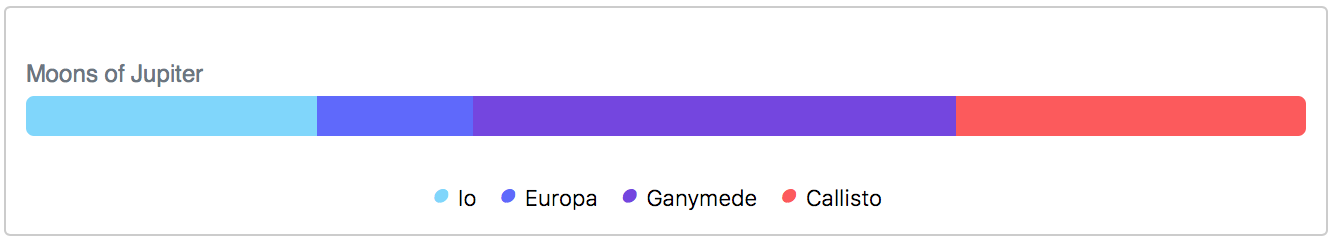
**Percentage Chart**
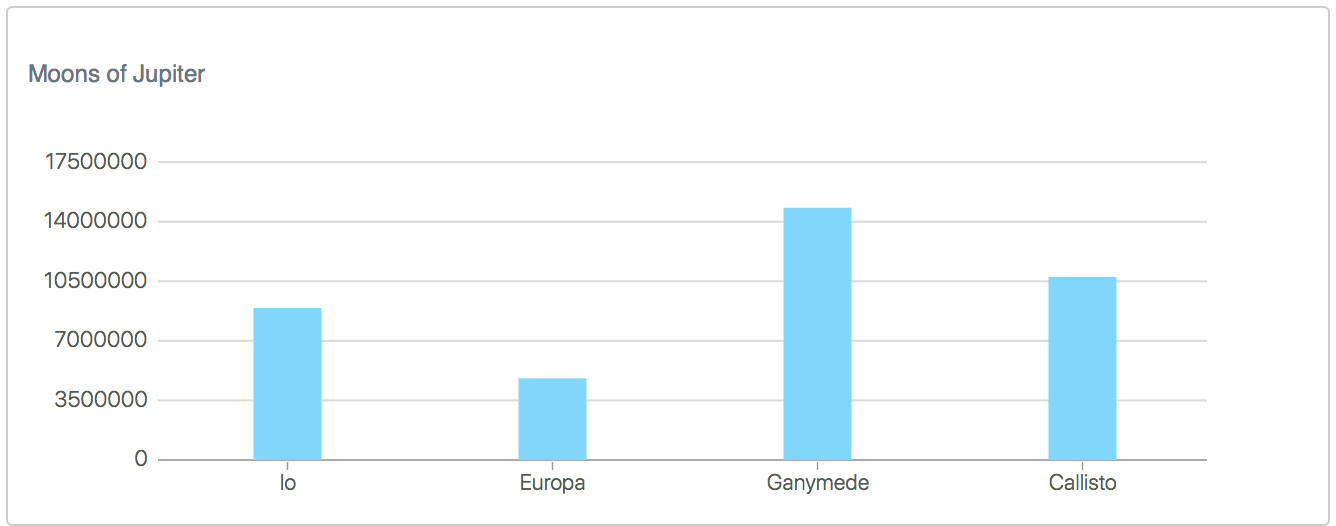
**Simple Bar Chart**
### TL; DR
1. Add Latte Chart package to your project with `$ elm package install s3k/latte-charts`
1. Import functions and types from Latte package
1. Describe new latte state in your Html.program (The Elm Architecture pattern). Use **latteMake** helper
1. Connect all chart events in **update** section
1. To render Latte Chart component in your view use **latteDraw** function through **Html.map**
### How to install?
Just add a new package by running the following command:
```
$ elm package install s3k/latte
```
And import main functions and types:
```elm
import Latte exposing (..)
import Latte.Model as LatteModel exposing (Chart(..), Dataset)
import Latte.Msg as LatteMsg
```
### Model. Data preparation
Use helper **latteInit** to create Latte Chart model:
1. Set rendering options: hight x width
1. Choose the chart type: **Bar | Line | Scatter | Percentage**
1. Fill labels and datasets. Labels are Strings and datasets are Floats
```elm
type alias Model =
{ latte : LatteModel.Model
}
init : ( Model, Cmd Msg )
init =
let
model =
{ latte =
latteInit 640 200 <|
{ chart = Bar
, labels =
[ "Io", "Europa", "Ganymede", "Callisto", "Fake" ]
, datasets =
[ Dataset "Mass" [ 8931900, 4800000, 14819000, 10759000, 10759000 ]
, Dataset "Diameter" <|
List.map ( -> n * 1000) [ 3660.0, 3121.6, 5262.4, 4820.6, 4000 ]
, Dataset "Semi-Major" [ 421700, 671034, 1070412, 1882709, 1882709 ]
]
, title = "Biggest Moons of Jupiter"
}
}
in
model ! []
```
### Update. Connect latte chart to update event loop
Create new message type and add handler in an update section:
```elm
type Msg
= Latte LatteMsg.Msg
update : Msg -> Model -> ( Model, Cmd Msg )
update msg model =
case msg of
Latte msg ->
( { model | latte = latteUpdate msg model.latte }, Cmd.none )
```
### View. Render a component
Use **latteView** function to render a chart through **Html.map** function to route all events in a component:
```elm
view : Model -> Html Msg
view model =
div []
[ Html.map Latte (latteView model.latte)]
```
### Outro
The next steps are:
- adding negative values
- fixing bugs with tooltip position
- auto-scaling by width
If someone have ideas of how to do that, let me know.