https://github.com/saboye/sales-performance-analysis
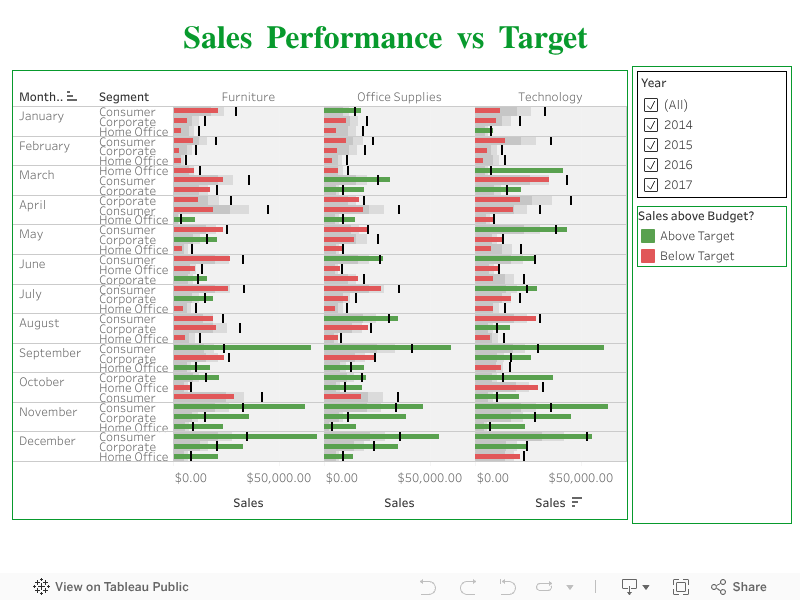
A dashboard that presents monthly sales performance by product segment and product category to help clients identifying the segments and categories that have met or exceeded their sales targets, as well as those that have not met their sales targets.
https://github.com/saboye/sales-performance-analysis
dashboard data data-science eda tableau visualization
Last synced: 5 months ago
JSON representation
A dashboard that presents monthly sales performance by product segment and product category to help clients identifying the segments and categories that have met or exceeded their sales targets, as well as those that have not met their sales targets.
- Host: GitHub
- URL: https://github.com/saboye/sales-performance-analysis
- Owner: saboye
- Created: 2020-08-30T08:26:54.000Z (almost 6 years ago)
- Default Branch: master
- Last Pushed: 2021-10-18T02:04:36.000Z (over 4 years ago)
- Last Synced: 2025-05-21T00:16:58.878Z (about 1 year ago)
- Topics: dashboard, data, data-science, eda, tableau, visualization
- Homepage: https://public.tableau.com/profile/samuel.g.#!/vizhome/SalesPerformacevsTarget/SalesPerformancevsTargetDB
- Size: 386 KB
- Stars: 0
- Watchers: 1
- Forks: 0
- Open Issues: 0
-
Metadata Files:
- Readme: README.md
Awesome Lists containing this project
README
           Sales Performance Analysis

## Background

Mike Goodman, the head of Product Management of a retail products company, is responsible for determining which products his company should continue to offer for sale and which products should be discontinued from the company’s product catalog.

## Objective

To build a dashboard that will present monthly sales performance by product segment and product category to help client identifying the segments and categories that have met or exceeded their sales targets, as well as those that have not met their sales targets.

Domain: Ecommerce

Dataset Description

We will be using two datasets here i.e. Sample - Superstore and Sales_Target.

* Sample -Superstore which covers Orders data from 2014 - 2017;

Within this file you will find the following fields:

Analysis Tasks

Use the Saved Sample – Superstore dataset.

Create a bullet chart with Category and Segment dimensions and Sales measures.

Blend the data with the Saved Sample - Sales Target data set to bring in the Sales Target measure.

Color code the chart to identify Categories and Segments that are above or below target.

Add the year of sales to the view to identify trends and outliers.

Add a filter so that the user can select one, more than one, or all years.

Create a dashboard with this view.

Dashboard


### Author

👤 **SABOYE**

* Twitter: [@saboye1](https://twitter.com/saboye1 )

* Github: [@saboye](https://github.com/saboye)

### 🤝 Contributing

Contributions, issues and feature requests are welcome!
Feel free to check [issues page](https://github.com/saboye/Sales-Performance-Analysis/issues).

### Show your support

Give a ⭐️ if this project helped you!

### 📝 License

Copyright © 2020 [saboye](https://github.com/saboye).


This project is [MIT](https://github.com/saboye/Sales-Performance-Analysis/blob/master/LICENSE) licensed.

***