https://github.com/sachinkg12/heaplens
https://github.com/sachinkg12/heaplens
android developer-tools heap-dump java jvm memory-analysis memory-leak profiling rust vscode-extension
Last synced: 4 months ago
JSON representation
- Host: GitHub
- URL: https://github.com/sachinkg12/heaplens
- Owner: sachinkg12
- License: apache-2.0
- Created: 2026-01-13T06:17:55.000Z (6 months ago)
- Default Branch: main
- Last Pushed: 2026-03-28T04:49:54.000Z (4 months ago)
- Last Synced: 2026-03-28T09:37:48.015Z (4 months ago)
- Topics: android, developer-tools, heap-dump, java, jvm, memory-analysis, memory-leak, profiling, rust, vscode-extension
- Language: Rust
- Homepage: https://sachinkg12.github.io/heaplens/
- Size: 68.3 MB
- Stars: 7
- Watchers: 1
- Forks: 2
- Open Issues: 2
-
Metadata Files:
- Readme: README.md
- Contributing: CONTRIBUTING.md
- License: LICENSE
- Citation: CITATION.cff
Awesome Lists containing this project
README
# HeapLens — Java & Android Heap Dump Analyzer
**The fastest way to understand Java heap dumps — right inside VS Code.**
[](https://marketplace.visualstudio.com/items?itemName=guptasachinn.heaplens)
[](https://marketplace.visualstudio.com/items?itemName=guptasachinn.heaplens)
[](LICENSE)
[](https://doi.org/10.5281/zenodo.19121302)
---
## Why HeapLens?
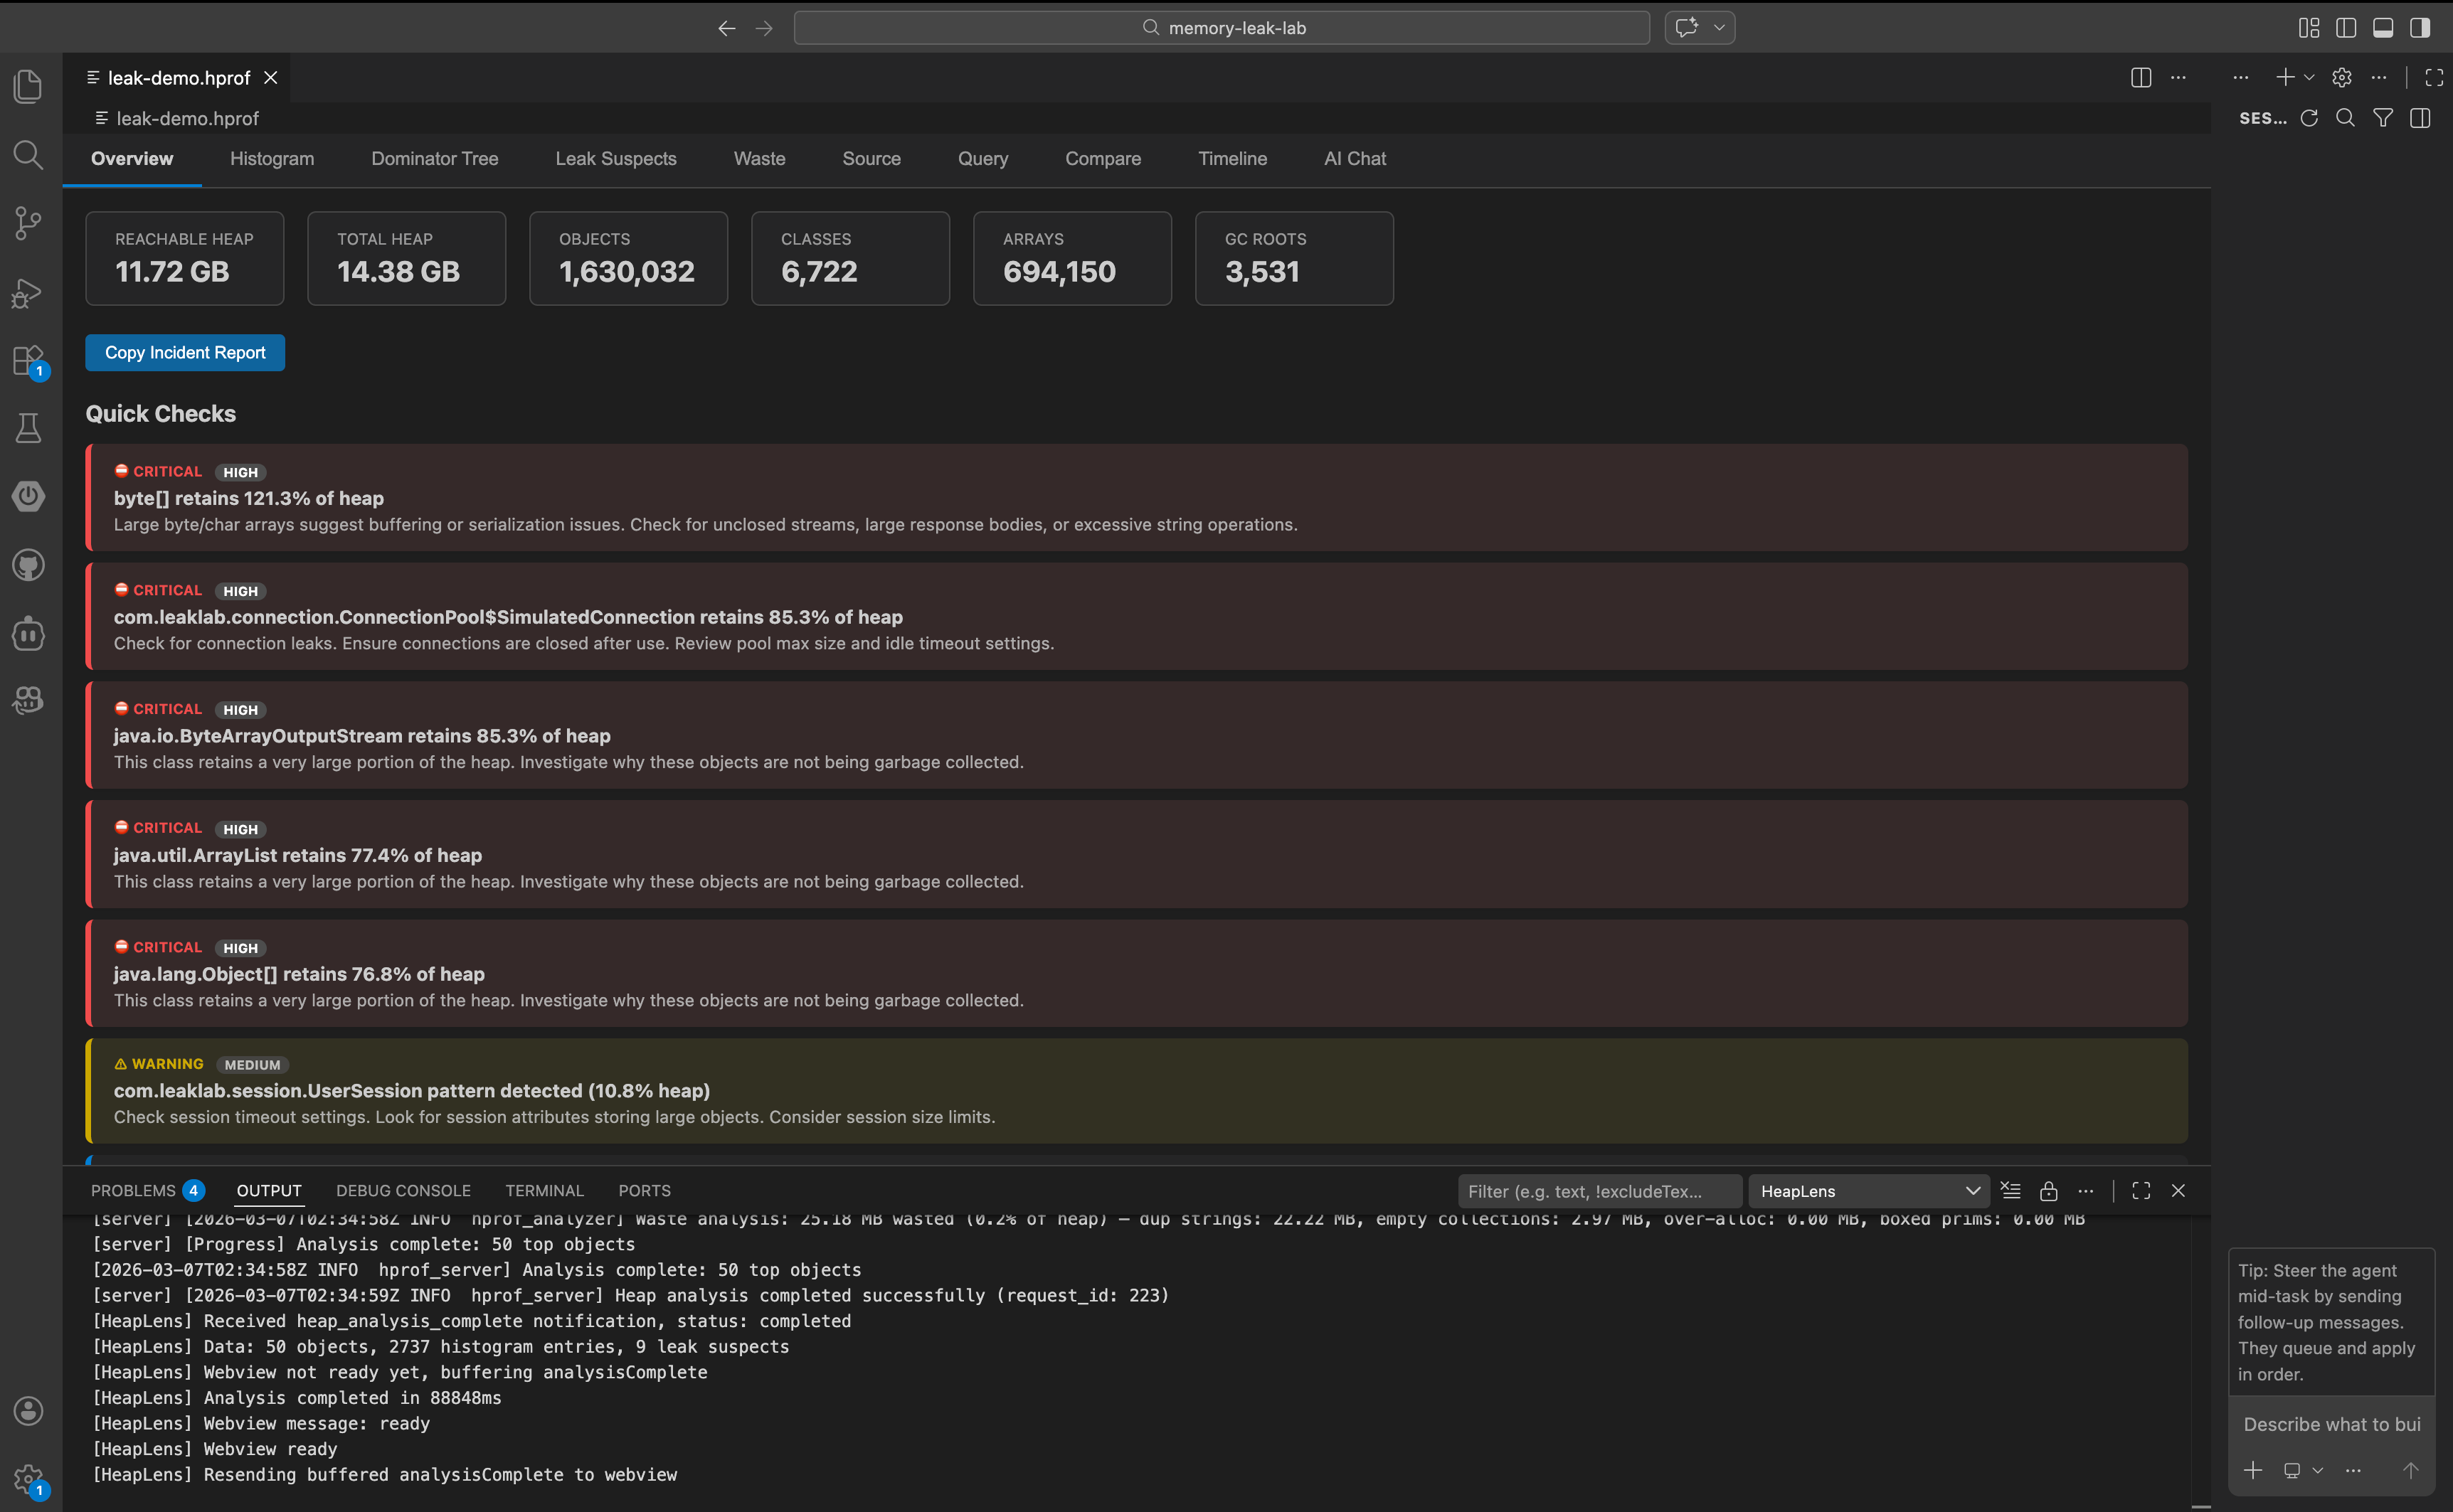
HeapLens brings Java and Android heap dump analysis into VS Code. Open any `.hprof` file and instantly explore memory usage through 10 interactive views — dominator trees, class histograms, leak suspects, waste detection, and more. No separate tools. No context switching. No uploading to cloud services.
HeapLens includes a built-in AI assistant that explains heap analysis findings in plain English and suggests code-level fixes. Ask questions like *"Why is my app using 2 GB of memory?"* or *"What's causing this OutOfMemoryError?"* and get actionable answers powered by your choice of 10 LLM providers including local models via Ollama.
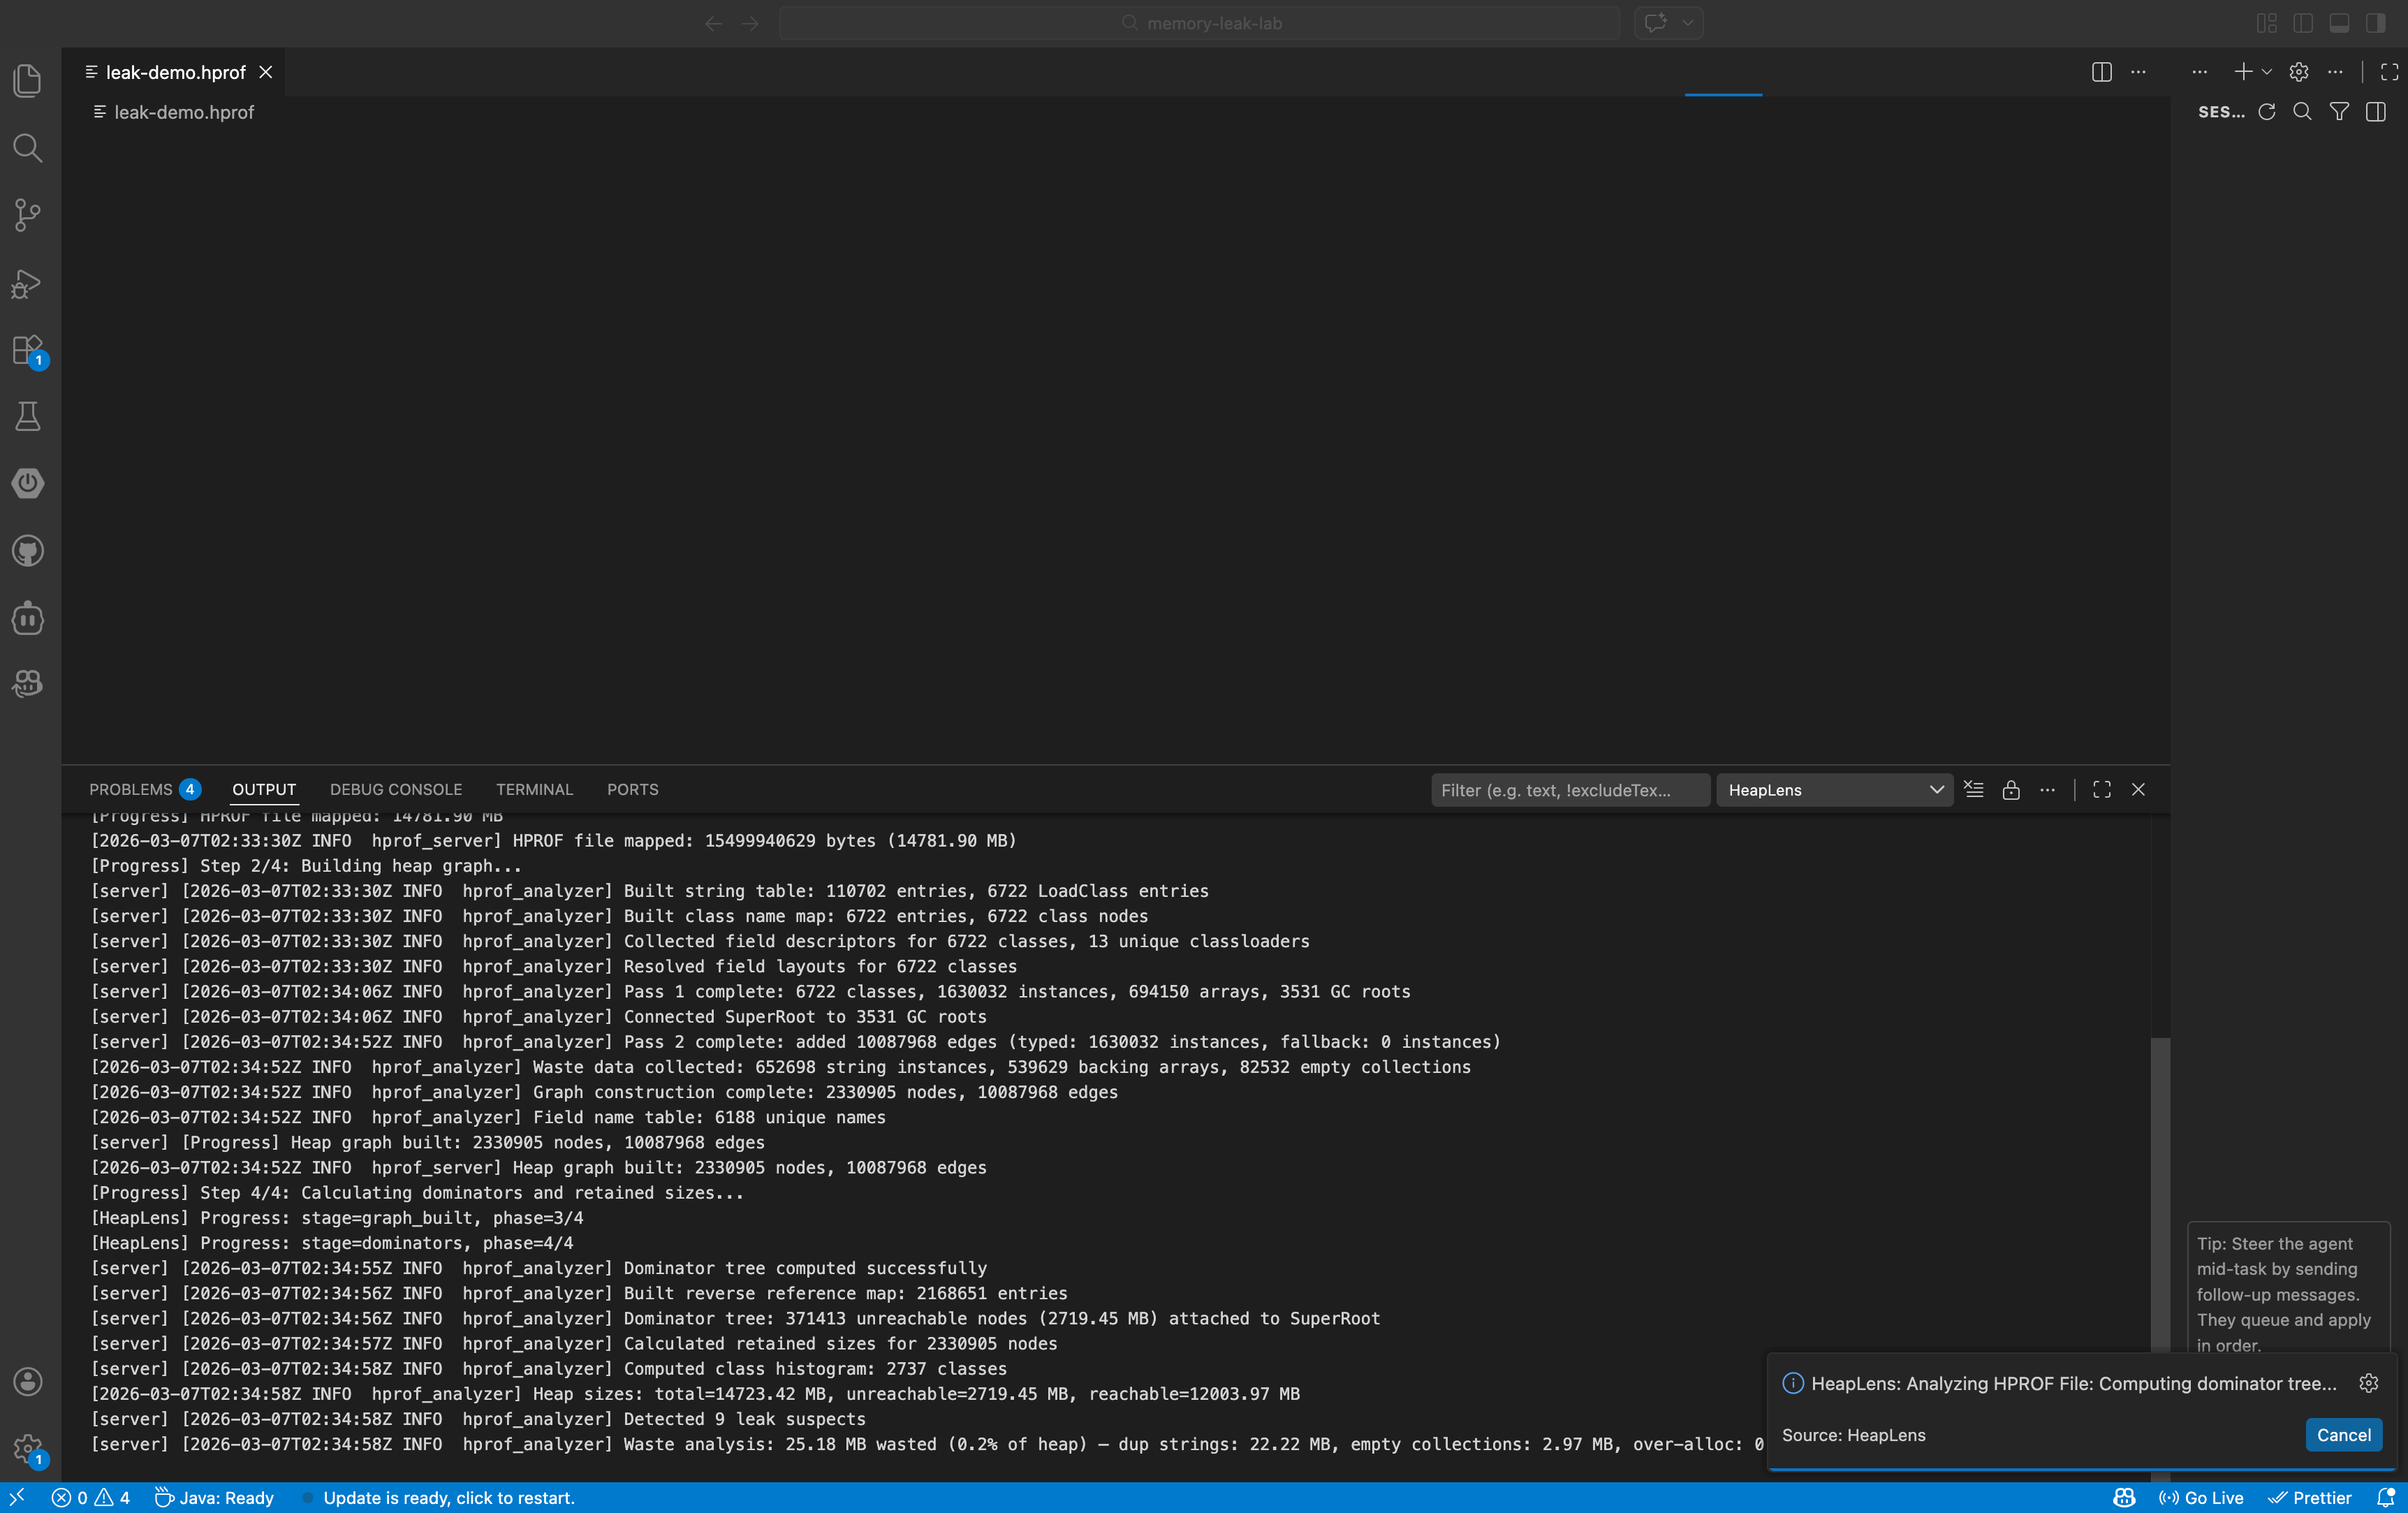
Built on a native Rust engine using zero-copy mmap parsing with a two-phase CSR architecture, HeapLens handles production-sized heap dumps with ease. A 2 GB heap dump analyzes in about 1 second; a 14 GB dump completes in under 11 seconds on an M1 Mac. HeapLens also introduces HeapQL, a SQL-like query language purpose-built for heap analysis — query any object, filter by retained size, join across tables, and export results, all without leaving your editor.
---
## Features
### 10 Interactive Tabs
| Tab | What it does |
|-----|-------------|
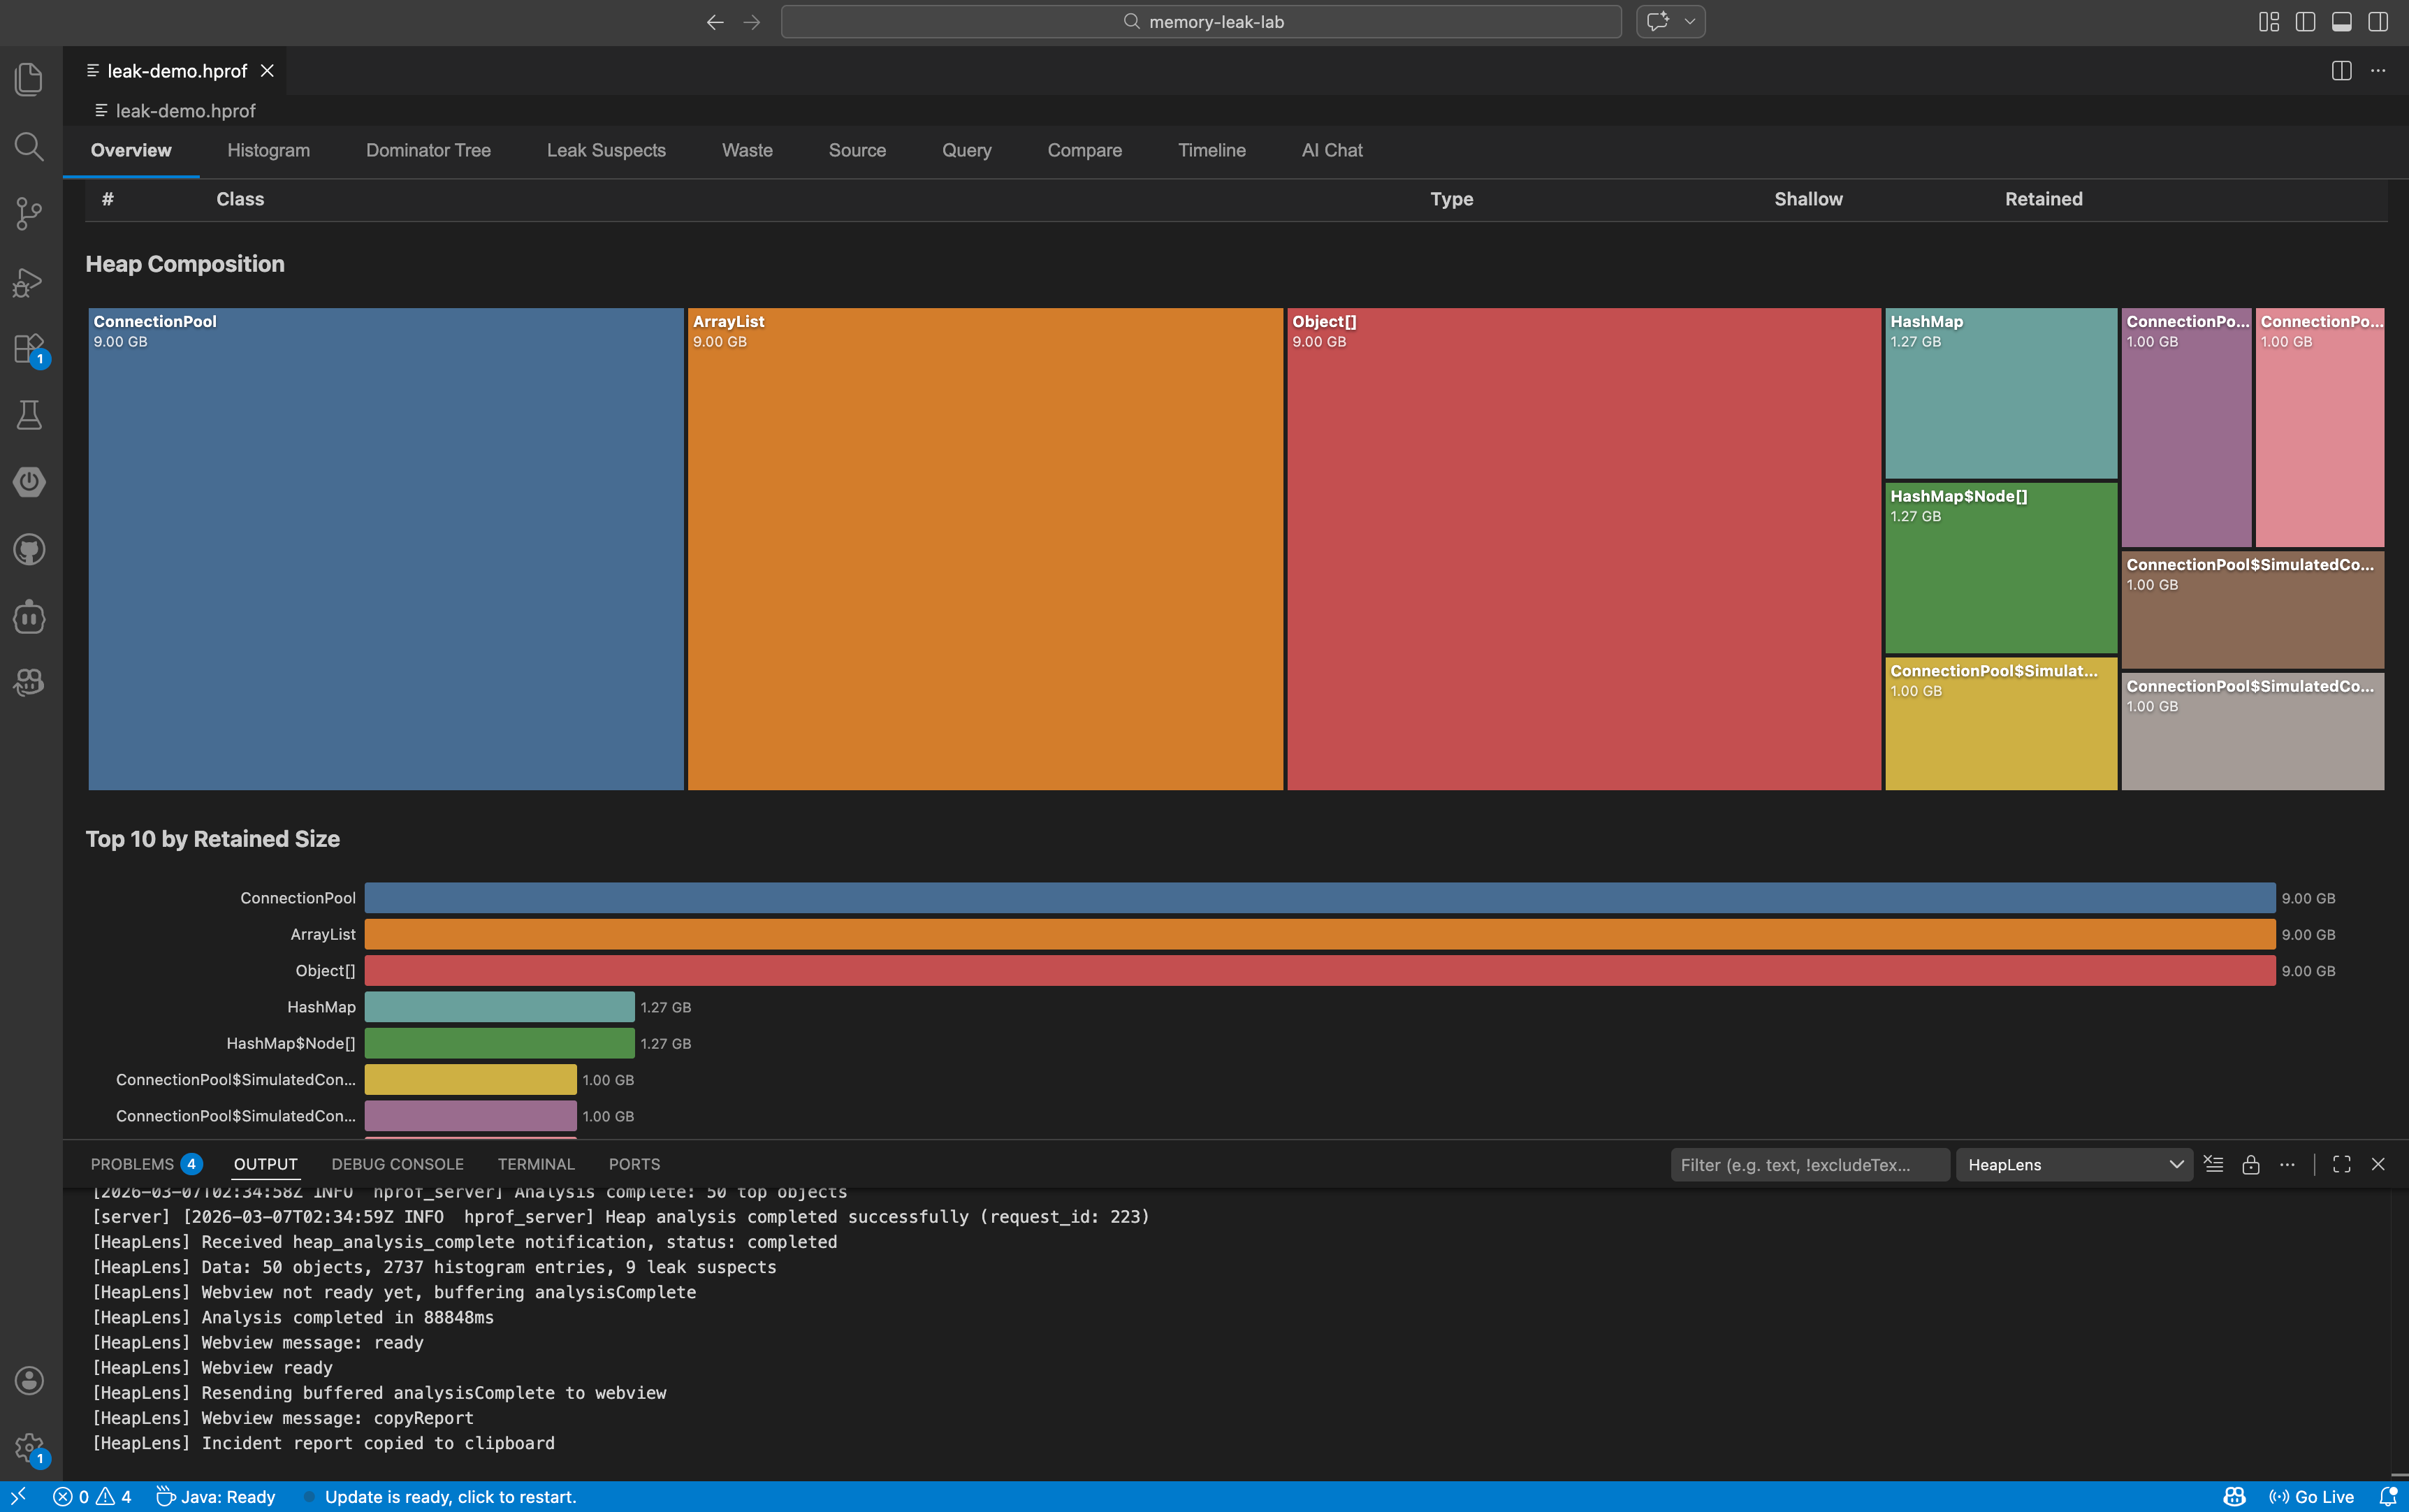
| **Overview** | Heap stats, top objects, D3.js pie & bar charts |
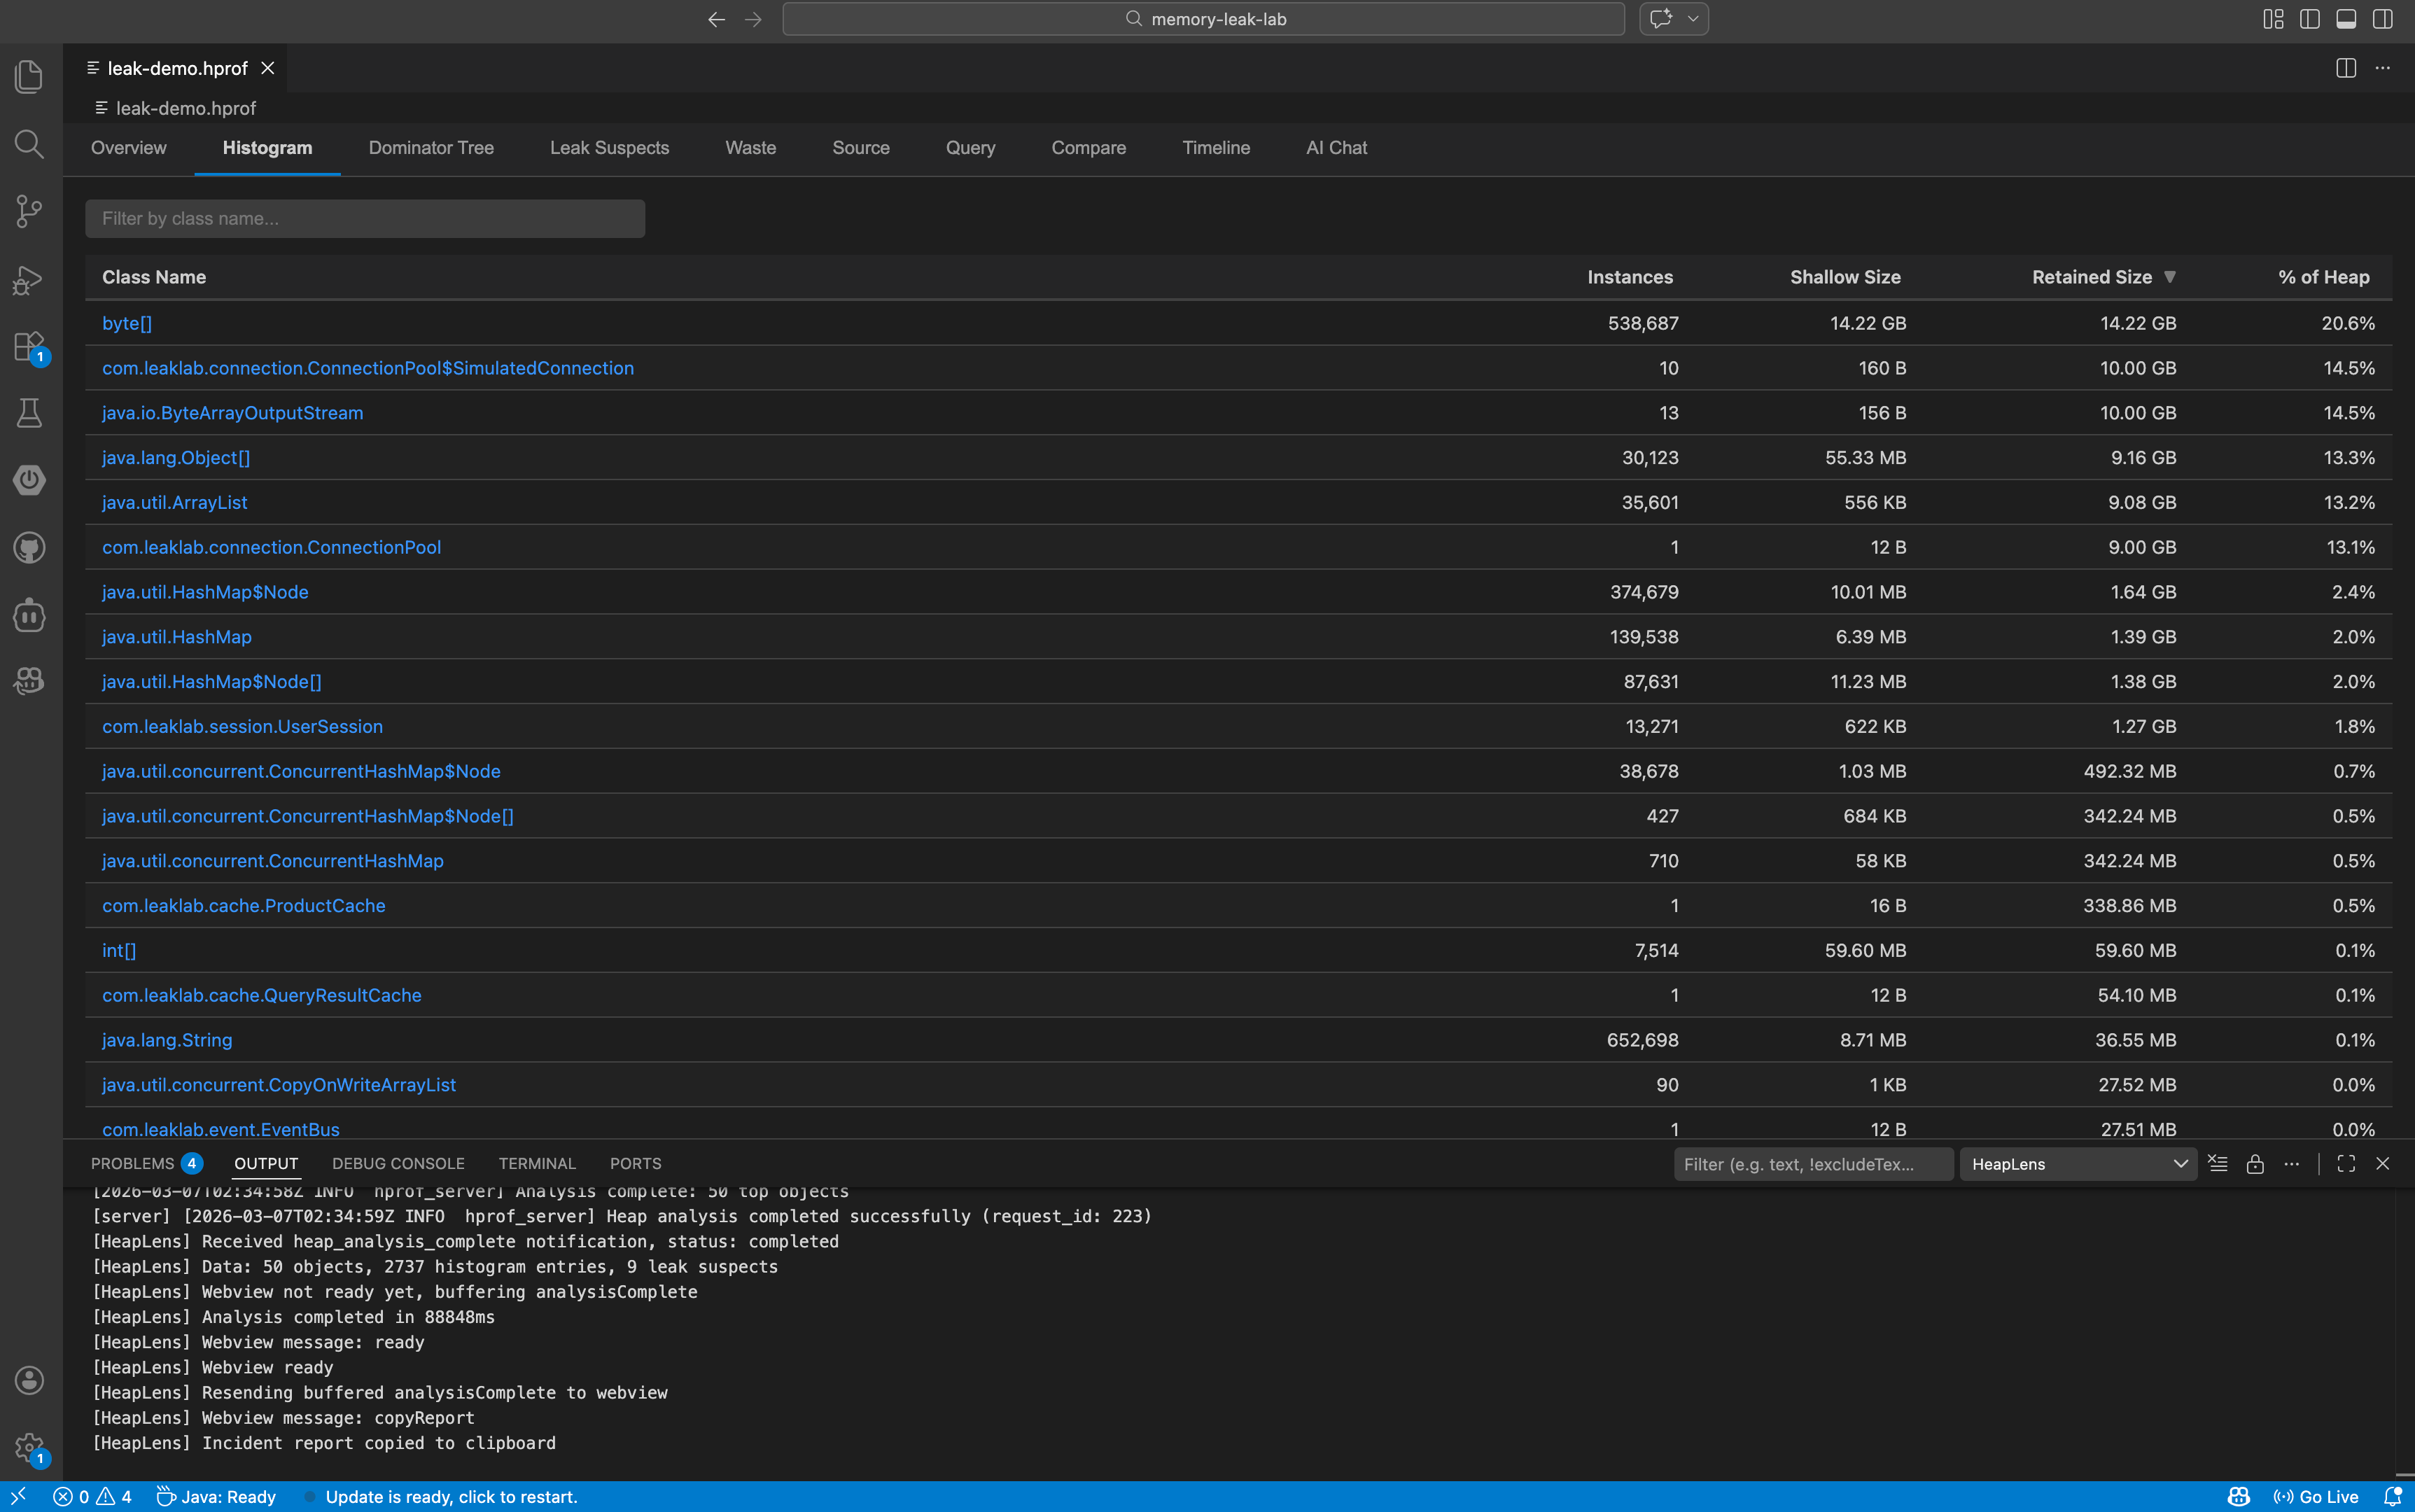
| **Histogram** | Sortable class table with instance counts and sizes — click a class to list all instances |
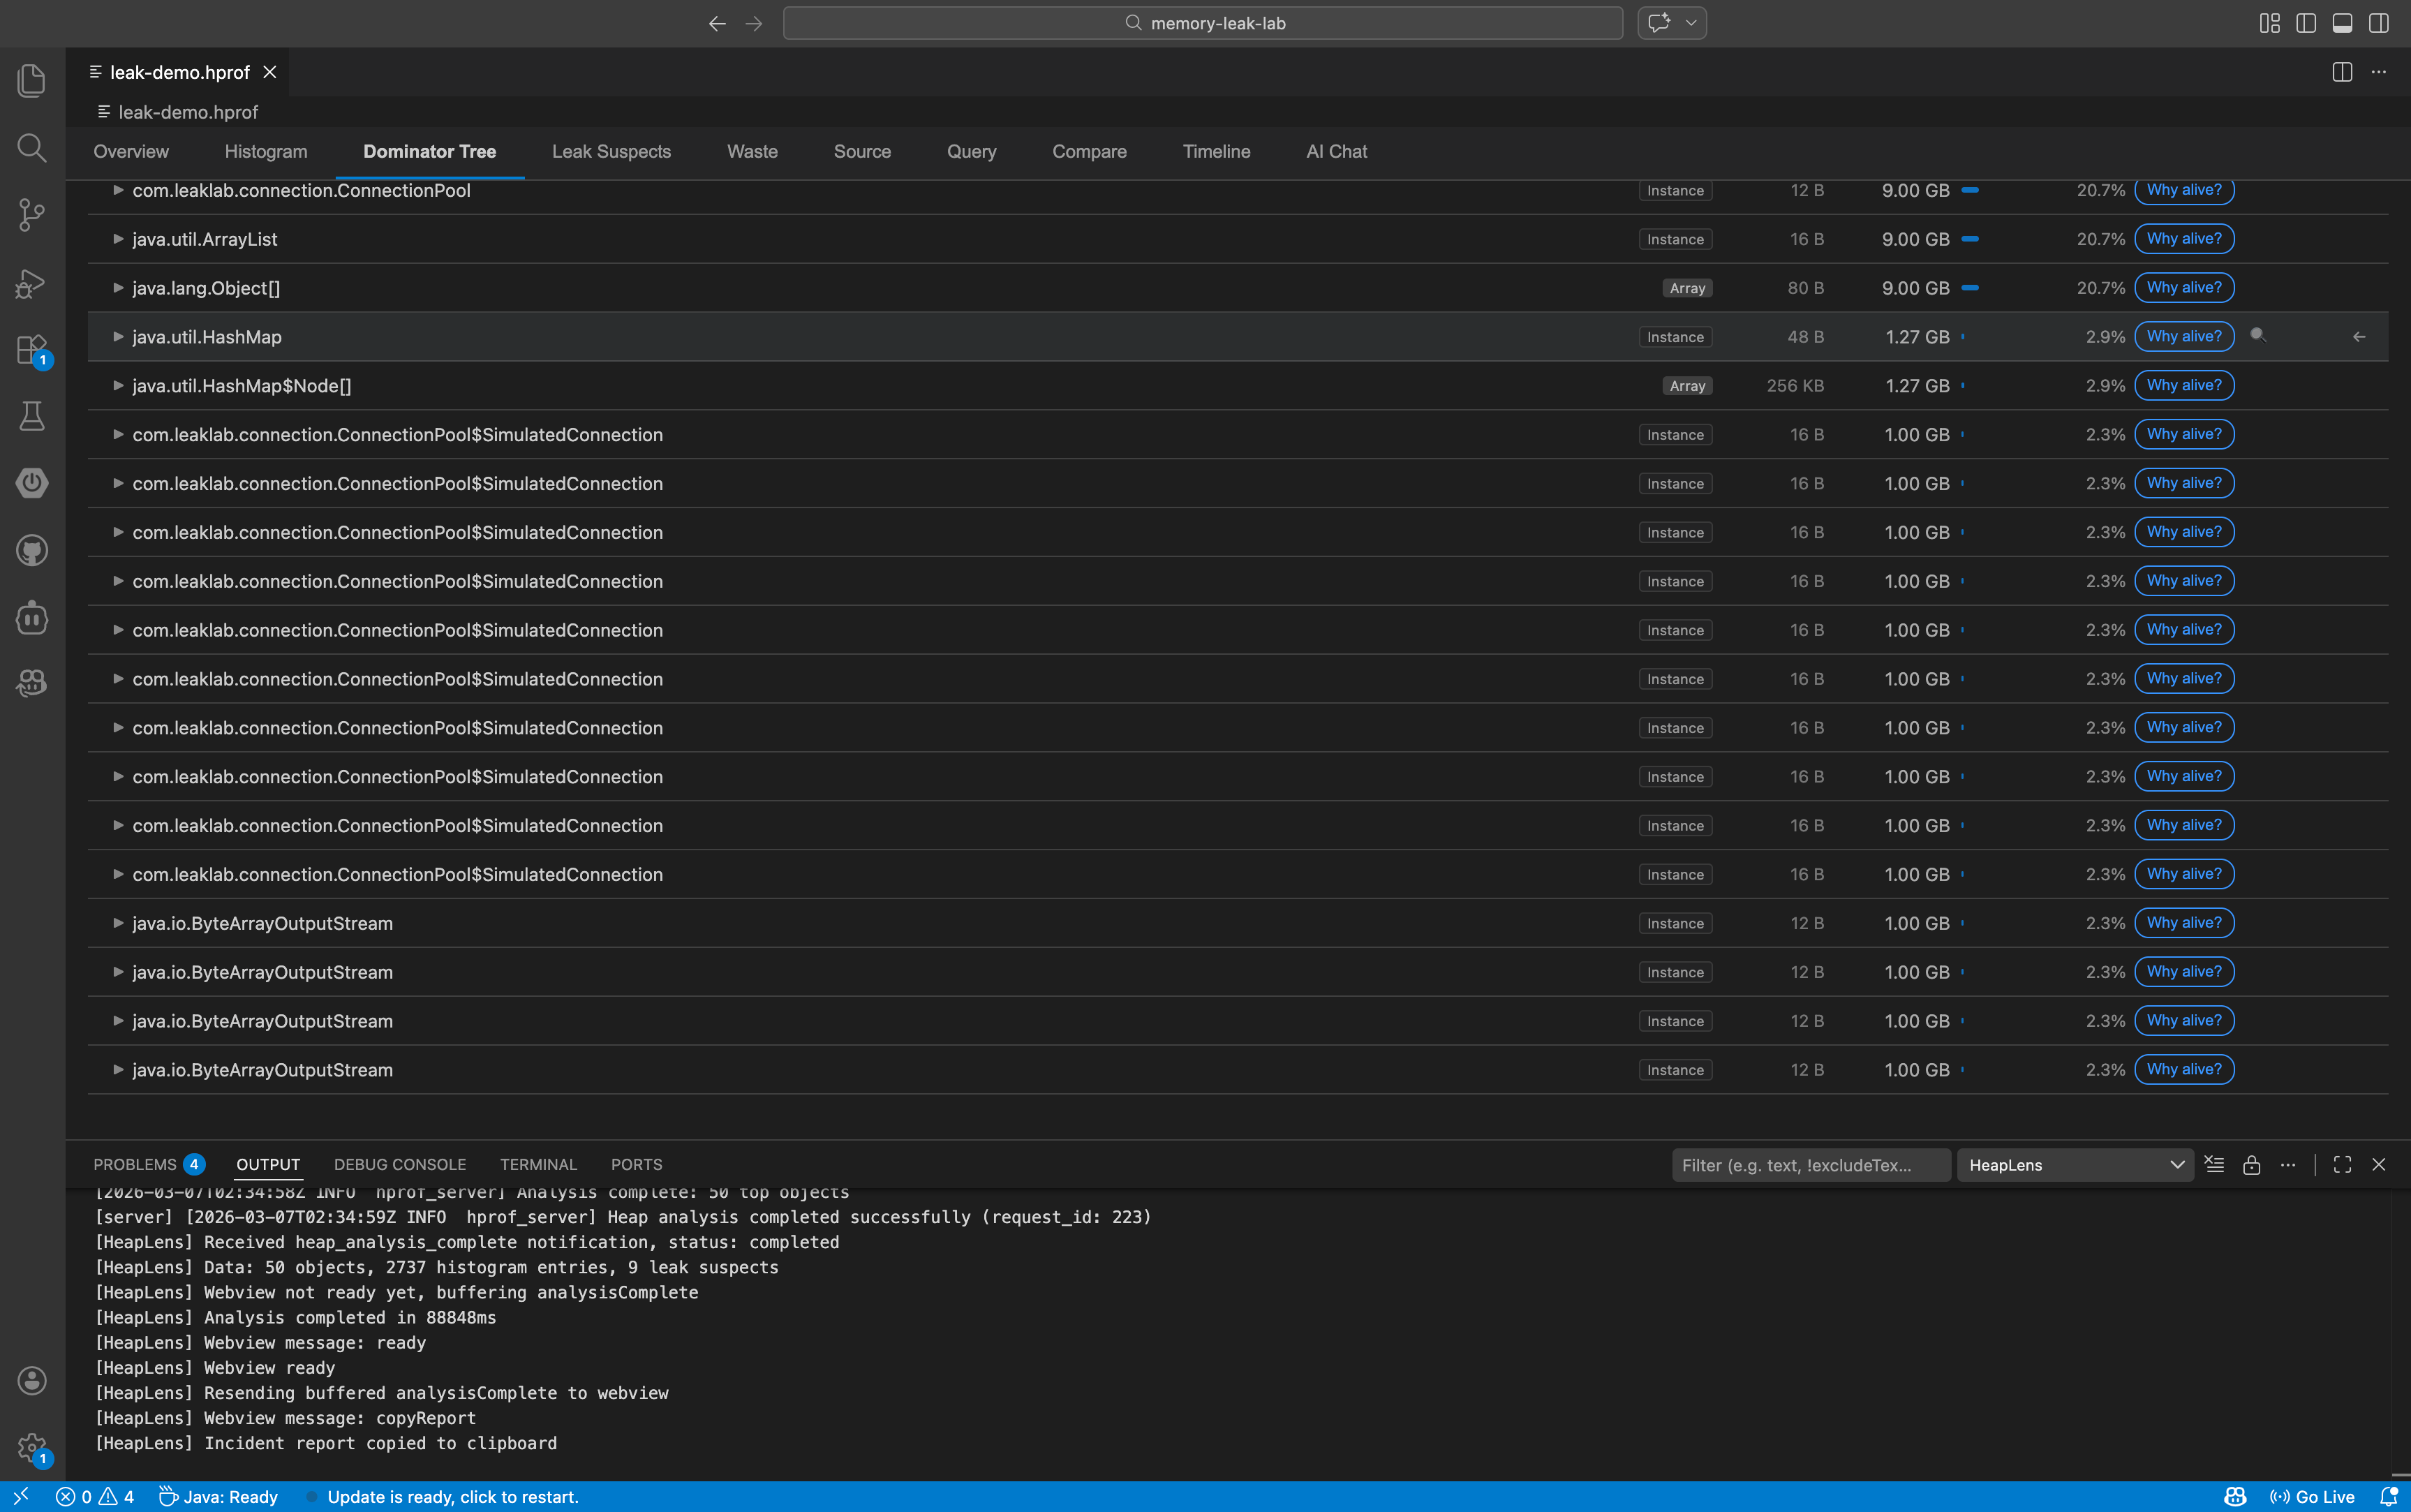
| **Dominator Tree** | Expandable lazy-loaded tree with retained size bars, field names, and action buttons |
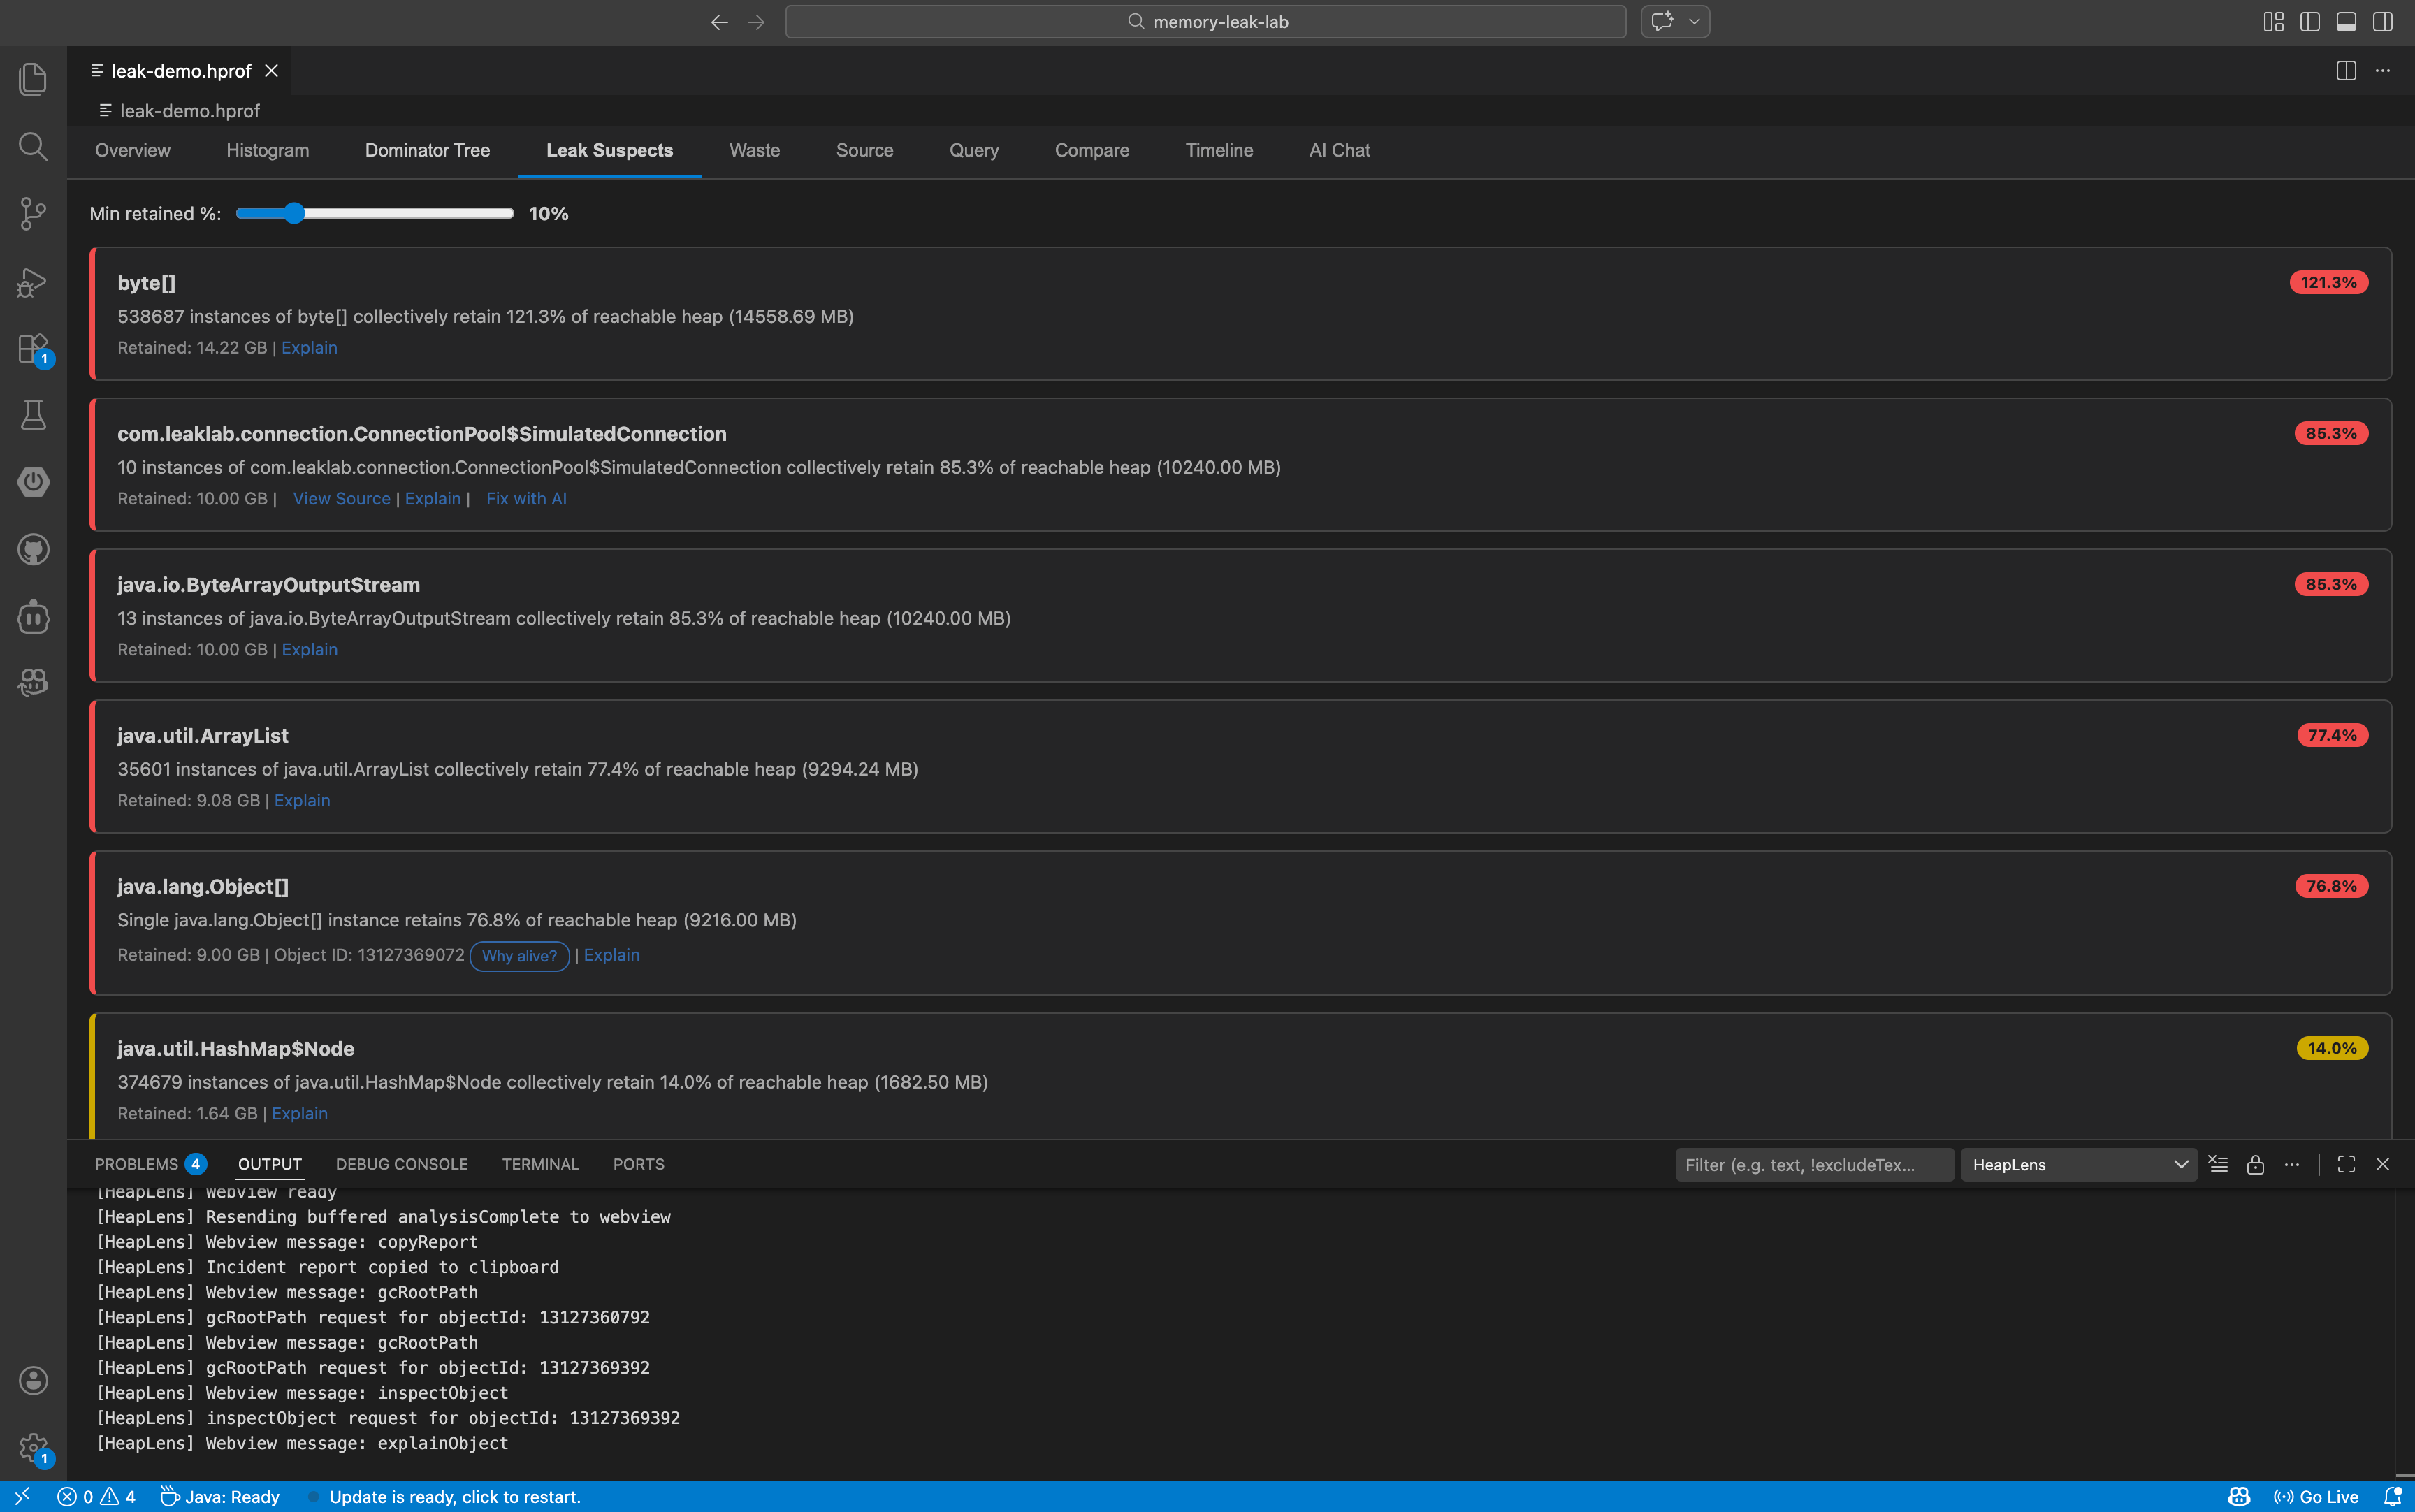
| **Leak Suspects** | Objects/classes retaining >10% of heap, with adjustable threshold slider |
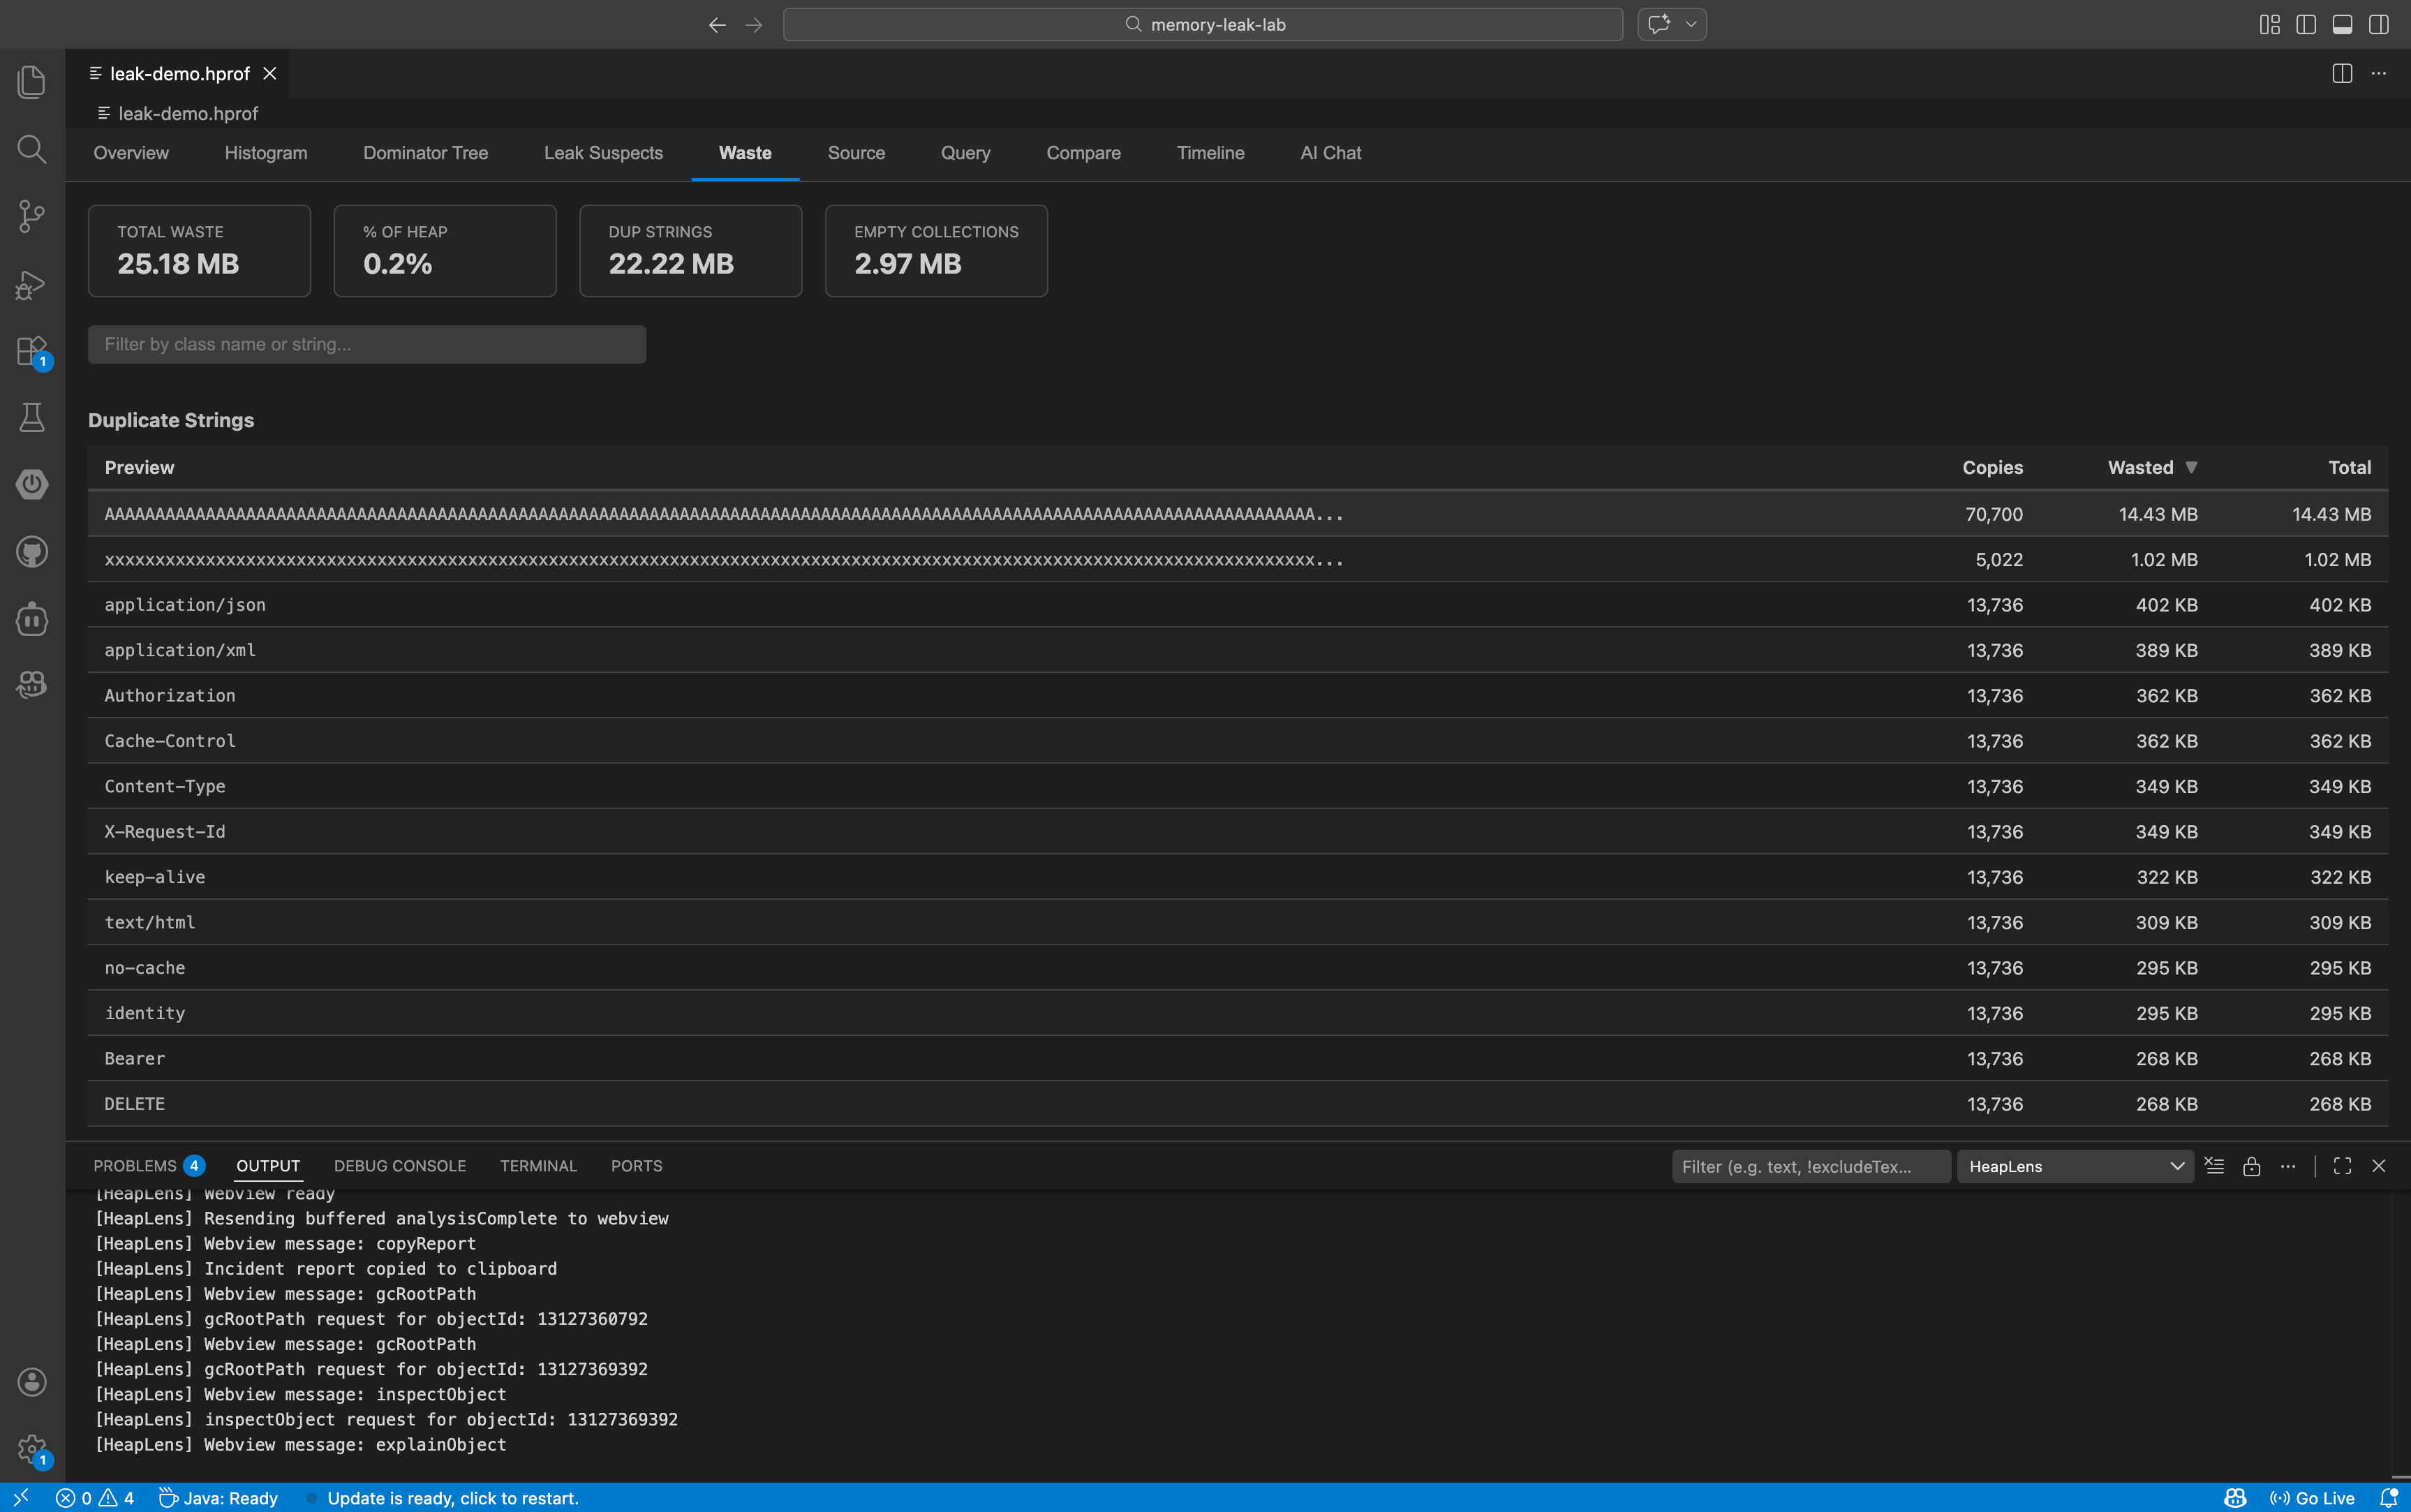
| **Waste** | Duplicate strings, empty collections, over-allocated arrays, boxed primitives |
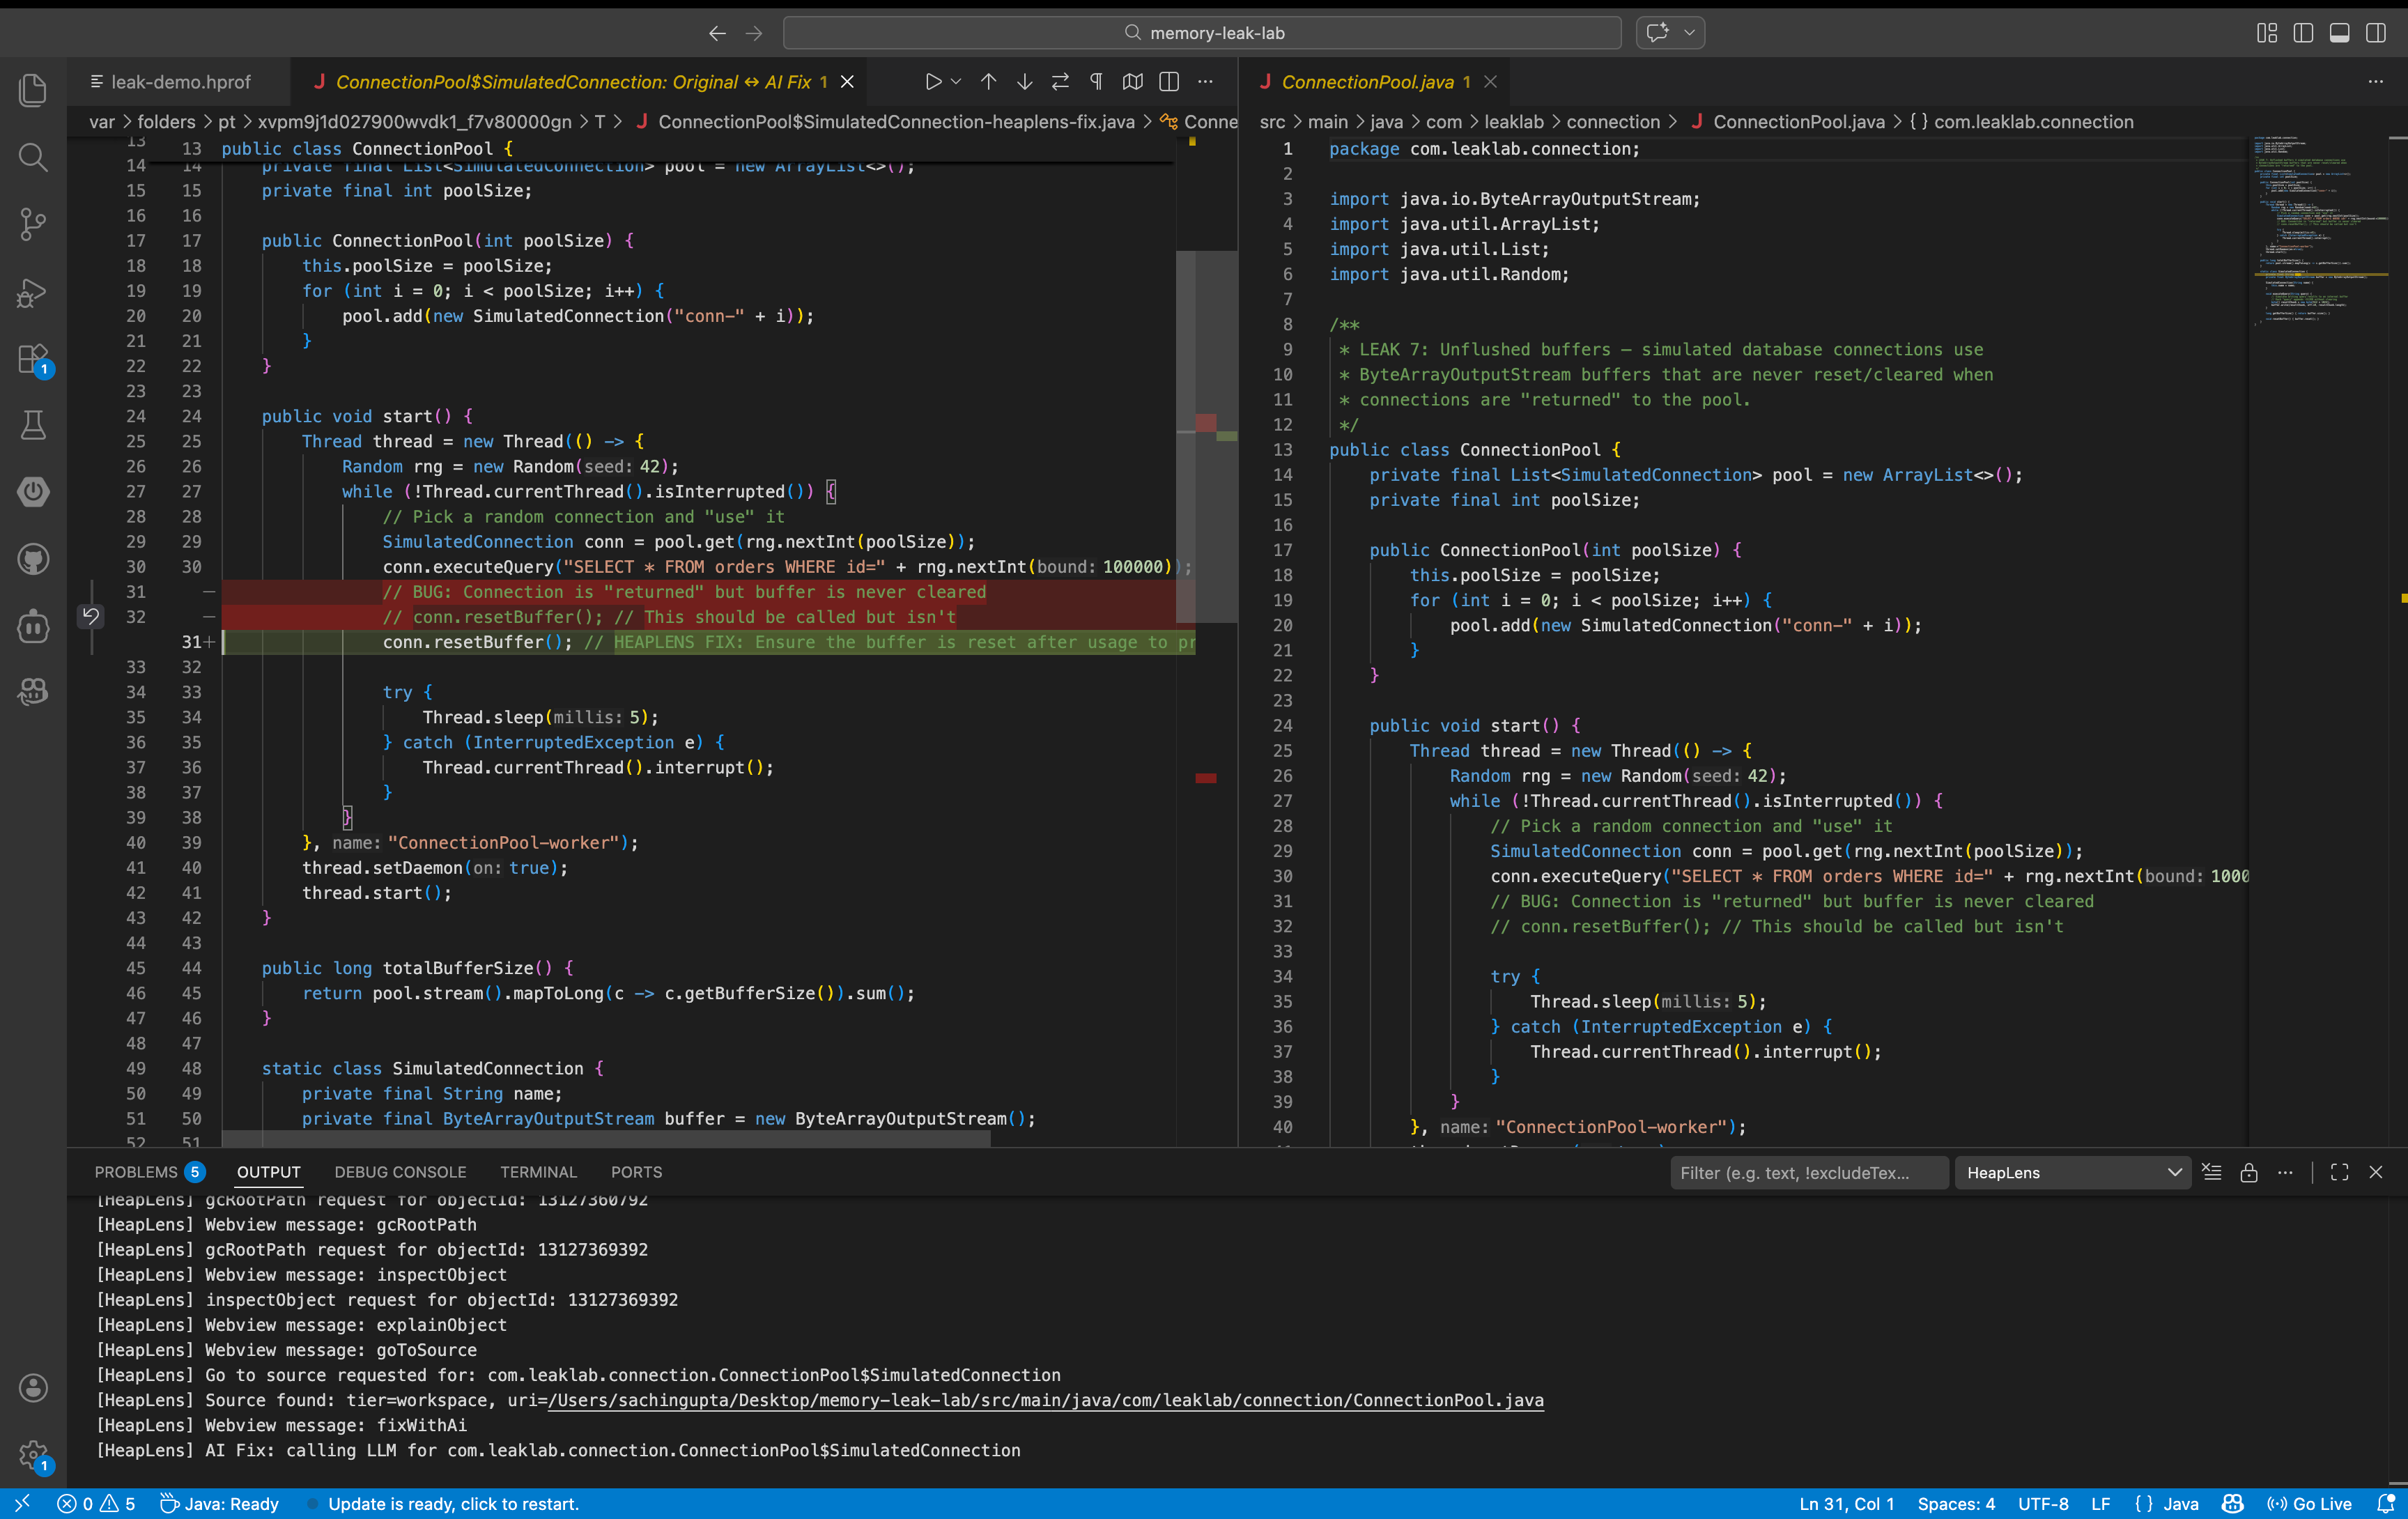
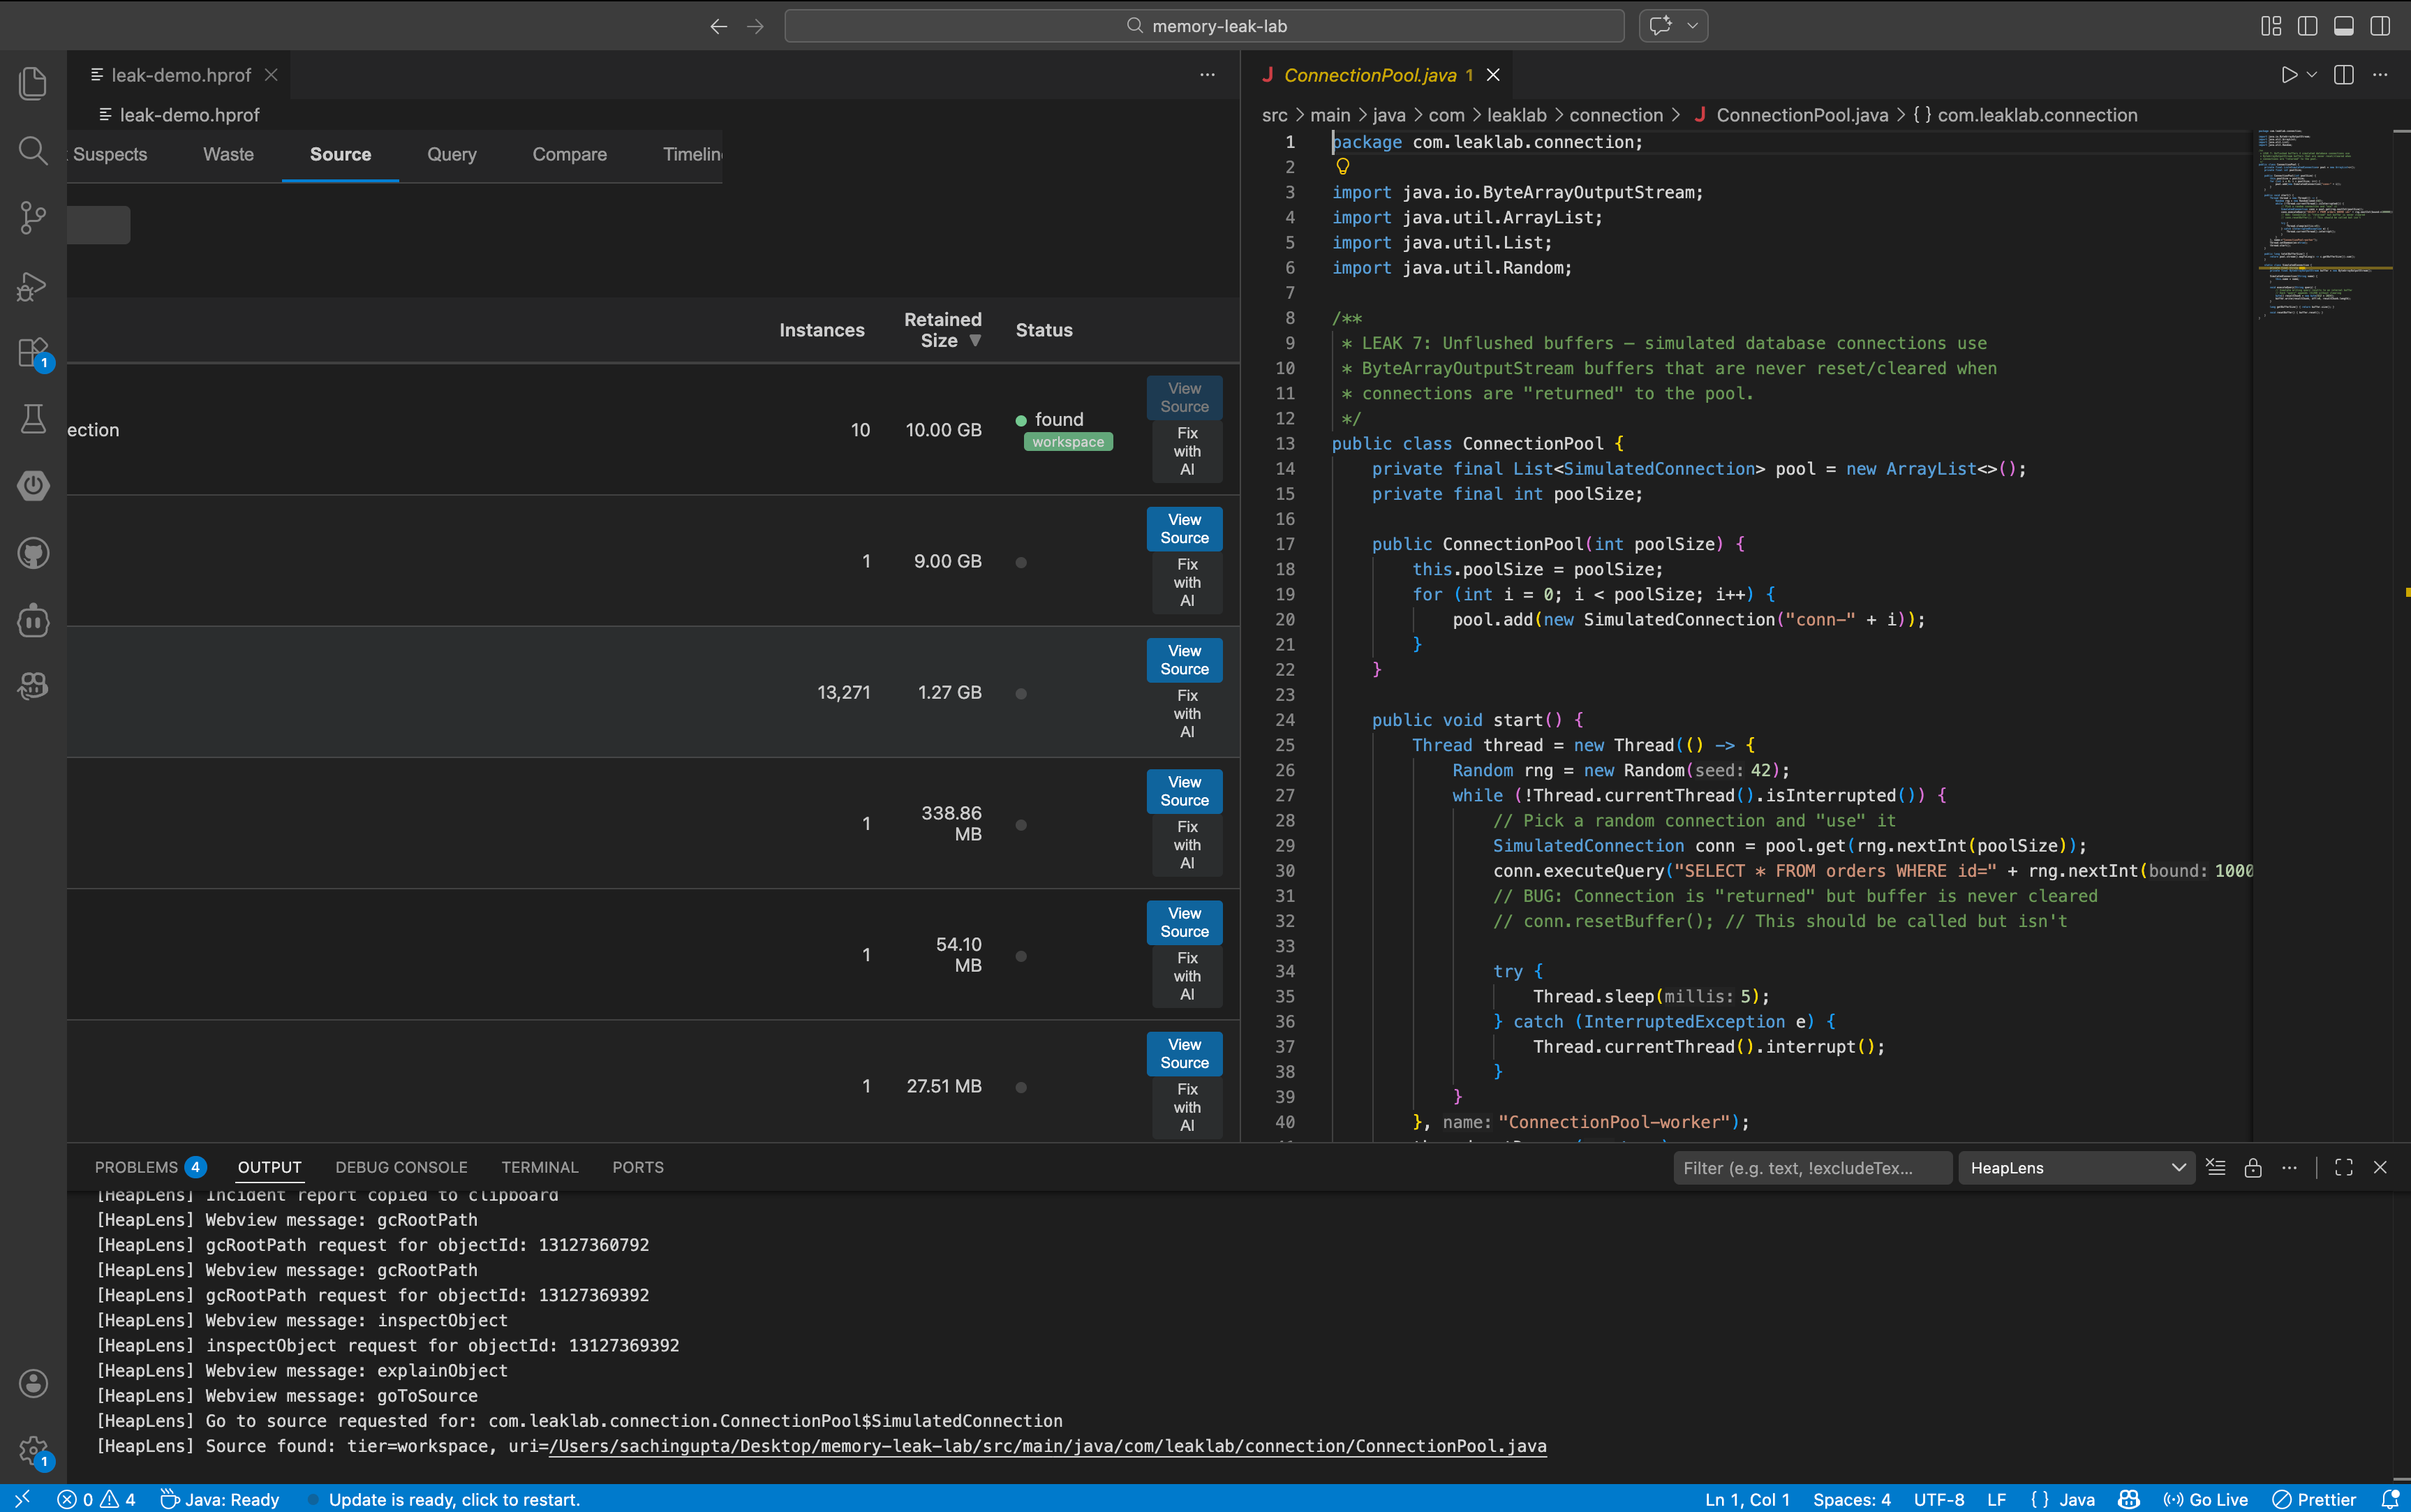
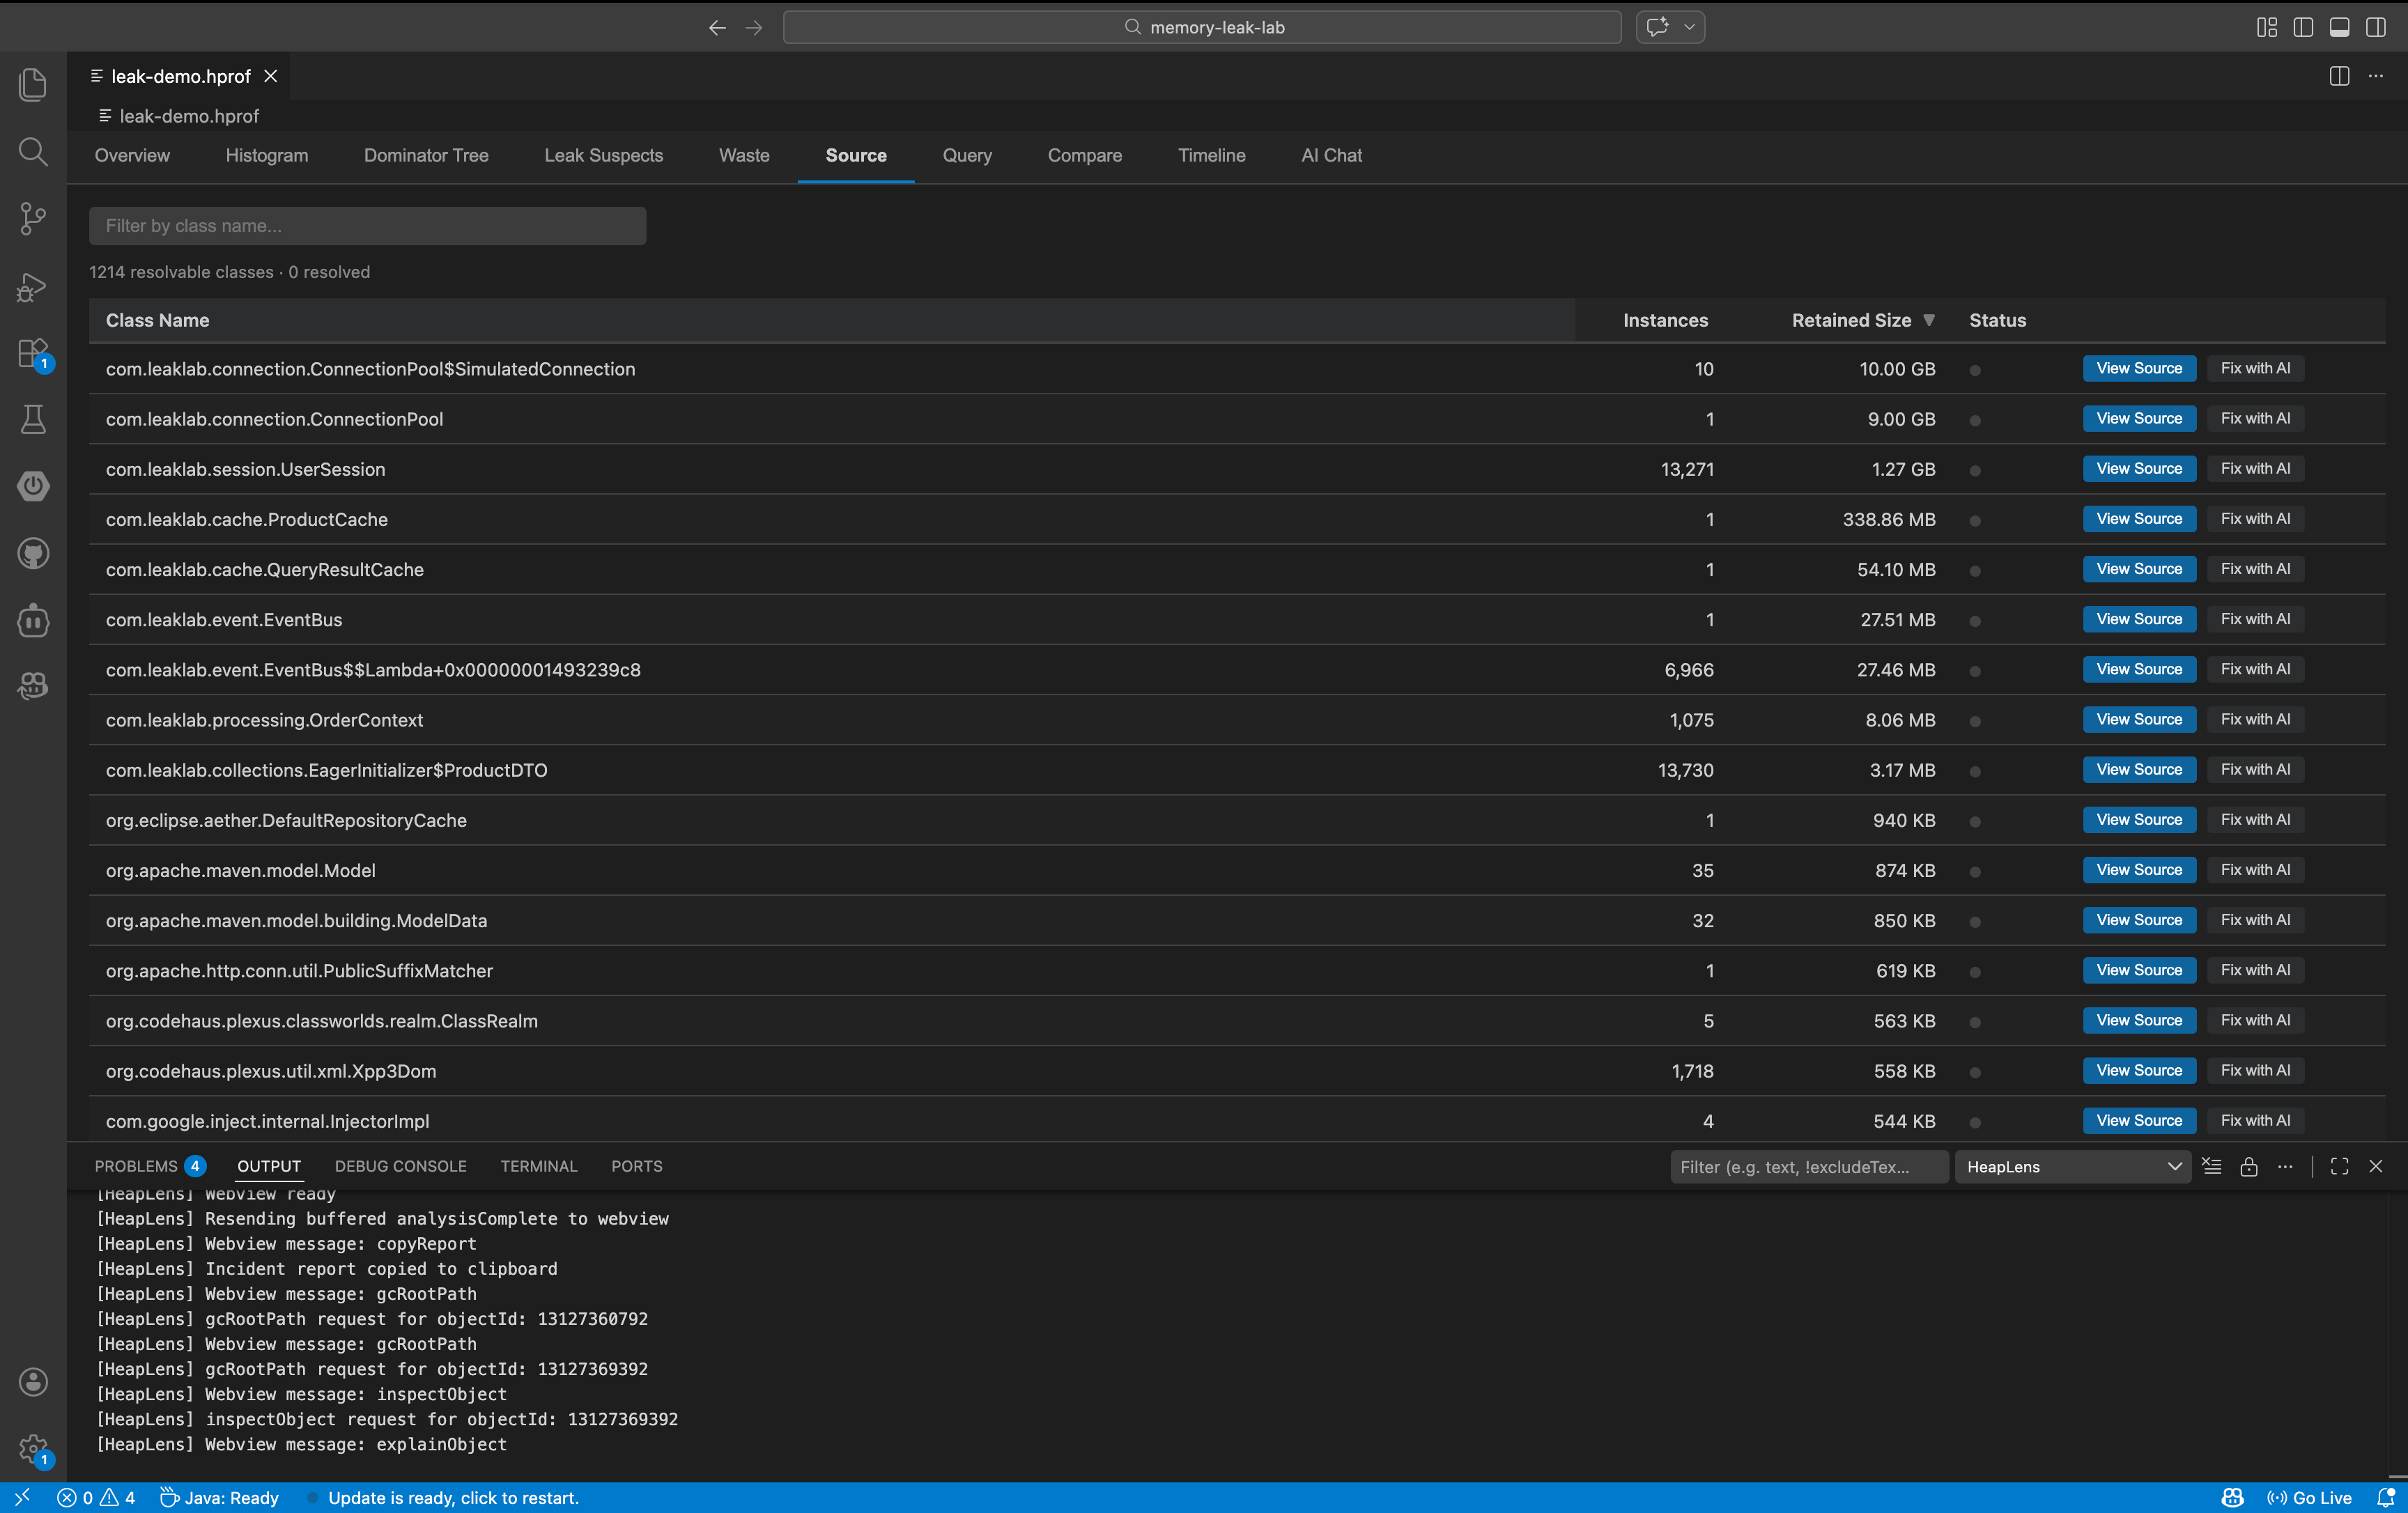
| **Source** | Jump to Java source — workspace files, Maven/Gradle dependency JARs, or CFR decompilation |
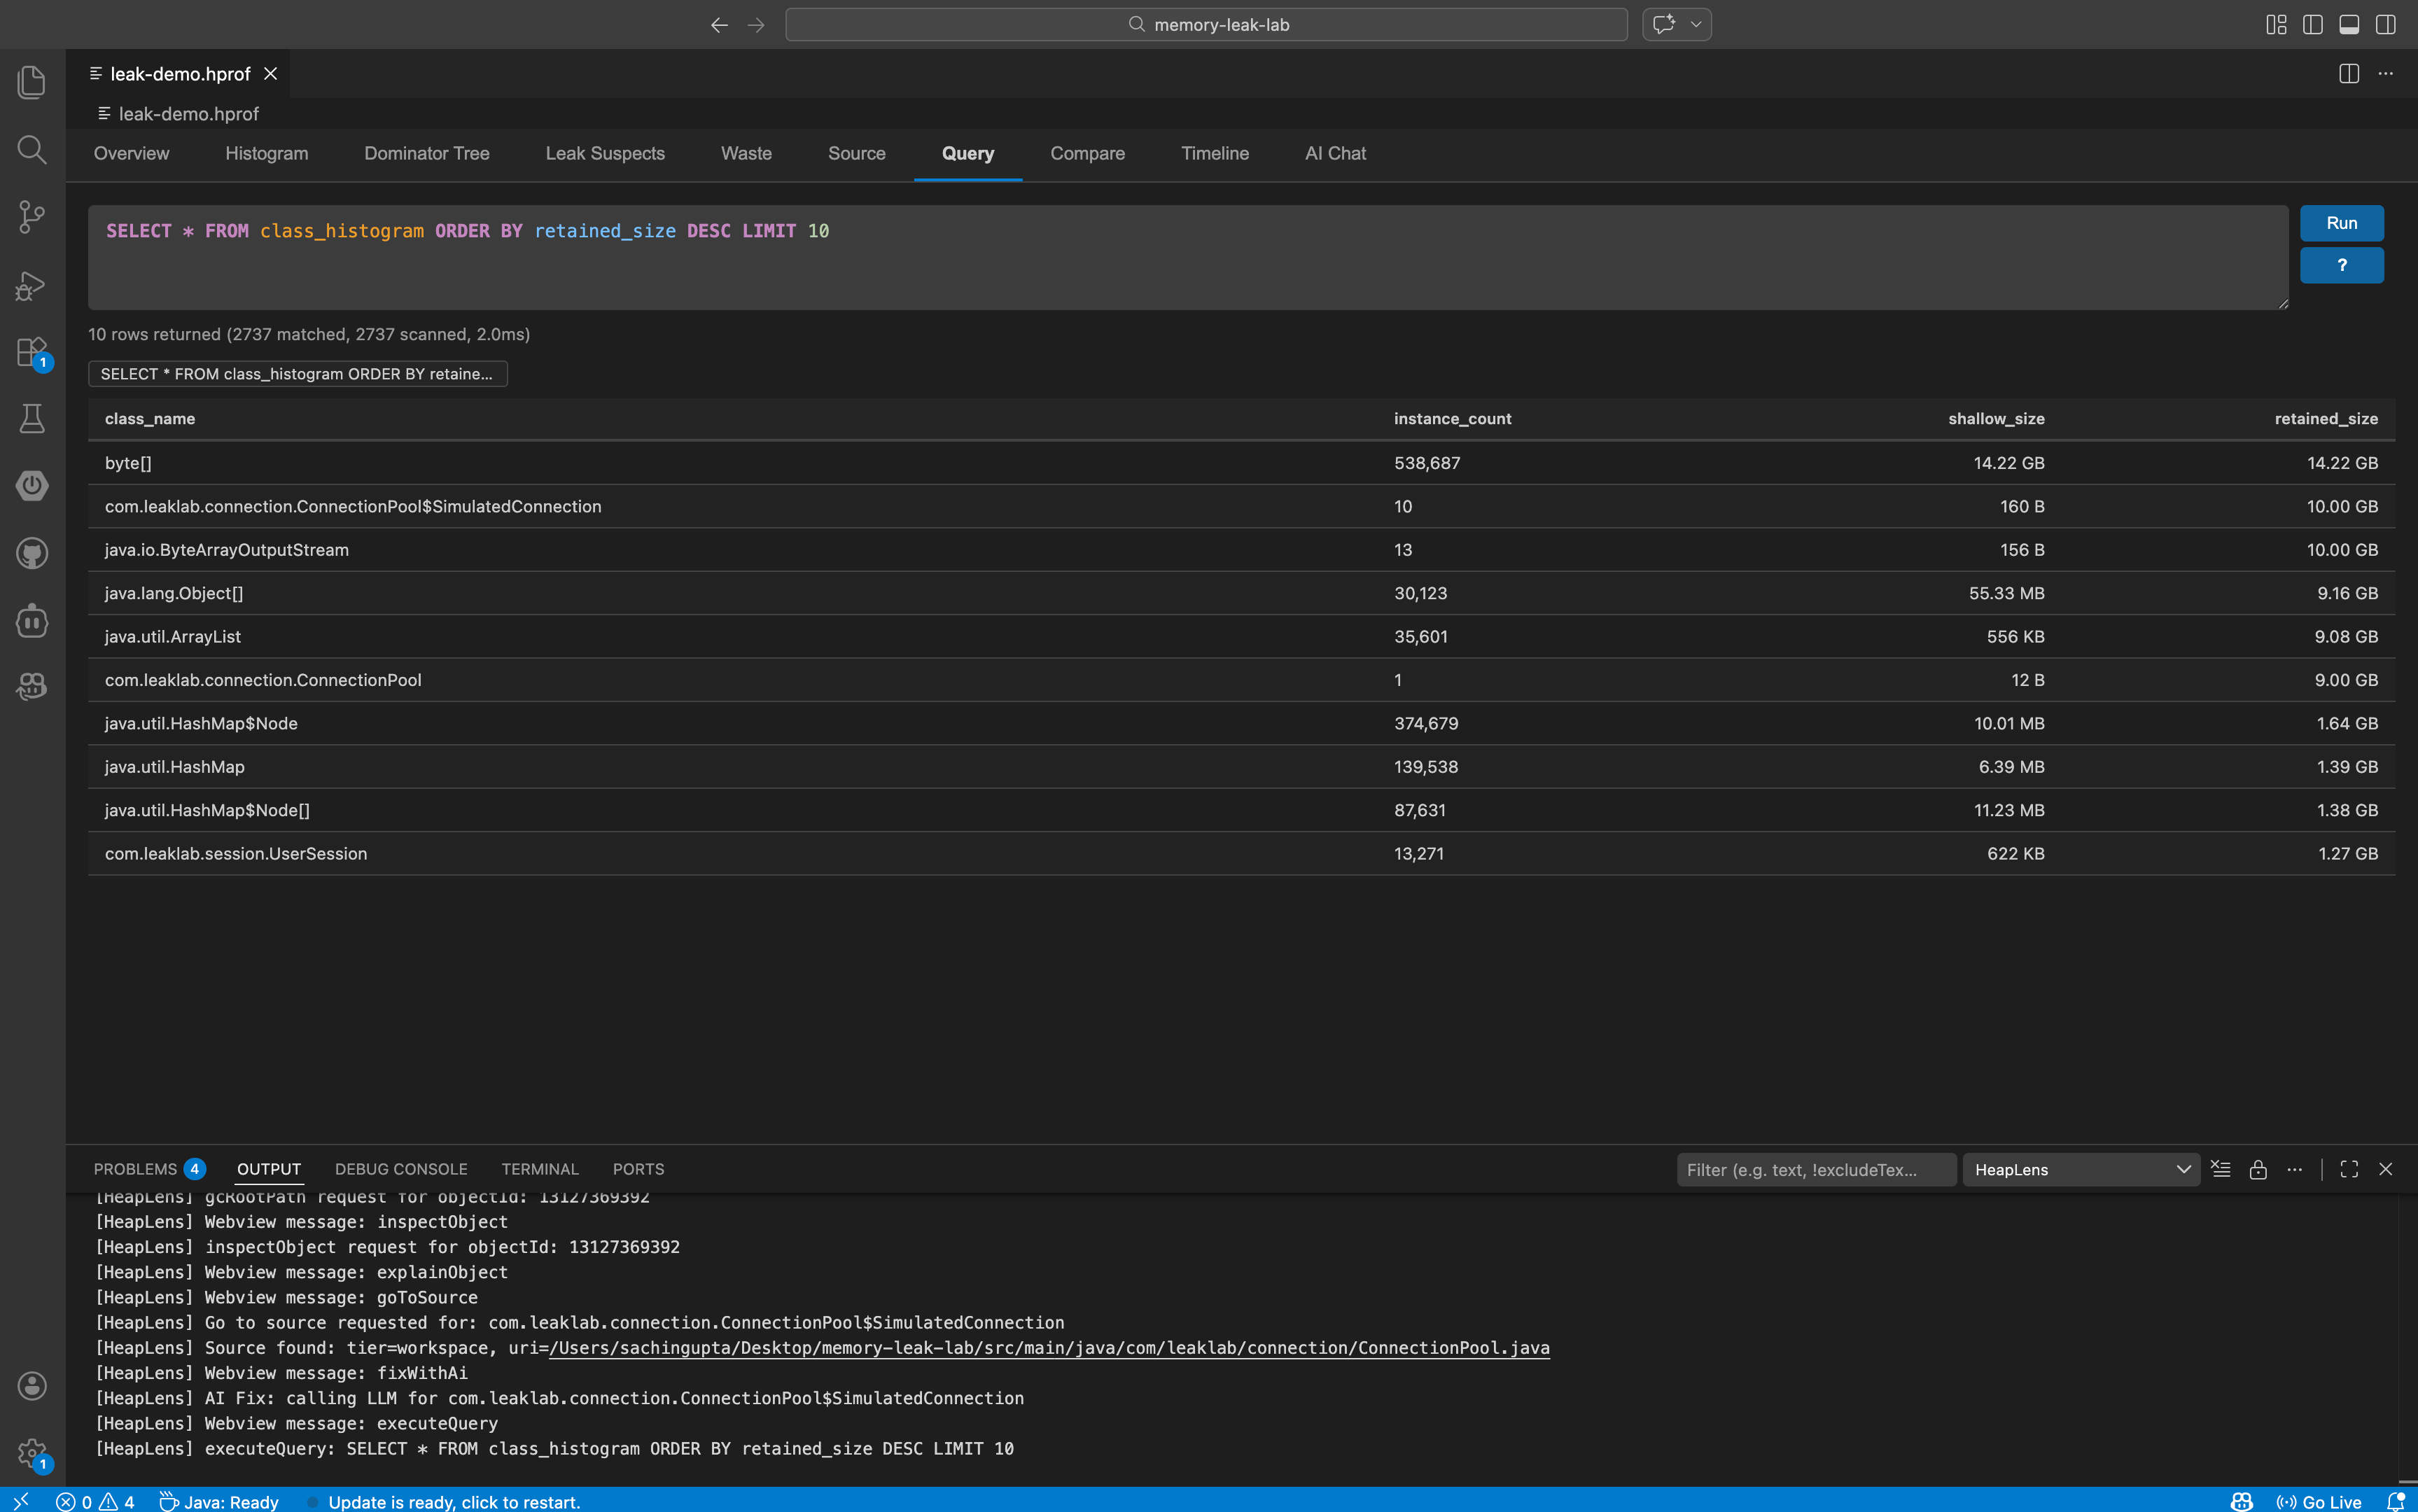
| **Query** | HeapQL: SQL-like queries with autocomplete, syntax highlighting, and query history |
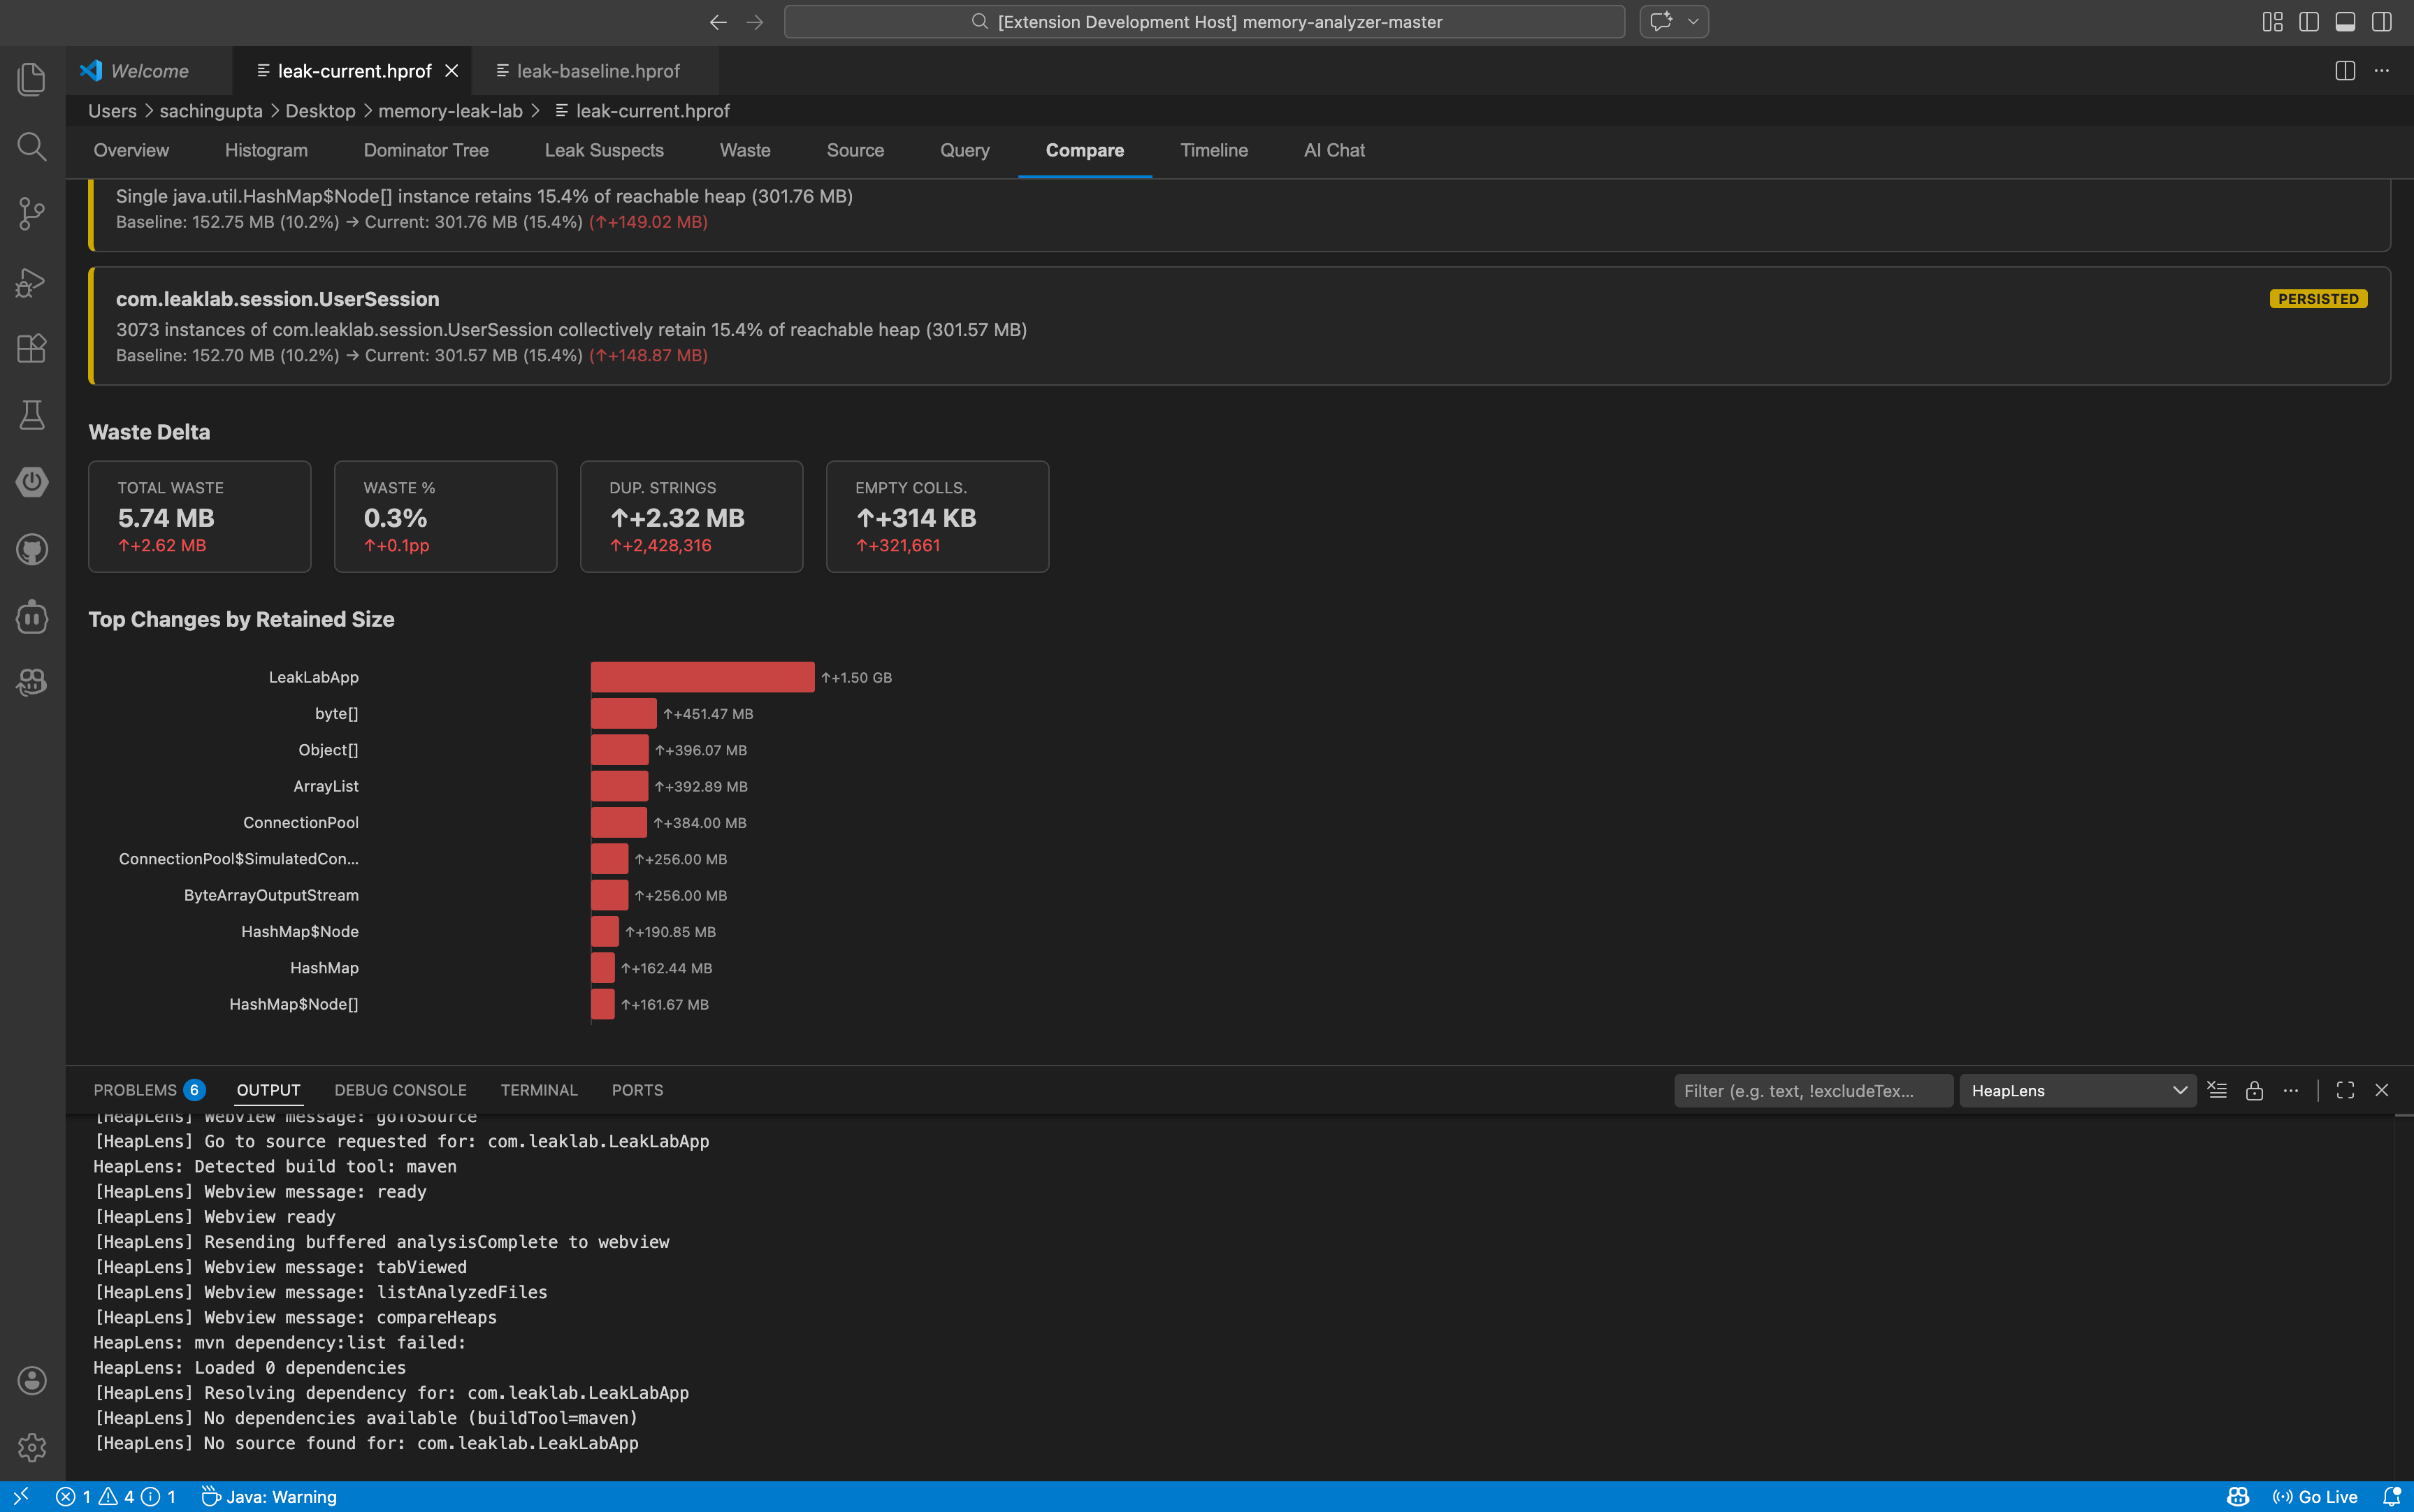
| **Compare** | Diff two heap dumps — class deltas, leak changes, waste delta, export as markdown or CSV |
| **Timeline** | Multi-snapshot trend analysis with D3.js line charts |
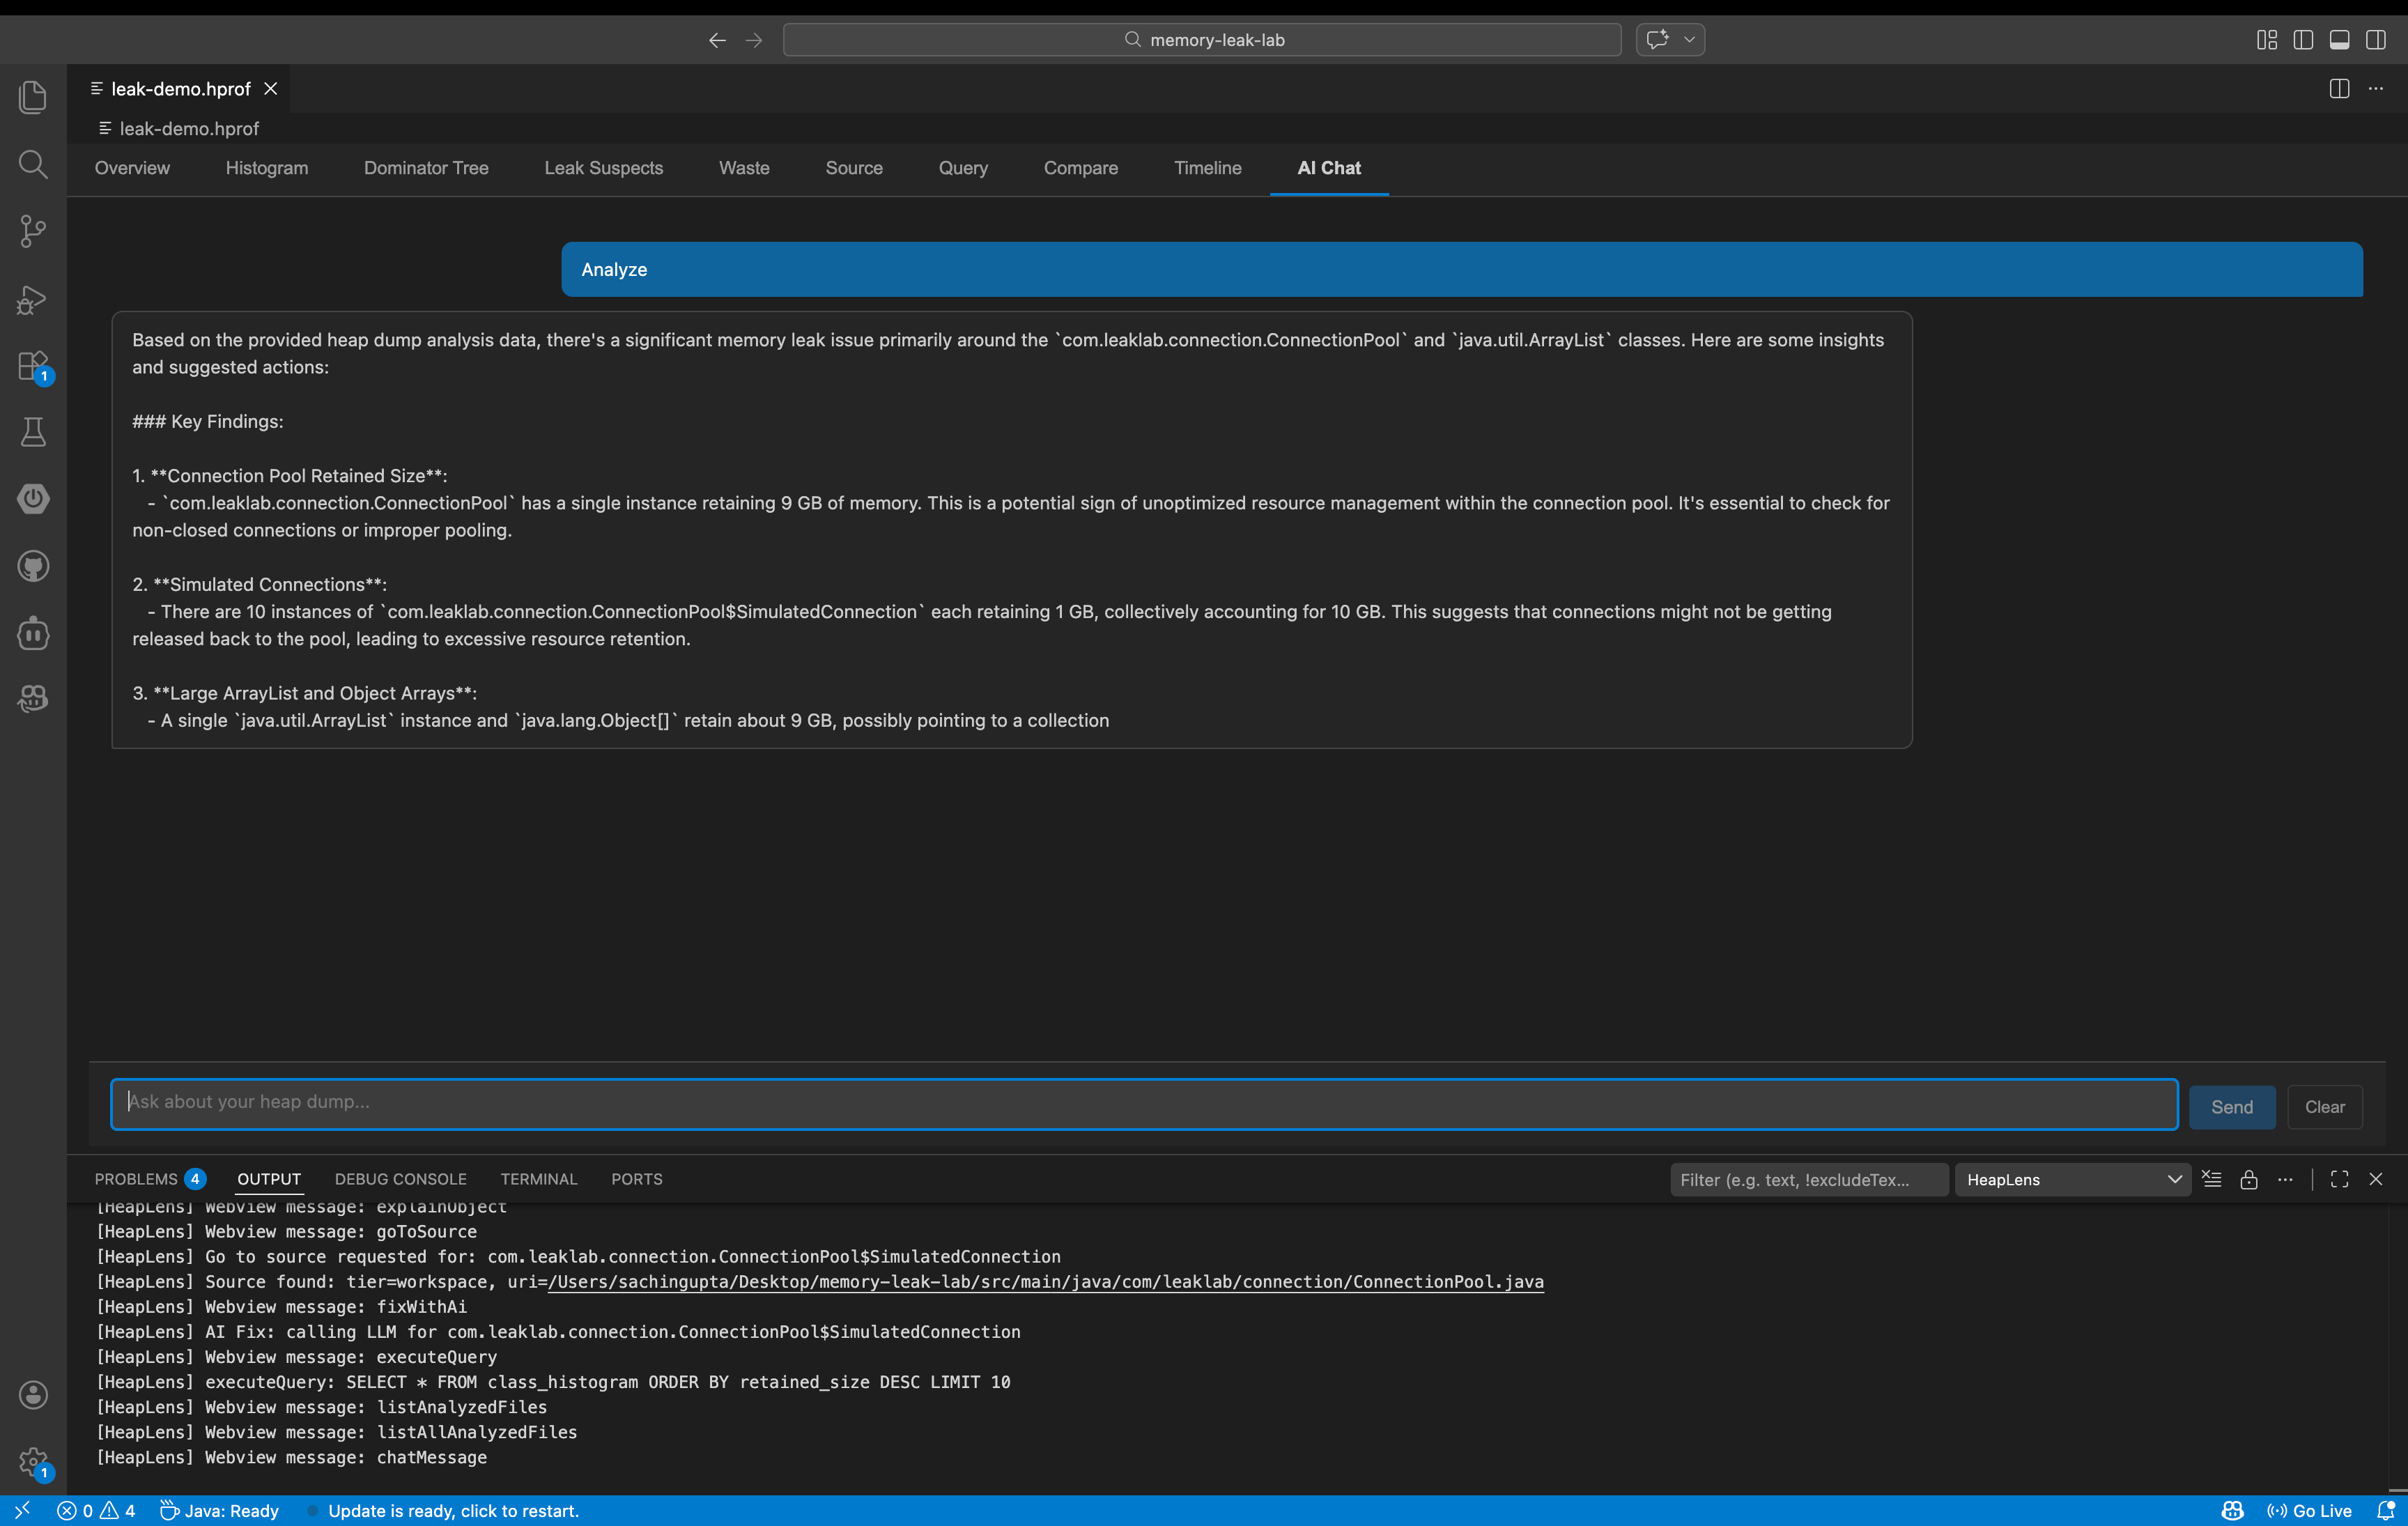
| **AI Chat** | Ask questions in English — get HeapQL queries and insights |
### Dominator Tree Actions
Every node in the dominator tree has one-click actions:
- **Why alive?** — shows the shortest GC root path as a breadcrumb
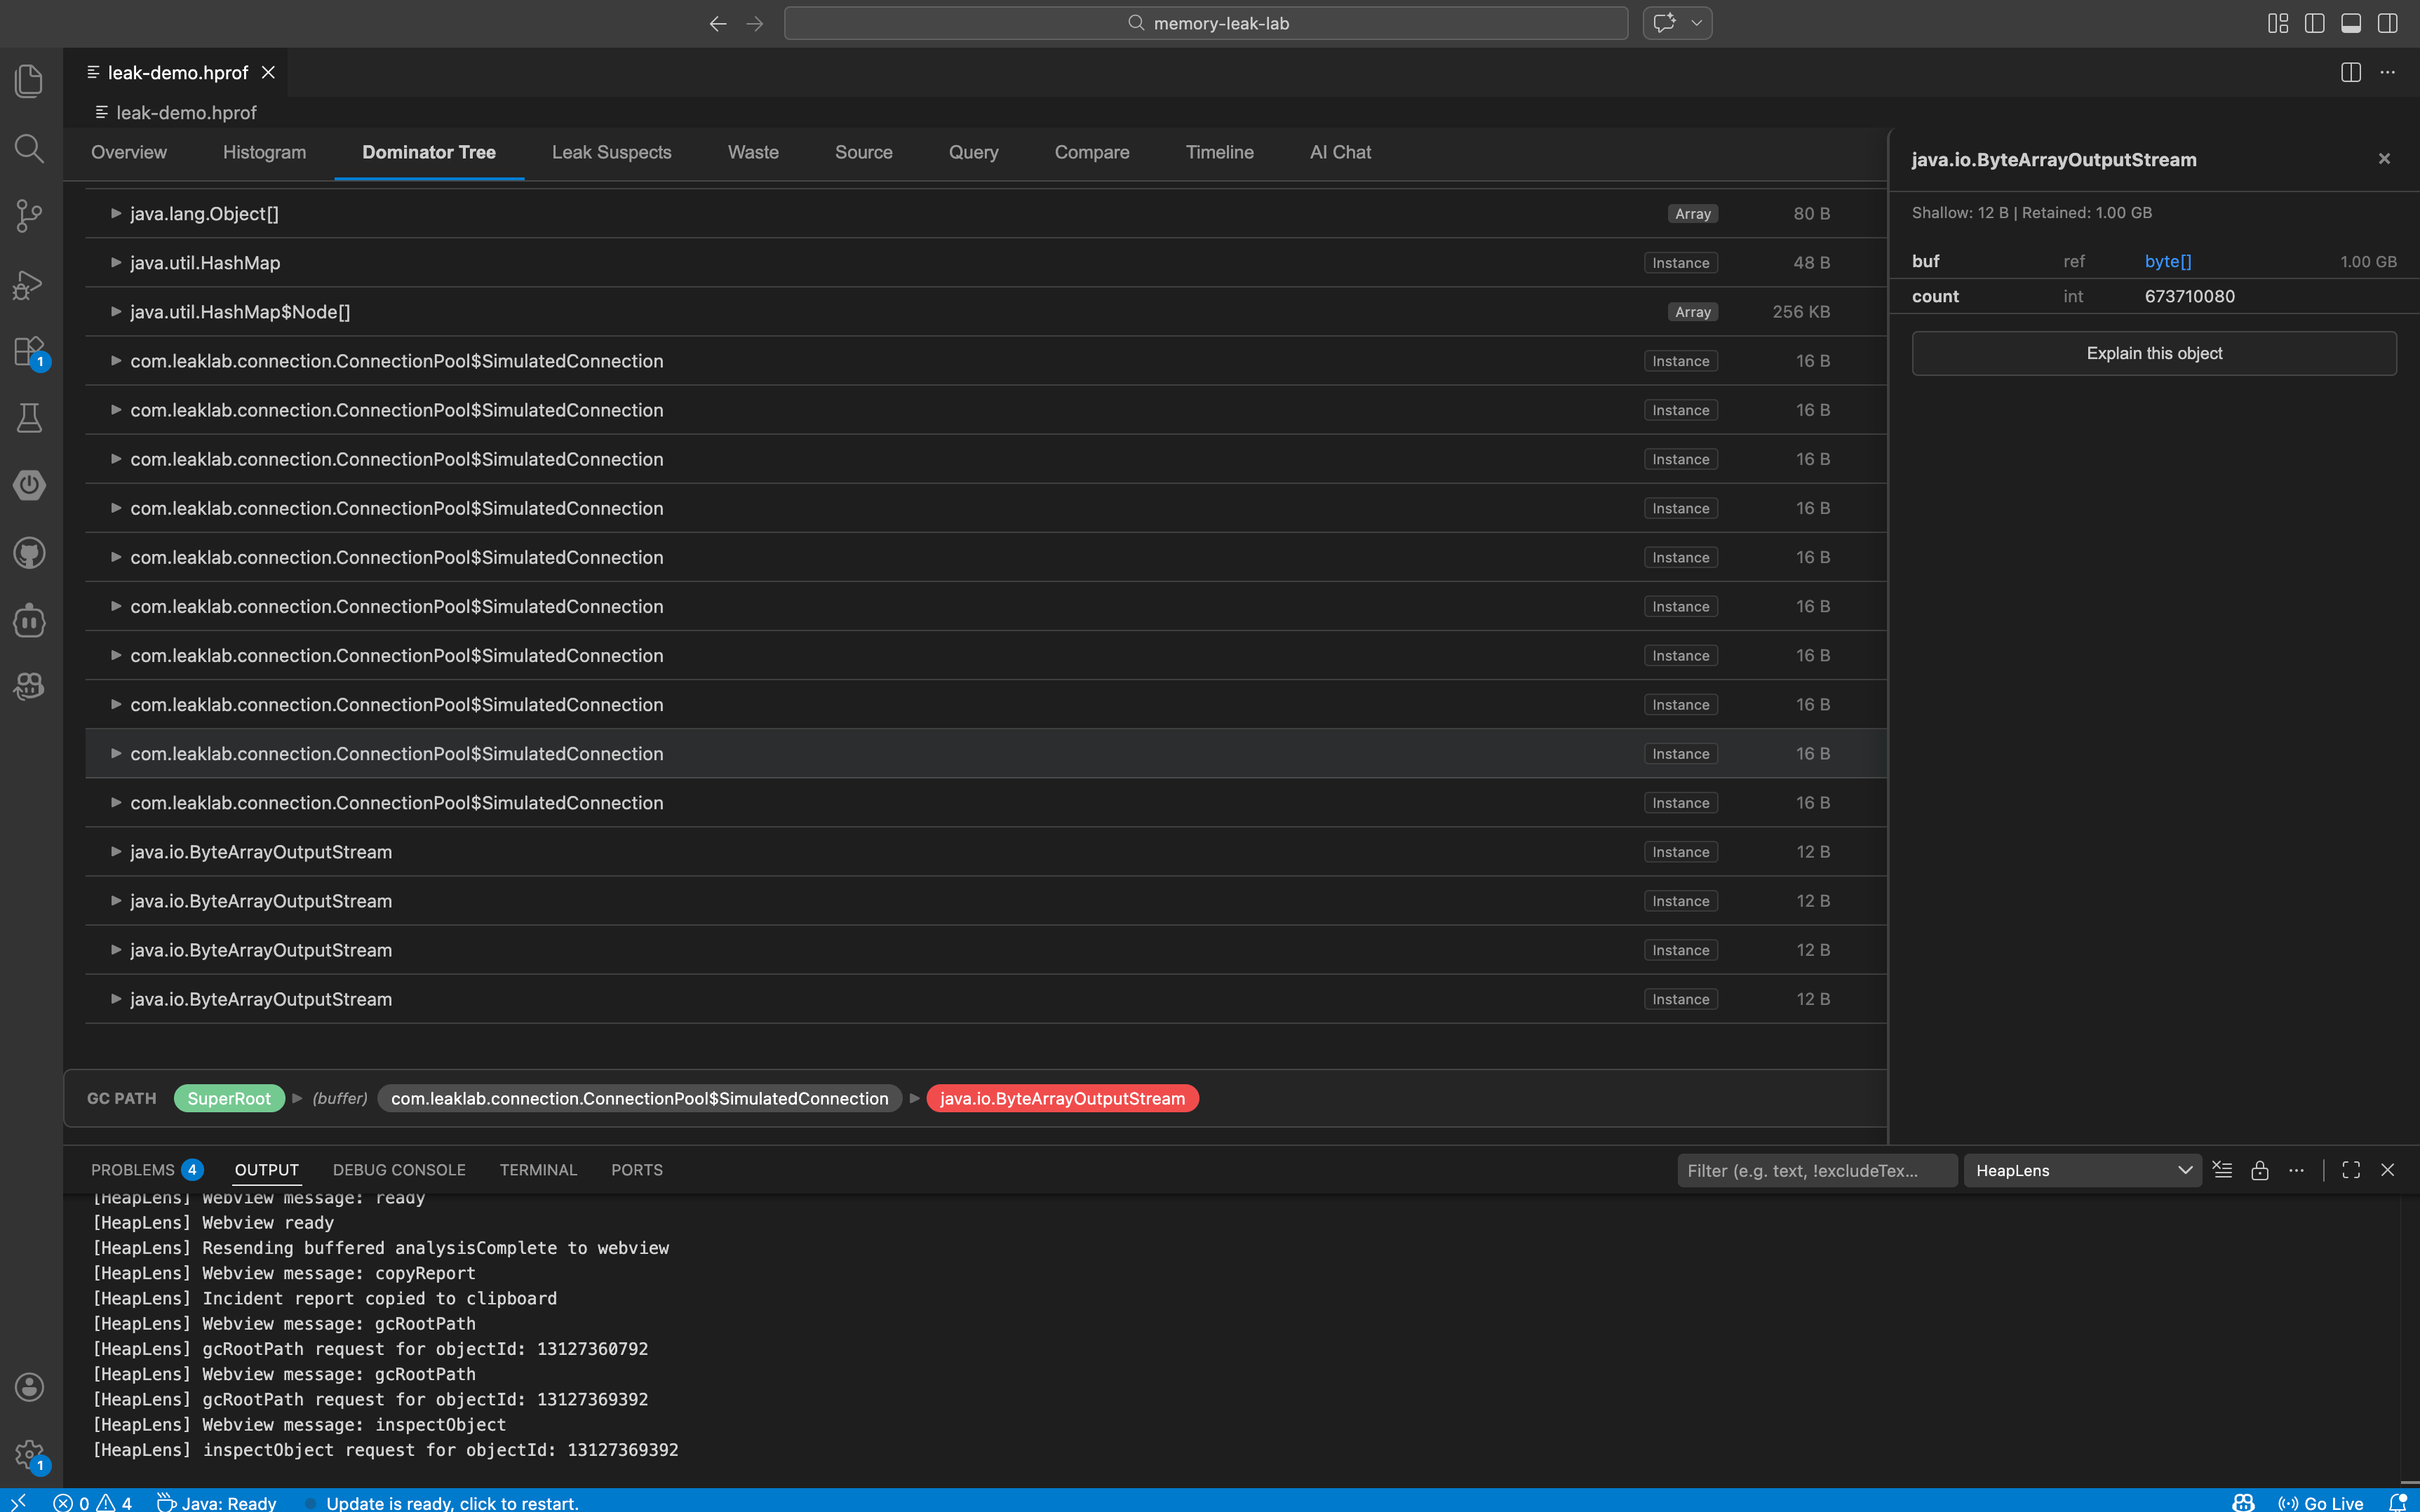
- **Inspect** — opens a field-level inspector panel with primitive values and reference links
- **Go to source** — jumps to the `.java` file (workspace, dependency JAR, or decompiled)
- **Show referrers** — "Who references this object?" with recursive drill-down
### HeapQL Query Language
A SQL-like language purpose-built for heap analysis:
```sql
-- Find all HashMaps retaining more than 1MB
SELECT * FROM instances
WHERE class_name = 'java.util.HashMap' AND retained_size > 1MB
ORDER BY retained_size DESC
-- Top 10 classes by total retained size (with column aliases)
SELECT class_name, COUNT(*) AS instance_count, SUM(retained_size) AS total_retained
FROM class_histogram
GROUP BY class_name
ORDER BY total_retained DESC LIMIT 10
-- JOIN instances with class histogram
SELECT * FROM instances i
JOIN class_histogram c ON class_name = class_name
WHERE i.retained_size > 1MB LIMIT 10
-- Subquery: objects larger than average
SELECT * FROM instances
WHERE retained_size > (SELECT AVG(retained_size) FROM instances)
ORDER BY retained_size DESC LIMIT 10
-- GC root path for a specific object
:path 123456789
-- Who references this object?
:refs 123456789
```
- **Tables:** `instances`, `class_histogram`, `dominator_tree`, `leak_suspects`
- **JOINs:** `INNER JOIN`, `LEFT JOIN` with table aliases
- **Aggregates:** `COUNT`, `SUM`, `AVG`, `MIN`, `MAX` with `AS` aliases
- **Subqueries:** `WHERE col IN (SELECT ...)`, `WHERE col > (SELECT AVG(...) FROM ...)`
- **Size literals:** `1KB`, `5MB`, `1GB`
### AI-Powered Analysis
Configure any of the 10 supported LLM providers and ask questions in the **AI Chat** tab. Supports **Anthropic**, **OpenAI**, **Google Gemini**, **DeepSeek**, **Mistral**, **Groq**, **xAI (Grok)**, **Together AI**, **OpenRouter**, and **Ollama** (local):
> *"What's causing the high memory usage?"*
> *"Show me the top 10 classes by retained size"*
> *"Why is this HashMap so large?"*
The LLM responds with explanations **and** runnable HeapQL queries. Click **Run Query** to execute them inline.
### Instance Enumeration
Click any class name in the **Histogram** tab to see all instances of that class. Each instance row has action buttons for inspect, show referrers, and "Why alive?" — no need to manually write queries.
### Source Code Bridge
Three-tier source resolution:
1. **Workspace** — finds `.java` files in your project
2. **Dependencies** — extracts from Maven/Gradle source JARs (`~/.m2`, `~/.gradle`)
3. **Decompilation** — falls back to CFR decompiler when source JARs are unavailable
### Waste Detection
Finds memory waste patterns automatically:
- **Duplicate strings** — identical string values held multiple times
- **Empty collections** — `HashMap`, `ArrayList`, etc. with zero elements
- **Over-allocated collections** — arrays sized far beyond their element count
- **Boxed primitives** — `Integer`, `Long`, etc. that could be primitive
### Snapshot Comparison & Timeline
- **Compare** two heap dumps: summary delta, class-level growth/shrinkage with change badges, leak suspect changes (new/resolved/persisted), waste delta, and a D3.js bar chart of top changes.
- **Copy Report** copies a full markdown diff report to clipboard.
- **Export CSV** saves all class changes to a file.
- **Timeline** multiple snapshots: track heap growth trends over time with interactive charts.
---
## Getting Started
1. **Install** HeapLens from the VS Code Marketplace
2. **Open** any `.hprof` file — HeapLens activates automatically
3. **Explore** the 10 tabs: Overview for a summary, Histogram to find big classes, Dominator Tree to drill down
### Generate a Heap Dump
```bash
# From a running JVM
jmap -dump:format=b,file=heap.hprof
# On OutOfMemoryError (add to JVM args)
-XX:+HeapDumpOnOutOfMemoryError -XX:HeapDumpPath=./heap.hprof
# Android (via adb)
adb shell am dumpheap /data/local/tmp/heap.hprof
adb pull /data/local/tmp/heap.hprof
```
### AI Chat Setup (Optional)
1. Go to **Settings** > search `heaplens.llm`
2. Set `heaplens.llm.provider` to your preferred provider (Anthropic, OpenAI, Gemini, DeepSeek, Mistral, Groq, xAI, Together AI, OpenRouter, or Ollama)
3. Set `heaplens.llm.apiKey` to your API key (not needed for Ollama)
4. Open the **AI Chat** tab and start asking questions
---
## Settings
| Setting | Default | Description |
|---------|---------|-------------|
| `heaplens.llm.provider` | `anthropic` | LLM provider (anthropic, openai, gemini, deepseek, mistral, groq, xai, together, openrouter, ollama) |
| `heaplens.llm.apiKey` | — | API key for the LLM provider |
| `heaplens.llm.baseUrl` | — | Custom API base URL (for proxies or self-hosted) |
| `heaplens.llm.model` | — | Model name override |
| `heaplens.sourceResolution.enabled` | `true` | Enable dependency source JAR resolution |
| `heaplens.sourceResolution.mavenHome` | — | Custom Maven repository path |
| `heaplens.sourceResolution.gradleHome` | — | Custom Gradle cache path |
| `heaplens.sourceResolution.decompilerEnabled` | `true` | Enable CFR decompilation fallback |
---
## Architecture
```
VS Code Extension (TypeScript)
└─ HprofEditorProvider (custom editor for .hprof)
└─ RustClient (JSON-RPC 2.0 over stdin/stdout)
└─ hprof-server (async Rust + tokio)
└─ Analysis engine (petgraph dominator tree,
HeapQL query engine, waste analysis)
```
- **Rust engine** — two-phase architecture with zero-copy mmap parsing, CSR edge storage, Lengauer-Tarjan dominator tree, and rayon-parallelized edge extraction
- **TypeScript extension** — VS Code custom editor, webview UI, LLM integration
- **MCP server** — `hprof-server --mcp` for use with Claude Desktop, Cline, and other AI clients
---
## Supported Formats
- Java HotSpot HPROF (JDK 8+) — analyze heap dumps from any JVM application, Spring Boot, microservices, or Kubernetes pods
- Android HPROF (Dalvik/ART) — debug memory leaks in Android apps directly from `adb` heap dumps
- HPROF versions: 1.0.1, 1.0.2, 1.0.3
- Works with heap dumps generated by `jmap`, `jcmd`, `-XX:+HeapDumpOnOutOfMemoryError`, and Android Debug Bridge
---
## Commands
| Command | Description |
|---------|-------------|
| `HeapLens: Analyze HPROF File` | Open a file picker to select and analyze a `.hprof` file |
| `HeapLens: Export Analysis to JSON` | Export the current analysis results to a JSON file |
---
## Requirements
- VS Code 1.109.0 or later
- No additional dependencies — the native Rust binary is bundled with the extension
**Optional:**
- Java on `PATH` (for CFR decompilation fallback)
- Maven/Gradle project (for dependency source resolution)
- API key for AI Chat (Anthropic, OpenAI, Gemini, DeepSeek, Mistral, Groq, xAI, Together AI, OpenRouter, or use Ollama for free local models)
---
## Performance
HeapLens uses a native Rust binary with a two-phase CSR architecture for parsing and analysis. Benchmarks on Apple M1 (median of 5 runs):
| Heap Size | Analyze Time | Throughput |
|-----------|-------------|------------|
| 1.5 GB | ~0.9 s | 1,687 MB/s |
| 2 GB | ~1.2 s | 1,645 MB/s |
| 14 GB | ~10.5 s | 1,365 MB/s |
---
## Telemetry
HeapLens collects anonymous usage telemetry (feature adoption, analysis performance) via Azure Application Insights to help improve the extension. **No PII, file paths, code content, or API keys are collected.** Telemetry respects VS Code's `telemetry.telemetryLevel` setting — set it to `off` to disable all telemetry.
---
## License
[Apache 2.0](LICENSE)