https://github.com/sakitam-fdd/ol-plot
:art: | openalyers 3 / 4 / 5 / 6 / 7 扩展标绘
https://github.com/sakitam-fdd/ol-plot
canvas gis map ol openlayers plot
Last synced: about 1 year ago
JSON representation
:art: | openalyers 3 / 4 / 5 / 6 / 7 扩展标绘
- Host: GitHub
- URL: https://github.com/sakitam-fdd/ol-plot
- Owner: sakitam-fdd
- License: mit
- Created: 2017-08-17T05:58:06.000Z (almost 9 years ago)
- Default Branch: master
- Last Pushed: 2024-07-05T10:45:18.000Z (almost 2 years ago)
- Last Synced: 2024-10-29T18:08:29.864Z (over 1 year ago)
- Topics: canvas, gis, map, ol, openlayers, plot
- Language: TypeScript
- Homepage: https://blog.sakitam.com/ol-plot/
- Size: 13.1 MB
- Stars: 160
- Watchers: 10
- Forks: 82
- Open Issues: 4
-
Metadata Files:
- Readme: README.md
- Changelog: CHANGELOG.md
- Contributing: CONTRIBUTING.md
- License: LICENSE
Awesome Lists containing this project
README
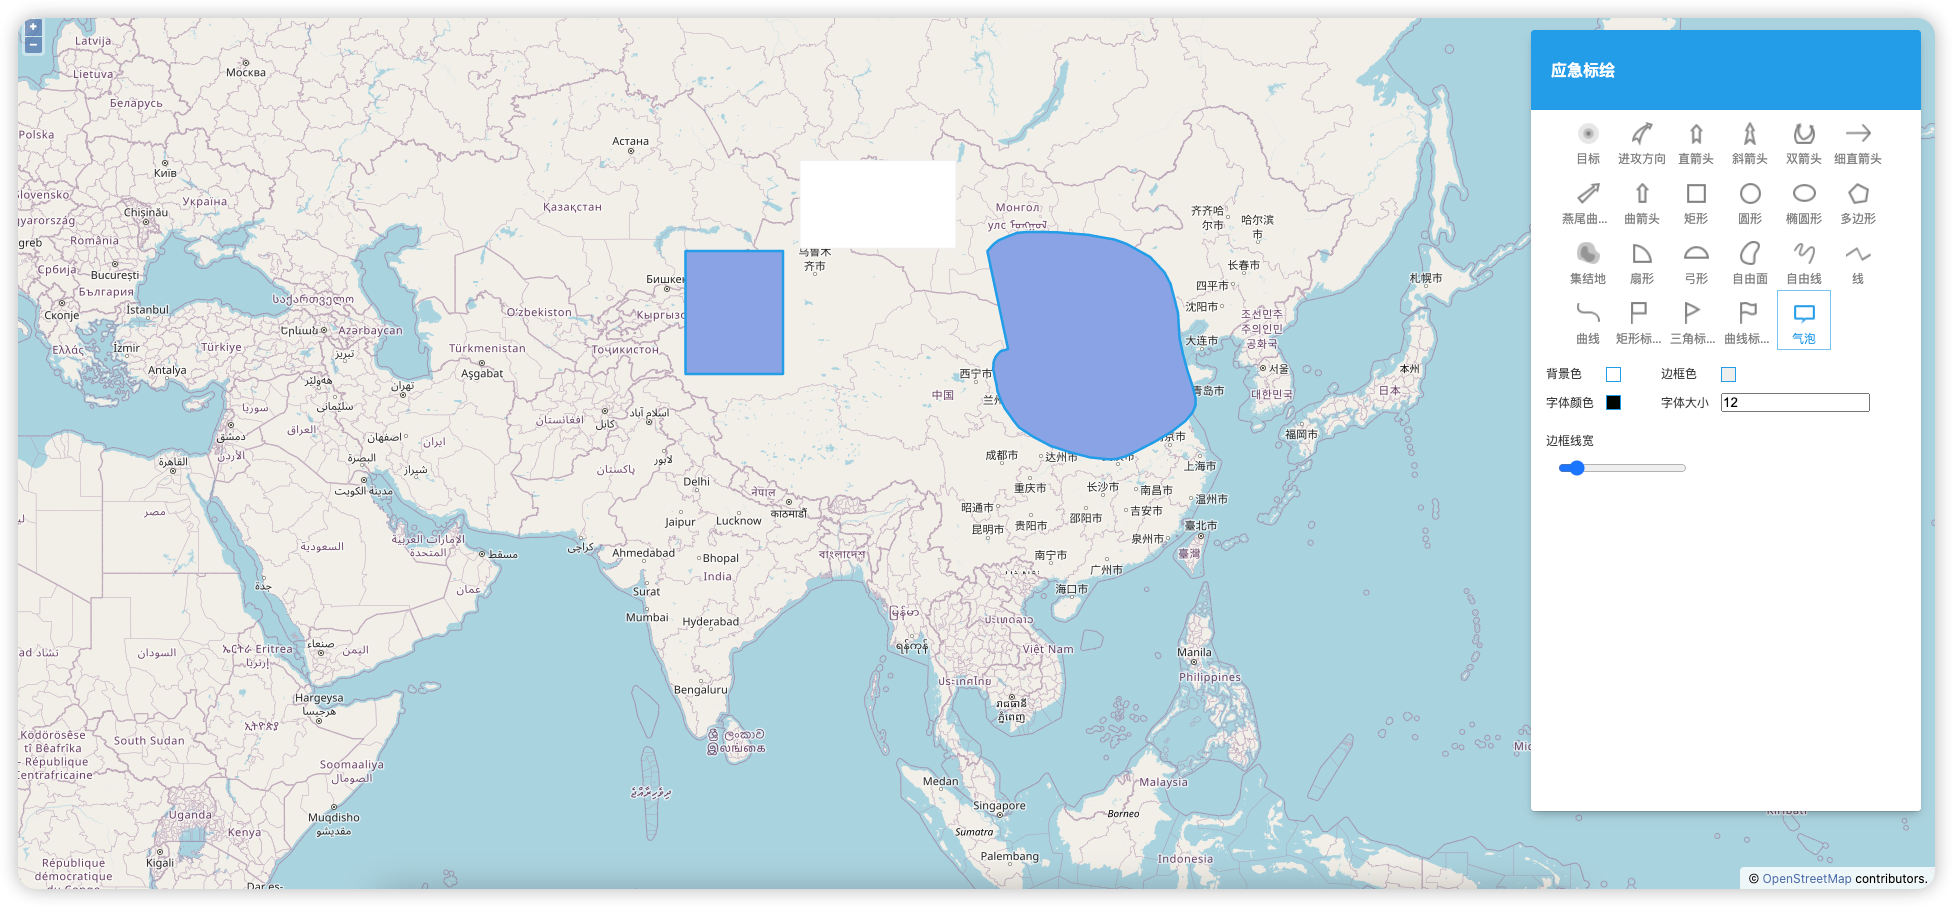
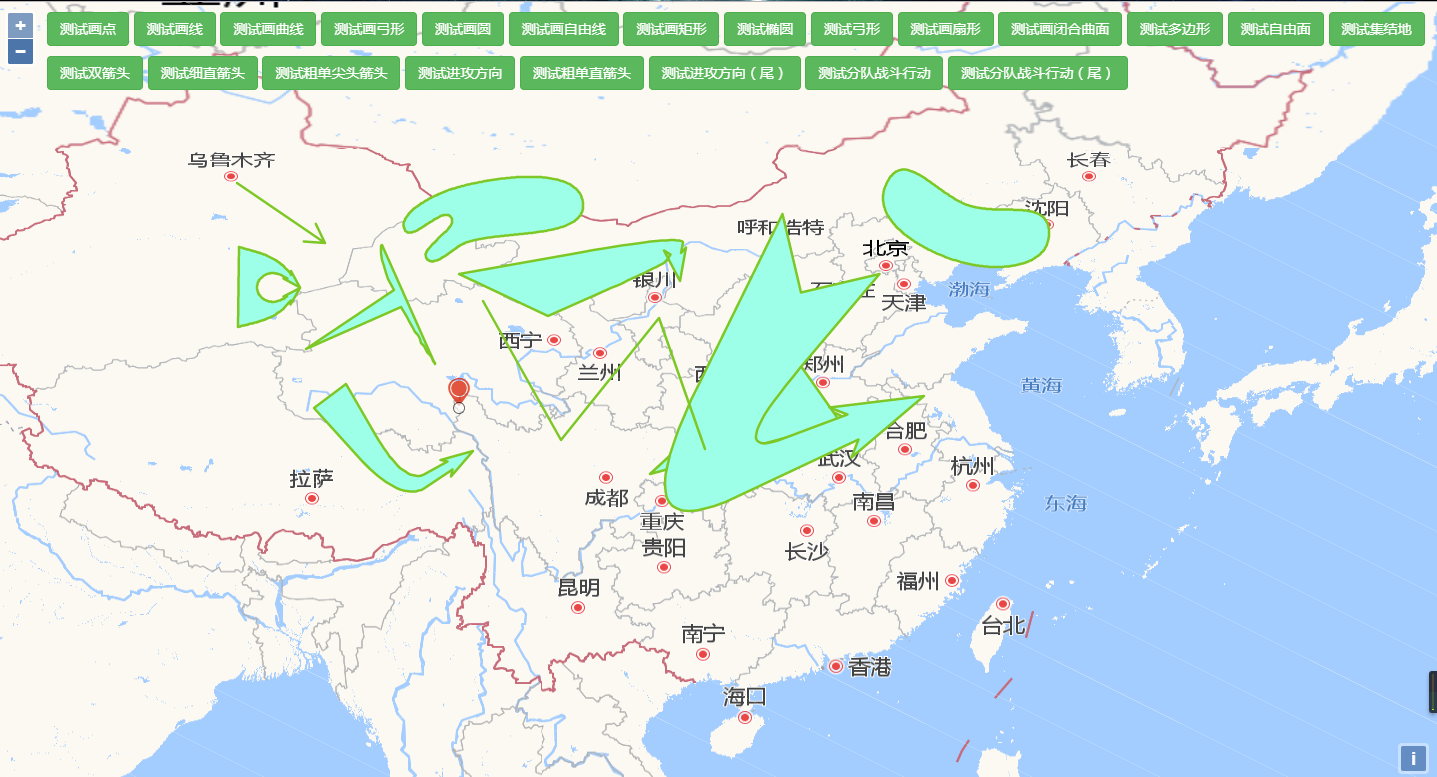
# openlayers 扩展标绘
[](https://github.com/sakitam-fdd/ol-plot/actions/workflows/ci.yml)
[](https://npm.im/ol-plot)
[](https://npm.im/ol-plot)

[](https://github.com/sakitam-fdd/ol-plot/stargazers)
[](https://raw.githubusercontent.com/sakitam-fdd/ol-plot/master/LICENSE)
标绘功能,支持openlayers5 / 6 / 7;同时也实现了一个简单的 Vue 组件,请查看 `playground/vue3` 使用,npm 发布的包为 [](https://npm.im/ol-plot-vue)
## build
> 重要: 如果想要使用 Github 上最新的源码,你需要自己构建。
---
```bash
git clone https://github.com/sakitam-fdd/ol-plot.git
pnpm run dev
pnpm run build
```
## Use
> `new olPlot.(map) 初始化标绘绘制工具`
### CDN
```bash
https://unpkg.com/ol-plot/dist/ol-plot.js
https://unpkg.com/ol-plot/dist/ol-plot.css
```
### NPM
```bash
npm install ol-plot --save
import 'ol-plot/dist/ol-plot.css'
import Plot form 'ol-plot'
```
## Examples
[](https://sakitam-fdd.github.io/ol-plot)
[](https://codepen.io/sakitam-fdd/pen/QMQydz)
其他示例请参看 playground 文件夹
## 实例方法
### plotDraw Methods
#### `activate(type, params)`
> 激活标绘工具
| key | type | desc |
|:---------|:---------|:-------|
| `type` | `string` | 标绘符号类型 |
| `params` | `Object` | 标绘符号参数 |
##### `type`
> 标绘类型
###### type:
| key | type | desc |
|:---------------------------------------| :--- |:----------|
| `olPlot.PlotTypes.ARC` | `string` | 弓形 |
| `olPlot.PlotTypes.ELLIPSE` | `string` | 椭圆 |
| `olPlot.PlotTypes.CURVE` | `string` | 曲线 |
| `olPlot.PlotTypes.CLOSED_CURVE` | `string` | 闭合曲面 |
| `olPlot.PlotTypes.LUNE` | `string` | 弓形 |
| `olPlot.PlotTypes.SECTOR` | `string` | 扇形 |
| `olPlot.PlotTypes.GATHERING_PLACE` | `string` | 集结地 |
| `olPlot.PlotTypes.STRAIGHT_ARROW` | `string` | 细直箭头 |
| `olPlot.PlotTypes.ASSAULT_DIRECTION` | `string` | 粗单直箭头 |
| `olPlot.PlotTypes.ATTACK_ARROW` | `string` | 进攻方向 |
| `olPlot.PlotTypes.TAILED_ATTACK_ARROW` | `string` | 进攻方向(尾) |
| `olPlot.PlotTypes.SQUAD_COMBAT` | `string` | 战斗行动 |
| `olPlot.PlotTypes.TAILED_SQUAD_COMBAT` | `string` | 分队战斗行动(尾) |
| `olPlot.PlotTypes.FINE_ARROW` | `string` | 粗单尖头箭头 |
| `olPlot.PlotTypes.CIRCLE` | `string` | 圆 |
| `olPlot.PlotTypes.DOUBLE_ARROW` | `string` | 双箭头 |
| `olPlot.PlotTypes.POLYLINE` | `string` | 线 |
| `olPlot.PlotTypes.FREEHAND_LINE` | `string` | 自由线 |
| `olPlot.PlotTypes.POLYGON` | `string` | 面 |
| `olPlot.PlotTypes.FREEHAND_POLYGON` | `string` | 自由面 |
| `olPlot.PlotTypes.RECTANGLE` | `string` | 矩形 |
| `olPlot.PlotTypes.RectInclined1` | `string` | 斜矩形1 |
| `olPlot.PlotTypes.RectInclined2` | `string` | 斜矩形2 |
| `olPlot.PlotTypes.MARKER` | `string` | 点 |
| `olPlot.PlotTypes.TEXTAREA` | `string` | 文本框 |
#### `deactivate()`
取消绘制工具的激活状态
### plotEdit Methods
#### `activate(feature)`
| key | type | desc |
| :--- | :--- | :---------- |
| `feature` | `ol.Feature` | 要激活的标绘符号 |
激活符号要素编辑
#### `deactivate()`
取消符号要素编辑状态
### PlotUtils Methods
| 方法 | 说明 | 参数 |
| :--- | :--- | :---------- |
| `getFeatures` | 序列化地图上所有符号 | -- |
| `addFeatures` | 反序列化保存的符号 | `features : Array` |
| `removeAllFeatures` | 删除所有符号 | -- |
## 事件
### plotDraw
```js
plot.plotDraw.on('drawStart', (e) => {
console.log(e);
});
plot.plotDraw.on('drawEnd', onDrawEnd);
```
#### drawStart
监听符号开始绘制,通过事件类型 ``plotType`` 判断是哪种标绘类型
#### drawEnd
监听符号结束绘制,通过事件类型 ``plotType`` 判断是哪种标绘类型
### plotEdit
```js
plot.plotEdit.on('activePlotChange', (e) => {
console.log(e);
});
plot.plotEdit.on('deactivatePlot', (e) => {
console.log(e);
});
```
#### activePlotChange
激活编辑状态的要素变化事件
#### deactivatePlot
监听要素结束编辑状态
### plot 实例事件
比较特殊,3.0 版本是绑定在 map 实例上的,从 4.0 版本起需要绑定在 plot 实例上。
```js
plot.on('activeTextArea', (e) => {
console.log(e);
});
plot.on('deactivateTextArea', (e) => {
console.log(e);
});
```
#### activeTextArea
激活文本框编辑事件
#### deactivateTextArea
取消激活文本框编辑事件