https://github.com/sakrist/vbpiechart
🍰📈 Pie Chart iOS control with different animations to present.
https://github.com/sakrist/vbpiechart
animation calayer ios objective-c pie-chart swift
Last synced: 8 months ago
JSON representation
🍰📈 Pie Chart iOS control with different animations to present.
- Host: GitHub
- URL: https://github.com/sakrist/vbpiechart
- Owner: sakrist
- License: mit
- Created: 2014-07-26T18:20:31.000Z (almost 12 years ago)
- Default Branch: master
- Last Pushed: 2017-12-03T19:57:39.000Z (over 8 years ago)
- Last Synced: 2025-04-07T13:48:21.227Z (about 1 year ago)
- Topics: animation, calayer, ios, objective-c, pie-chart, swift
- Language: Objective-C
- Homepage:
- Size: 4.49 MB
- Stars: 283
- Watchers: 18
- Forks: 79
- Open Issues: 0
-
Metadata Files:
- Readme: README.md
- Changelog: CHANGELOG.md
- License: LICENSE
Awesome Lists containing this project
README
[](https://travis-ci.org/sakrist/VBPieChart)
[](https://cocoapods.org/pods/VBPieChart)
[](http://doge.mit-license.org)
# [VBPieChart](https://github.com/sakrist/VBPieChart)
Animated Pie Chart control for iOS apps, based on CALayer. Very easy in use and have custom labeling.
## Usage
#### Create simple pi chart with VBPieChart:
```objc
VBPieChart *chart = [[VBPieChart alloc] initWithFrame:CGRectMake(10, 50, 300, 300)];
[self.view addSubview:chart];
// Setup some options:
[chart setEnableStrokeColor:YES];
[chart setHoleRadiusPrecent:0.3]; /* hole inside of chart */
// Prepare your data
NSArray *chartValues = @[
@{@"name":@"Apples", @"value":@50, @"color":[UIColor redColor]},
@{@"name":@"Pears", @"value":@20, @"color":[UIColor blueColor]},
@{@"name":@"Oranges", @"value":@40, @"color":[UIColor orangeColor]},
@{@"name":@"Bananas", @"value":@70, @"color":[UIColor purpleColor]}
];
// Present pie chart with animation
[chart setChartValues:chartValues animation:YES duration:0.4 options:VBPieChartAnimationFan];
```
`chartValues` needs to be defined as an array of dictionaries.
Dictionary **required** to contain value for piece with key `value`.
Optional:
- `name`
- `color`
- `labelColor`
- `accent`
- `strokeColor`
#### Chart from JSON
```objc
VBPieChart *chart = [[VBPieChart alloc] initWithFrame:CGRectMake(10, 50, 300, 300)];
chart.startAngle = M_PI+M_PI_2;
chart.holeRadiusPrecent = 0.5;
[self.view addSubview:chart];
NSString *json_example = @"[ {\"name\":\"first\", \"value\":\"50\", \"color\":\"#84C69B\", \"strokeColor\":\"#fff\"}, \
{\"name\":\"second\", \"value\":\"60\", \"color\":\"#FECEA8\", \"strokeColor\":\"#fff\"}, \
{\"name\":\"second\", \"value\":\"75\", \"color\":\"#F7EEBB\", \"strokeColor\":\"#fff\"}, \
{\"name\":\"second\", \"value\":\"90\", \"color\":\"#D7C1E0\", \"strokeColor\":\"#fff\"} ]";
NSData *data = [json_example dataUsingEncoding:NSUTF8StringEncoding];
NSArray *chartValues = [NSJSONSerialization JSONObjectWithData:data options:0 error:nil];
[chart setChartValues:chartValues animation:YES duration:0.5 options:VBPieChartAnimationFan];
```
#### Chart with custom label position
```objc
VBPieChart *chart = [[VBPieChart alloc] initWithFrame:CGRectMake(10, 50, 300, 300)];
chart.startAngle = M_PI+M_PI_2;
chart.holeRadiusPrecent = 0.5;
[self.view addSubview:chart];
[chart setLabelsPosition:VBLabelsPositionCustom];
[chart setLabelBlock:^CGPoint( CALayer *layer, NSInteger index) {
CGPoint p = CGPointMake(sin(-index/10.0*M_PI)*50+50, index*30);
return p;
}];
[chart setChartValues:@[
@{@"name":@"37%", @"value":@65, @"color":@"#5677fcaa", @"labelColor":@"#000"},
@{@"name":@"13%", @"value":@23, @"color":@"#2baf2baa", @"labelColor":@"#000"},
@{@"name":@"19.3%", @"value":@34, @"color":@"#b0bec5aa", @"labelColor":@"#000"},
@{@"name":@"30.7%", @"value":@54, @"color":@"#f57c00aa", @"labelColor":@"#000"}
]
animation:YES];
```
## Basic Documentation
`VBPieChart` is subclass of `UIView`.
#### Properties
`length`
Length of circle pie. Min values is 0 and max value 2*M_PI.
`startAngle`
Start angle of pie. (M_PI will make start at left side)
`holeRadiusPrecent`
hole radius in % of whole radius. Values 0..1. (acual hole radius will be calculated **radius***`holeRadiusPrecent`)
`radiusPrecent`
Defines the **radius**, **full radius** = frame.size.width/2, actual **radius** = **full radius***`radiusPrecent`. Value 0..1.
`labelBlock`
Block will help to redefine positions for labels.
#### Methods
Get all changed chart values back.
`- (NSArray *) chartValues;`
Simple setup data.
`- (void) setChartValues:(NSArray *)chartValues;`
Setup data to pie chart with animation or not, animation options and duration.
`- (void) setChartValues:(NSArray *)chartValues animation:(BOOL)animation duration:(float)duration options:(VBPieChartAnimationOptions)options;`
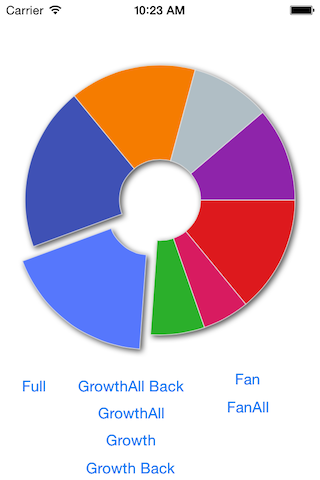
Animation options:
* `VBPieChartAnimationFanAll`
* `VBPieChartAnimationGrowth`
* `VBPieChartAnimationGrowthAll`
* `VBPieChartAnimationGrowthBack`
* `VBPieChartAnimationGrowthBackAll`
* `VBPieChartAnimationFan`
* `VBPieChartAnimationTimingEaseInOut`
* `VBPieChartAnimationTimingEaseIn`
* `VBPieChartAnimationTimingEaseOut`
* `VBPieChartAnimationTimingLinear`
Change value for elemet at index. Value will be changed with animation.
`- (void) setValue:(NSNumber*)value pieceAtIndex:(NSInteger)index;`
Insert new piece at index. Animated.
`- (void) insertChartValue:(NSDictionary*)chartValue atIndex:(NSInteger)index;`
Remove piece at index.
`- (void) removePieceAtIndex:(NSInteger)index;`
Supported with ad:
(adsbygoogle = window.adsbygoogle || []).push({});