https://github.com/sandialabs/galen-view
Python software for visualizing and exploring the CORD-19 Dataset
https://github.com/sandialabs/galen-view
scr-2504 snl-data-analysis snl-visualization
Last synced: about 1 year ago
JSON representation
Python software for visualizing and exploring the CORD-19 Dataset
- Host: GitHub
- URL: https://github.com/sandialabs/galen-view
- Owner: sandialabs
- License: other
- Created: 2020-04-27T23:07:34.000Z (about 6 years ago)
- Default Branch: master
- Last Pushed: 2020-07-15T14:49:55.000Z (about 6 years ago)
- Last Synced: 2025-04-19T07:50:56.284Z (over 1 year ago)
- Topics: scr-2504, snl-data-analysis, snl-visualization
- Language: Jupyter Notebook
- Homepage:
- Size: 9.99 MB
- Stars: 4
- Watchers: 3
- Forks: 1
- Open Issues: 2
-
Metadata Files:
- Readme: README.md
- License: LICENSE.txt
Awesome Lists containing this project
README
# Description
galen-view is a visualizer for exploring the CORD-19 dataset on a stand-alone
desktop computer. The code is intended to be small and straight-forward,
enabling researchers to expand and modify the code.
This software was written as part of an effort at Sandia National
Laboratories described
[here](https://github.com/sandialabs/galen-view/blob/master/SAND2020-4510-RapidResponseDataScienceForCOVID-19.pdf)
This code is named after Galen, a second century Greek physician who
documented the Antonine Plague in the Roman Empire.
# Installation
## Create a python 3 environment
galen-view was written and tested in python 3 and uses syntax specific to
python 3. To get started, create a python 3 environment.
For example, if you are using anaconda, you can execute the following:
```bash
conda create -n galenenv python=3
conda activate galenenv
```
If you are using Anaconda on Windows 10, also type:
```bash
conda install holoviews
```
## Install the wheel file
Installing the wheel file will install galen-view along with it's various
dependencies. galen-view is based on holoviews, so there are a large number
of dependencies.
This can be done using:
```bash
pip install galen-view
```
# Data Download and Configuration
The module sandia.galen.dataprep contains several methods for downloading,
analyzing, and indexing the cord-19 dataset. For convenience, the module
can be executed as an "all-in-one" call do perform all these funcions and
prepare the data for galen-view.
If you are behind a proxy, you will need to set the environment variables
in order to download the data. This can be accomplished by setting the
http_proxy and https_proxy environment variables. If the
"pip install" step above worked, it is highly likely that you already have
them set properly. Note that this is only necessary for the
download and not for galen-view to work after that.
This will download files and create more. It is recommended to do this
in a fresh directory.
To create a new directory:
```base
mkdir galen_data
cd galen_data
```
Then run one of the following two commands:
For a faster startup time that only analyzes the first 2000 documents
(You may have to use "python" rather than "python3"):
```bash
python3 -m sandia.galen.dataprep test
```
To analyze all the downloaded documents, execute the following.
(You may have to use "python" rather than "python3").
This can take hourse, but you only have to do it once:
```bash
python3 -m sandia.galen.dataprep
```
You will see progress during
each step. You should see something similar to the following:
```
$ python3 -m sandia.galen.dataprep
Initializing Data in Current Directory
Checking for Data in this Directory
Downloading the metadata file
Downloading the CORD-19 Dataset
Processing https://path/to/biorxiv_medrxiv.tar.gz ... Done.
Processing https://path/to/comm_use_subset.tar.gz ... Done.
Processing https://path/to/noncomm_use_subset.tar.gz ... Done.
Processing https://path/to/pmc_custom_license.tar.gz ... Done.
Processing https:///custom_license.tar.gz ... Done.
Processing https:///cord19_specter_embeddings_2020-04-03.tar.gz ... Done.
Processing https:///cord19_specter_embeddings_2020-04-10.tar.gz ... Done.
========
Making the Coordinates to Visualize the Data
========
Building a searchable index from the documents
..........
..........
..........
[There will be more lines like this]
..........
..........
..........
Done. Committing Index
Done Indexing
========
Done. Run "jupyter-notebook GalenView.ipynb" and run all cells to explore the data.
```
# Usage
sandia.galen.dataprep's final step is to copy a jupyter notebook
into the directory that can be used to view and explore the data.
You can open this notebook in a variety of ways, but the following
will open it directly:
```bash
jupyter-notebook GalenView.ipynb
```
After executing this, a web browser should open with the jupyter
notebook. You still have to run all the cells in the notebook to
activate and use the visualization.
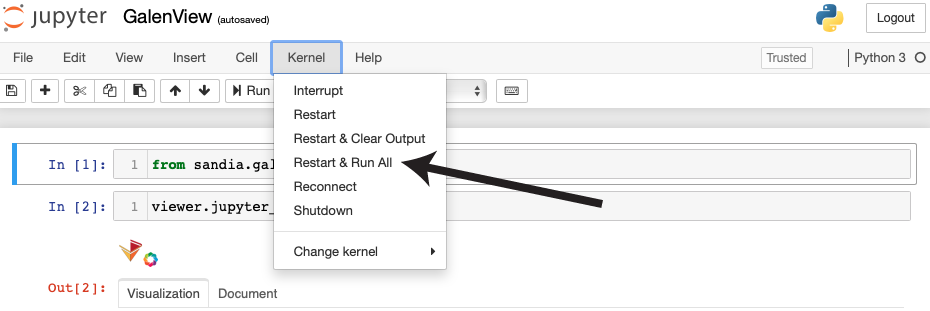
After the notebook loads, click "Restart & Runn All" from the menu at the top of the page.
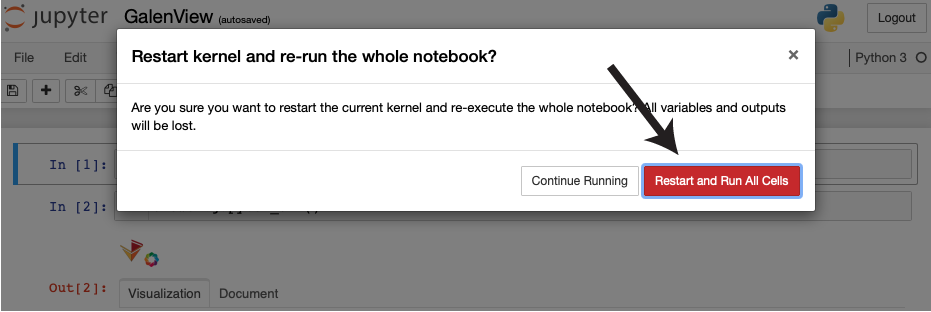
A window will appear prompting you to restart the notebook. Click the red button.
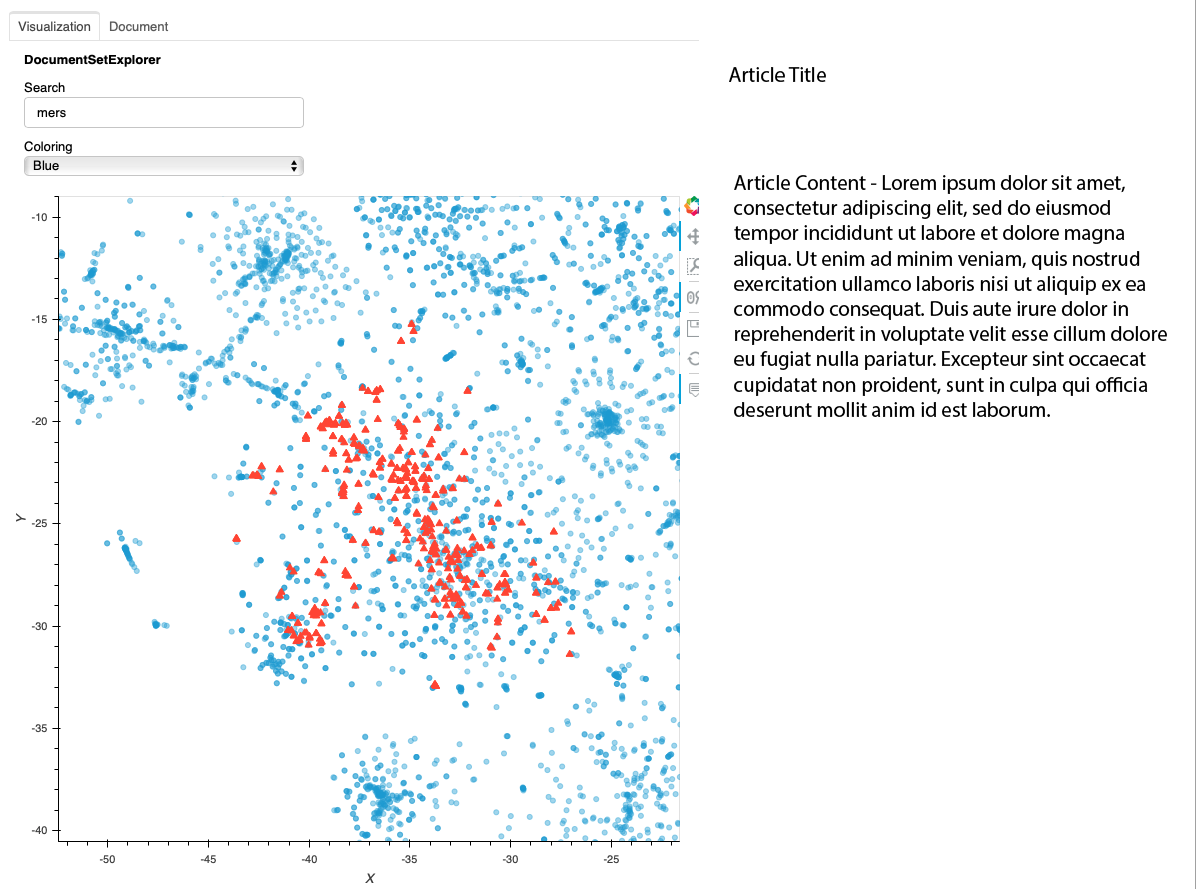
On the page, you will now see the full interface. Each point in the
graph represents a document. Hovering your mouse over a point or
group of points will display the title. Clicking on a point will
cause the title and first 1500 characters (if full text is included in
the CORD19 dataset) on the right hand side. Clicking on the
"Document" tab will show the full text of the document.
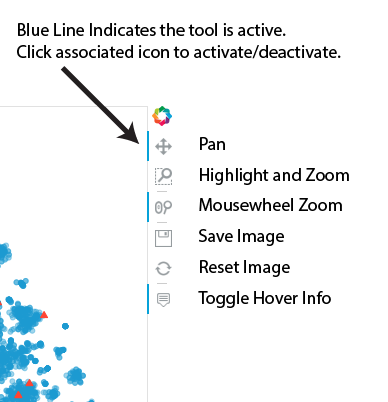
This interface lets you explore the various clusters of data by panning
and zooming. The individual controls are described at the left.
You can type in a query in the Search box and press enter. The points
corresponding to the matching documents will turn into red triangles.
Note that the documents are indexed using a python library called
"whoosh" which contains a query language that lets you use advanced
syntax such as boolean and proximity queries. More information on
that query syntax can be found
[here](https://whoosh.readthedocs.io/en/latest/querylang.html).
This following is a short description of each part of the user interface:
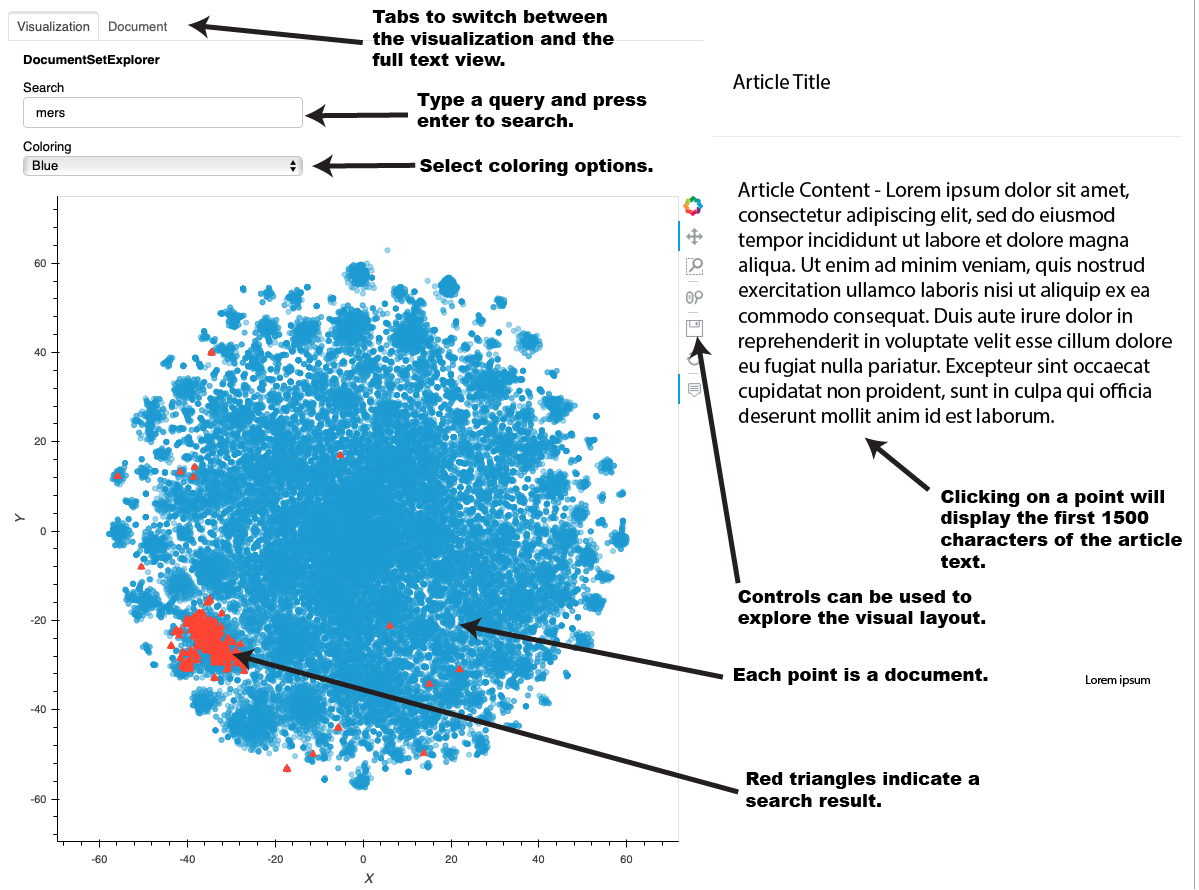
In the above example, the user has searched for the term "mers." The
documents that reference "mers" are mostly found in a particular
cluster at the lower left. Note that because of how the layout
algorithm works, the cluster in your interface may be different. By
using the controls, the user can zoom in on that cluster. The
following image shows what that might look like. Note that the "mers"
matches are in a cluster, but you can see similar clusters nearby.
Through hovering, zomming, panning, and clicking, the user can explore
the data set.
# Coloring
(Note: This section requres python development expertise)
In the paper associated with this codebase, compression-based
analytics were used to color the documents according to how well they
matched snippets of text provided by subject matter experts. The code
to perform the compression-based analytics is not included in this
codebase. However, it is possible to score documents in many
different ways (even by something like year of publication). If you
have a methodology for scoring the documents, you can get them into
the visualization using the following steps:
1. Run the "Data Download and Configuration" step above. When it
finishes, there will be a file called "metadata.df.pickle." in the
data directory. This is a pandas DataFrame that can be read using
pandas.read_pickle. The index (and integer) corresponds with the
integer used by cotools in the cord-19-tools and is how the tool
identifies the documents.
2. Create a score per document using whatever means is useful for
your subject matter experts.
3. Append those scores as a new column to the DataFrame from step 1.
Write it back out to metadata.df.pickle.
4. Create a Jupyter Notebook and create the visualization using the
following code (where "myscore" is the name of column you added):
```python
from sandia.galen.viewer import DocumentSetExplorer
display(HTML(".container { width:100% !important; }"))
hv.extension('bokeh')
d = DocumentSetExplorer(scoring_cols=["myscore"])
d.main_viz()
```
If you want to test how this works before trying your own score,
you can skip steps 2 and 3 and use "X" in place of "myscore." This will
simply color the points according to their X value.
# Notes and TOOD
* A large percentage of the documents do not have associated with
them. All documents are arranged in the 2D space using both the
title and content. But the search only searches the content unless
you explicitly specify the title (using title:query). This is by
design but can be confusing when navigating the space. This could
be changed in a future version.
* There currently is no way to set aside a document. This is entirely
possible within the holoviews framework but is not yet impelemented.
* It would be useful to include author, date published, journal, and
other fields in the metadata. This information for many of the
documents are in the metadata file and could be incorporated in the
hover and visualization.
* Links to the original documents that include tables and figures is
important. For the documents that contain pubmed ids in the
metadata, this is straight forward to do.
* Implement better parsing of the documents, especially adding an
ability to jump directly to different sections, depending on the
specific question being asked. Sometimes, for example, it would be
helpful to jump directly to the abstract. In other cases, jumping
directly to the "methods" section would be best. Parsing research
papers in this way is hard, but to the extent it can be done, the
right hand summary pane could be customizable.
* Add in paragraph spacing to increase readability. Right now, the
document display used that cotools returns. But the underlying text
is generally stored in a way that is better broken up and could be
displayed with better paragraph breaks.