Ecosyste.ms: Awesome
An open API service indexing awesome lists of open source software.
https://github.com/sankhadip-roy/statistics-calculator
1st year college project
https://github.com/sankhadip-roy/statistics-calculator
c college-project statistics
Last synced: about 2 months ago
JSON representation
1st year college project
- Host: GitHub
- URL: https://github.com/sankhadip-roy/statistics-calculator
- Owner: sankhadip-roy
- Created: 2022-06-10T18:05:18.000Z (over 2 years ago)
- Default Branch: main
- Last Pushed: 2024-10-18T16:11:43.000Z (3 months ago)
- Last Synced: 2024-11-20T04:39:33.940Z (about 2 months ago)
- Topics: c, college-project, statistics
- Language: C
- Homepage:
- Size: 60.5 KB
- Stars: 1
- Watchers: 1
- Forks: 0
- Open Issues: 0
-
Metadata Files:
- Readme: README.md
Awesome Lists containing this project
README
        To compile in linux machine using gcc:

```

gcc stat-calc-linux.c -o  -lm

```

To compile in windows machine use MinGW: stat-calc-windows.c

                                          College 1st Year Group D PCA2 Project

`PROBLEM STATEMENT:`

> Statistic Calculator

>

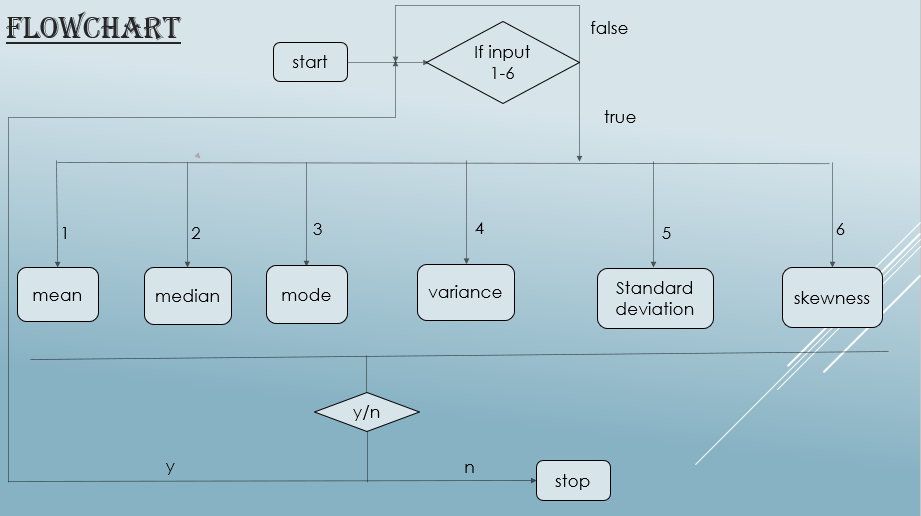
> > It should include all basic statistical calculations. Use proper header file and file management. A menu driven should be presented. All operations are utilised through proper function call. Try to create your own header files.
- mean
- median
- mode
- variance
- standard deviation
`INTRODUCTION:`
> Statistics as a subject now has become more and more popular and its applications has become more extensive. Now there is hardly any field of human activity where statistics is not used . So, I have developed a statistical calculator which can perform basic statistical operations.
`ALGORITHM:`
> The **_mean_** (average) of a data set is found by adding all numbers in the data set and then dividing by the number of values in the set.
> The **_median_** is the middle number in a sorted, ascending or descending, list of numbers and can be more descriptive of that data set than the average.
> The **_mode_** is defined as the value that has a higher frequency in a given set of values. It is the value that appears the most number of times.
> The **_variance_** is a measure of variability. It is calculated by taking the average of squared deviations from the mean. Variance tells you the degree of spread in your data set. The more spread the data, the larger the variance is in relation to the mean.
> The **_standard deviation_** (or σ) is a measure of how dispersed the data is in relation to the mean (standard deviation is the square root of the variance)

`SCOPE OF STATISTICS:`
- Helps in economic planning
- Helps in business and management
- In administration
- In research
- Economic problems such as production, consumption, wages, price profits, unemployment, poverty etc. can also be expressed numerically.
As the use of statistics in future developments is very huge, so statistics calculator would also play a very huge role in near future.