Ecosyste.ms: Awesome
An open API service indexing awesome lists of open source software.
https://github.com/santiagoenriquega/artist_similarity_network
Semantic artist similarity to visualize artist networks based on Last.fm data. It utilizes Python with NetworkX for network analysis as well as Plotly and D3.js for interactive visualization.
https://github.com/santiagoenriquega/artist_similarity_network
d3 d3js network networkx networkx-graph plotly pyhton python3
Last synced: about 16 hours ago
JSON representation
Semantic artist similarity to visualize artist networks based on Last.fm data. It utilizes Python with NetworkX for network analysis as well as Plotly and D3.js for interactive visualization.
- Host: GitHub
- URL: https://github.com/santiagoenriquega/artist_similarity_network
- Owner: SantiagoEnriqueGA
- Created: 2024-06-07T01:41:04.000Z (8 months ago)
- Default Branch: main
- Last Pushed: 2024-06-09T00:15:20.000Z (8 months ago)
- Last Synced: 2024-12-13T10:49:05.188Z (about 2 months ago)
- Topics: d3, d3js, network, networkx, networkx-graph, plotly, pyhton, python3
- Language: Python
- Homepage:
- Size: 7.2 MB
- Stars: 0
- Watchers: 1
- Forks: 0
- Open Issues: 0
-
Metadata Files:
- Readme: README.md
Awesome Lists containing this project
README
# Semantic Artist Similarity Analysis
## Overview
This project analyzes artist similarity using data from the **Semantic Artist Similarity (SAS) Dataset**. The main components of the project include:
1. `SAS_networkx.py`: Python script for building and analyzing the artist similarity network using NetworkX.
2. `SAS_D3.html`: HTML file for visualizing the network using D3.js.
3. `network_data` folder: Contains saved edges, nodes, and the graph data.
4. `plots` folder: Contains saved plots generated from the code.
5. `dataset-artist-similarity` folder: Contains data from the SAS dataset.
## SAS Dataset
The data used in this project is obtained from the **SAS: Semantic Artist Similarity Dataset**, which consists of two datasets of artist entities with their corresponding biography texts and a list of the top-10 most similar artists within the datasets used as ground truth.
### Files in the Dataset
1. `mirex_gold_top10.txt` and `lastfmapi_gold_top10.txt`: These files contain the top-10 lists of artists for every artist in both datasets, identified by MusicBrainz ID.
2. `mb2uri_mirex.txt` and `mb2uri_lastfmapi.txt`: These files contain the MusicBrainz ID, Last.fm name, and DBpedia URI for each artist.
3. Biography Texts: The biography texts of each artist are stored as `.txt` files named with the MusicBrainz ID.
## SAS_networkx.py
This Python script (`SAS_networkx.py`) is used for building and analyzing the artist similarity network. It includes the following functionalities:
- **Graph Class**: Represents the artist similarity network and provides methods for adding nodes, edges, calculating metrics, and visualizing the network.
- **Parsing Functions**: Functions to parse data from the SAS dataset and add nodes/edges to the graph.
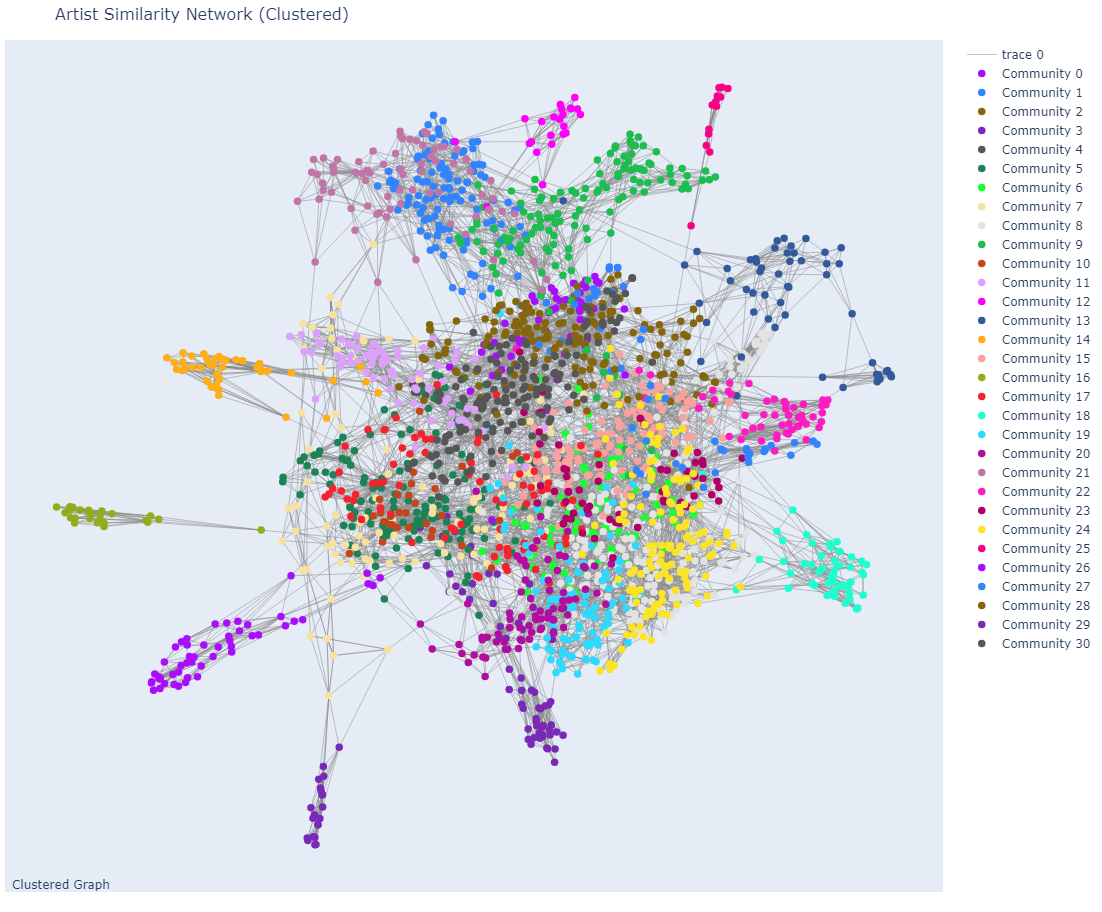
- **Visualization**: Functions to draw the network using NetworkX and Plotly.
### Usage
1. Instantiate the `Graph` class.
2. Parse artist and similarity data using `parse_artist_txt` and `parse_sim_artist_txt` methods.
3. Build the network and visualize it using various methods provided in the script.
4. Explore network metrics such as node degrees, furthest connectivity, and shortest paths.
### Example Usage
```python
from SAS_networkx import Graph
# Instantiate Graph
graph = Graph()
# Parse artist and similarity data
graph.parse_artist_txt("dataset-artist-similarity/LastFM/mb2uri_lastfmapi.txt")
graph.parse_sim_artist_txt("dataset-artist-similarity/LastFM/lastfmapi_gold.txt", num_similar=5)
# Build and visualize the network
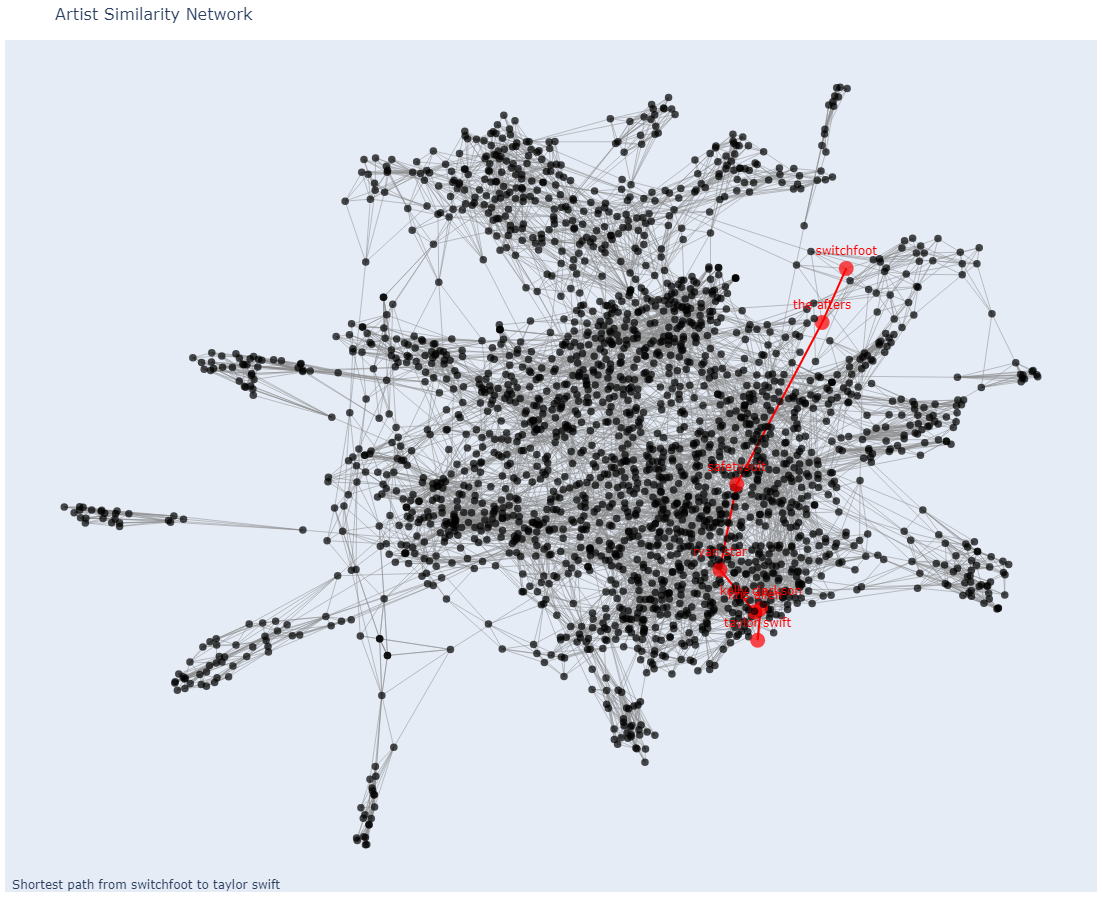
graph.add_networkx_depth('switchfoot', loops=6)
graph.draw_networkx_node(True)
# Find furthest connectivity and shortest paths
furthest_nodes, max_connectivity = graph.find_nodes_with_furthest_connectivity()
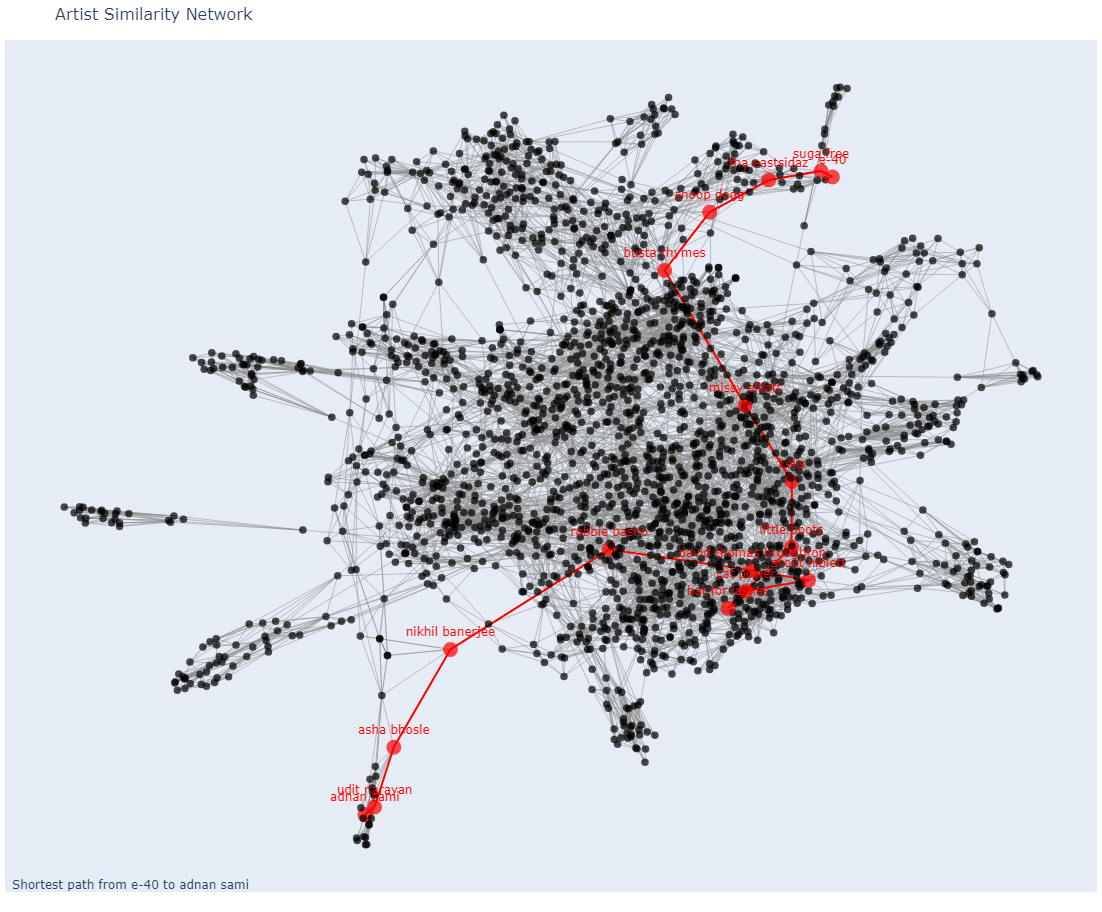
shortest_path = graph.shortest_path('adnan sami', 'e-40')
# Visualize shortest path and full network using NetworkX and Plotly
graph.visualize_shortest_path('adnan sami', 'e-40')
graph.draw_plotly_network(path=shortest_path)
```
For detailed usage and additional functionalities, refer to the comments and docstrings within `SAS_networkx.py`.
### Example Plots
## SAS_D3.html
This HTML file (`SAS_D3.html`) provides a visualization of the artist similarity network using D3.js. It loads data asynchronously, creates nodes and edges, and allows for interactive exploration of the network.
### Usage
1. Open `SAS_D3.html` in a web browser.
2. Use the search box to find nodes by name.
3. Click on nodes to highlight them.