https://github.com/sarvamm/datars-ai
Automated data analysis powered by local LLMs
https://github.com/sarvamm/datars-ai
chatbot data-science data-visualization llms streamlit
Last synced: about 1 year ago
JSON representation
Automated data analysis powered by local LLMs
- Host: GitHub
- URL: https://github.com/sarvamm/datars-ai
- Owner: Sarvamm
- License: other
- Created: 2025-04-10T03:22:31.000Z (about 1 year ago)
- Default Branch: main
- Last Pushed: 2025-04-26T06:13:38.000Z (about 1 year ago)
- Last Synced: 2025-05-30T00:07:35.740Z (about 1 year ago)
- Topics: chatbot, data-science, data-visualization, llms, streamlit
- Language: Python
- Homepage:
- Size: 4.95 MB
- Stars: 2
- Watchers: 1
- Forks: 0
- Open Issues: 0
-
Metadata Files:
- Readme: README.md
- License: LICENSE
Awesome Lists containing this project
README
# DATARS – Automated Data Analysis
DATARS is a powerful and user-friendly Streamlit app that leverages local LLMs to understand, summarize, and visualize your dataset—all in a few clicks. Whether you're an analyst or a data science enthusiast, DATARS helps you interact with your data like never before.
---
## Features
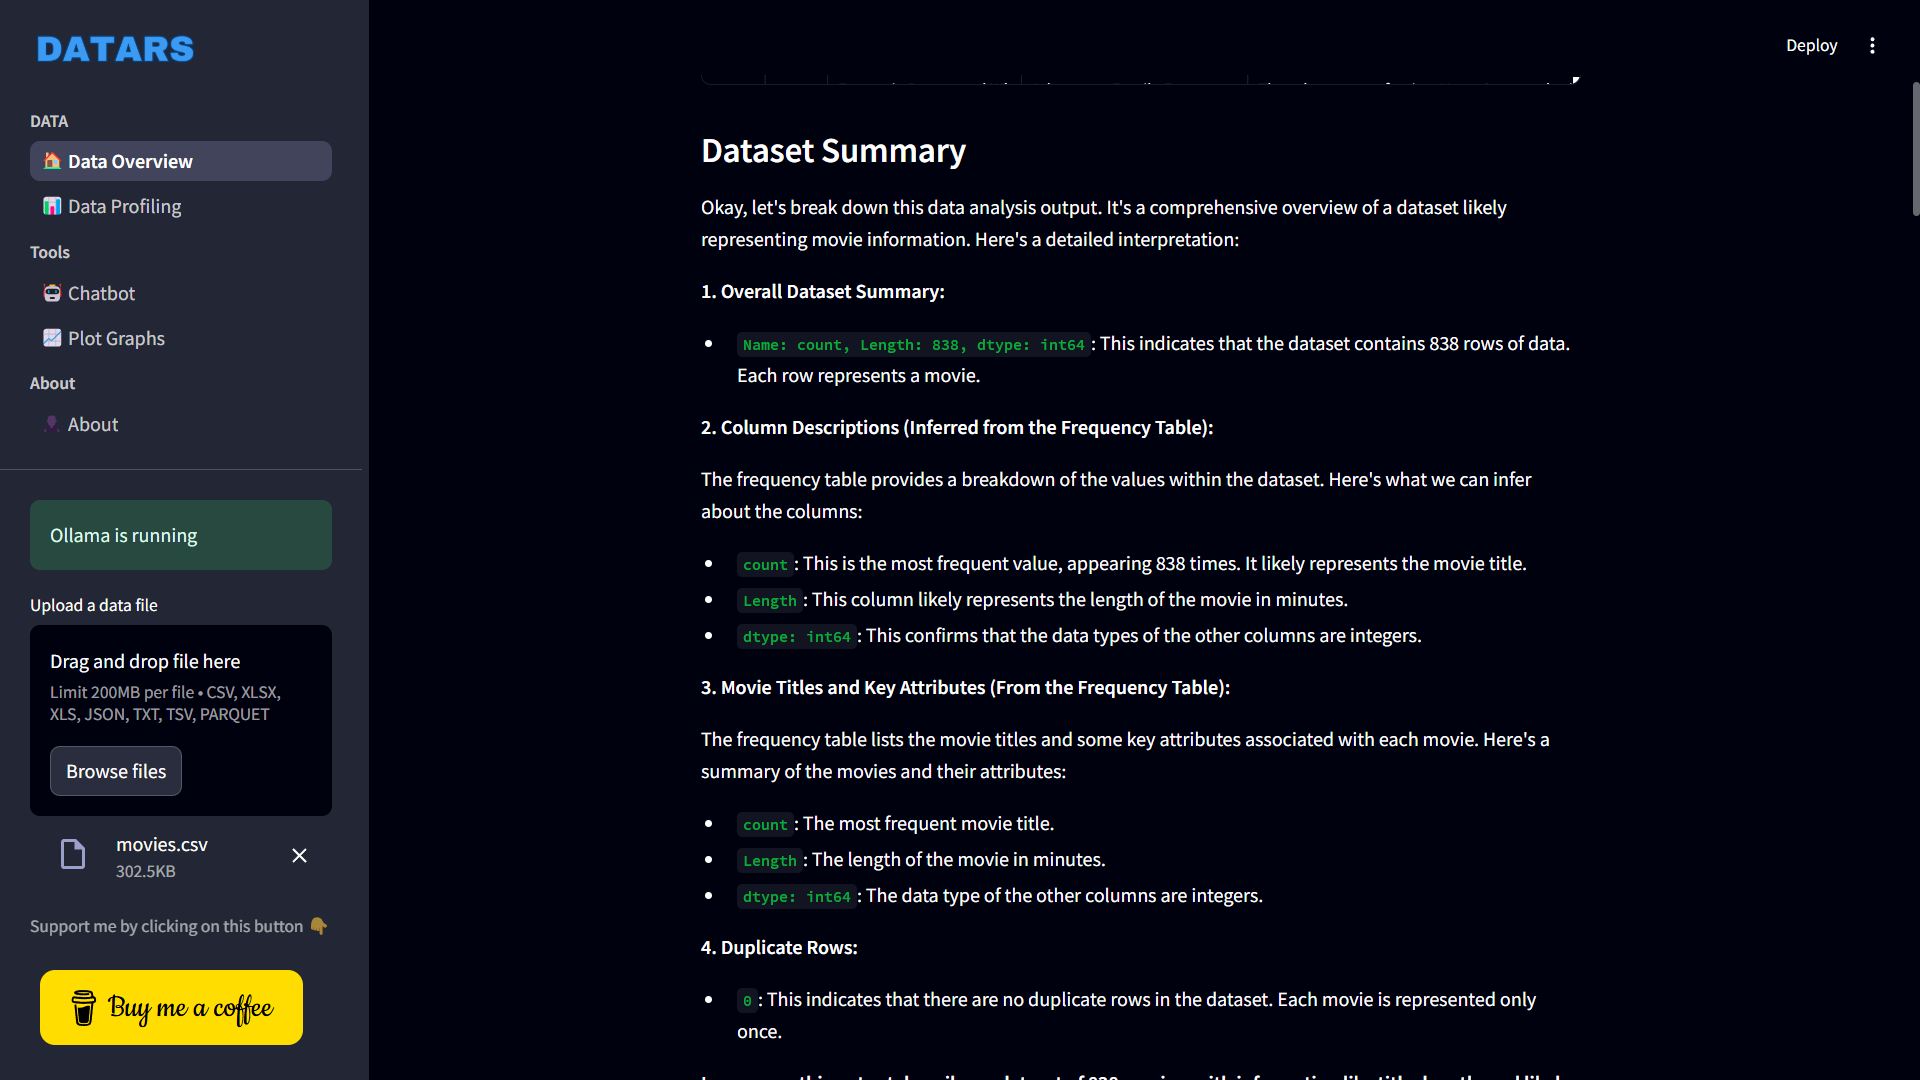
### 1. Data Overview Page
Harness the power of AI to:
- Summarize your dataset automatically
- Detect outliers
- Perform correlation analysis
- Recommend and generate suitable graphs using LLMs
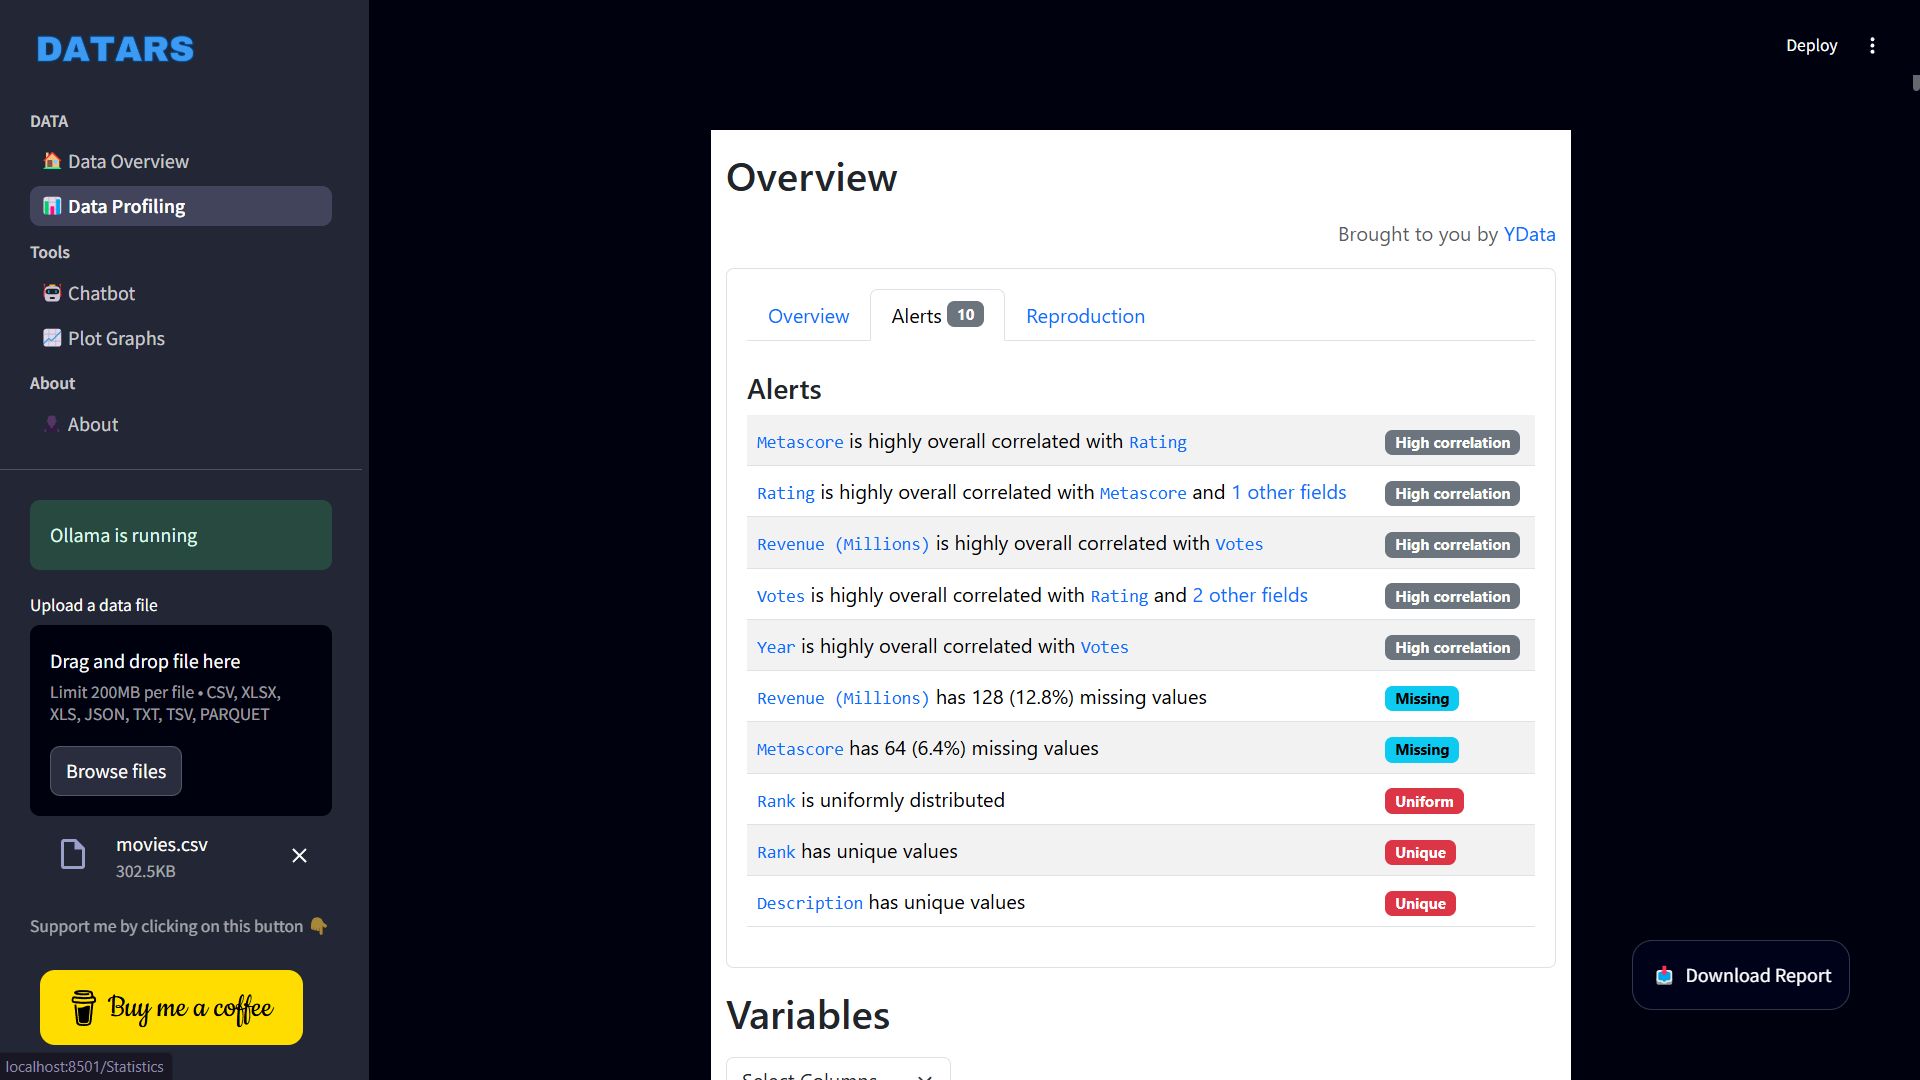
### 2. Data Profiling Page
Get a comprehensive EDA report powered by ydata_profiling, including:
- **Warnings**: Spot potential issues (missing values, skewness, etc.)
- **Univariate Analysis**: Summary stats (mean, median, mode) and histograms
- **Multivariate Analysis**: Correlation heatmaps, missing data patterns, duplicate detection, and pairwise relationships
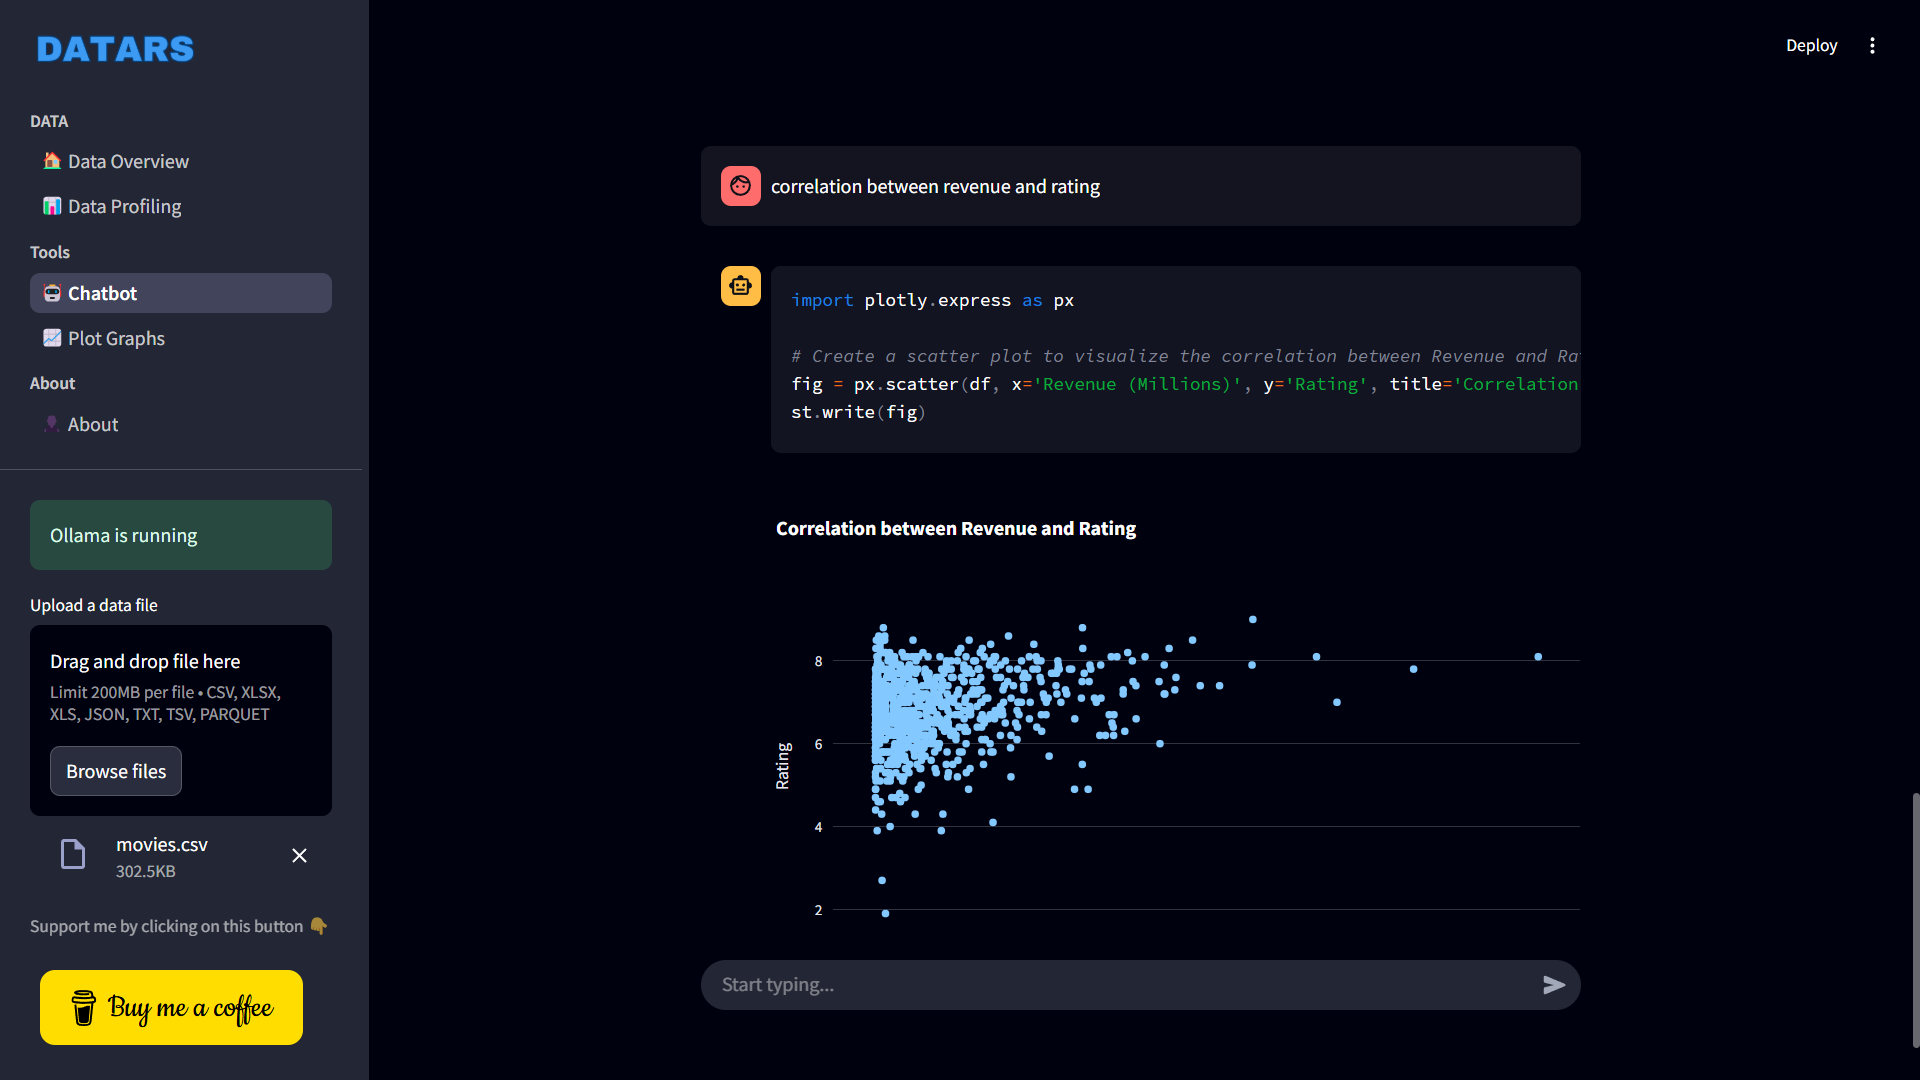
### 3. Chatbot
Type in natural language commands like:
> “Plot the distribution of column A”
> “Show mean values grouped by category”
> “Detect missing values”
LLM-backed chatbot will convert it into Python code, run it, and show you the result—instantly.
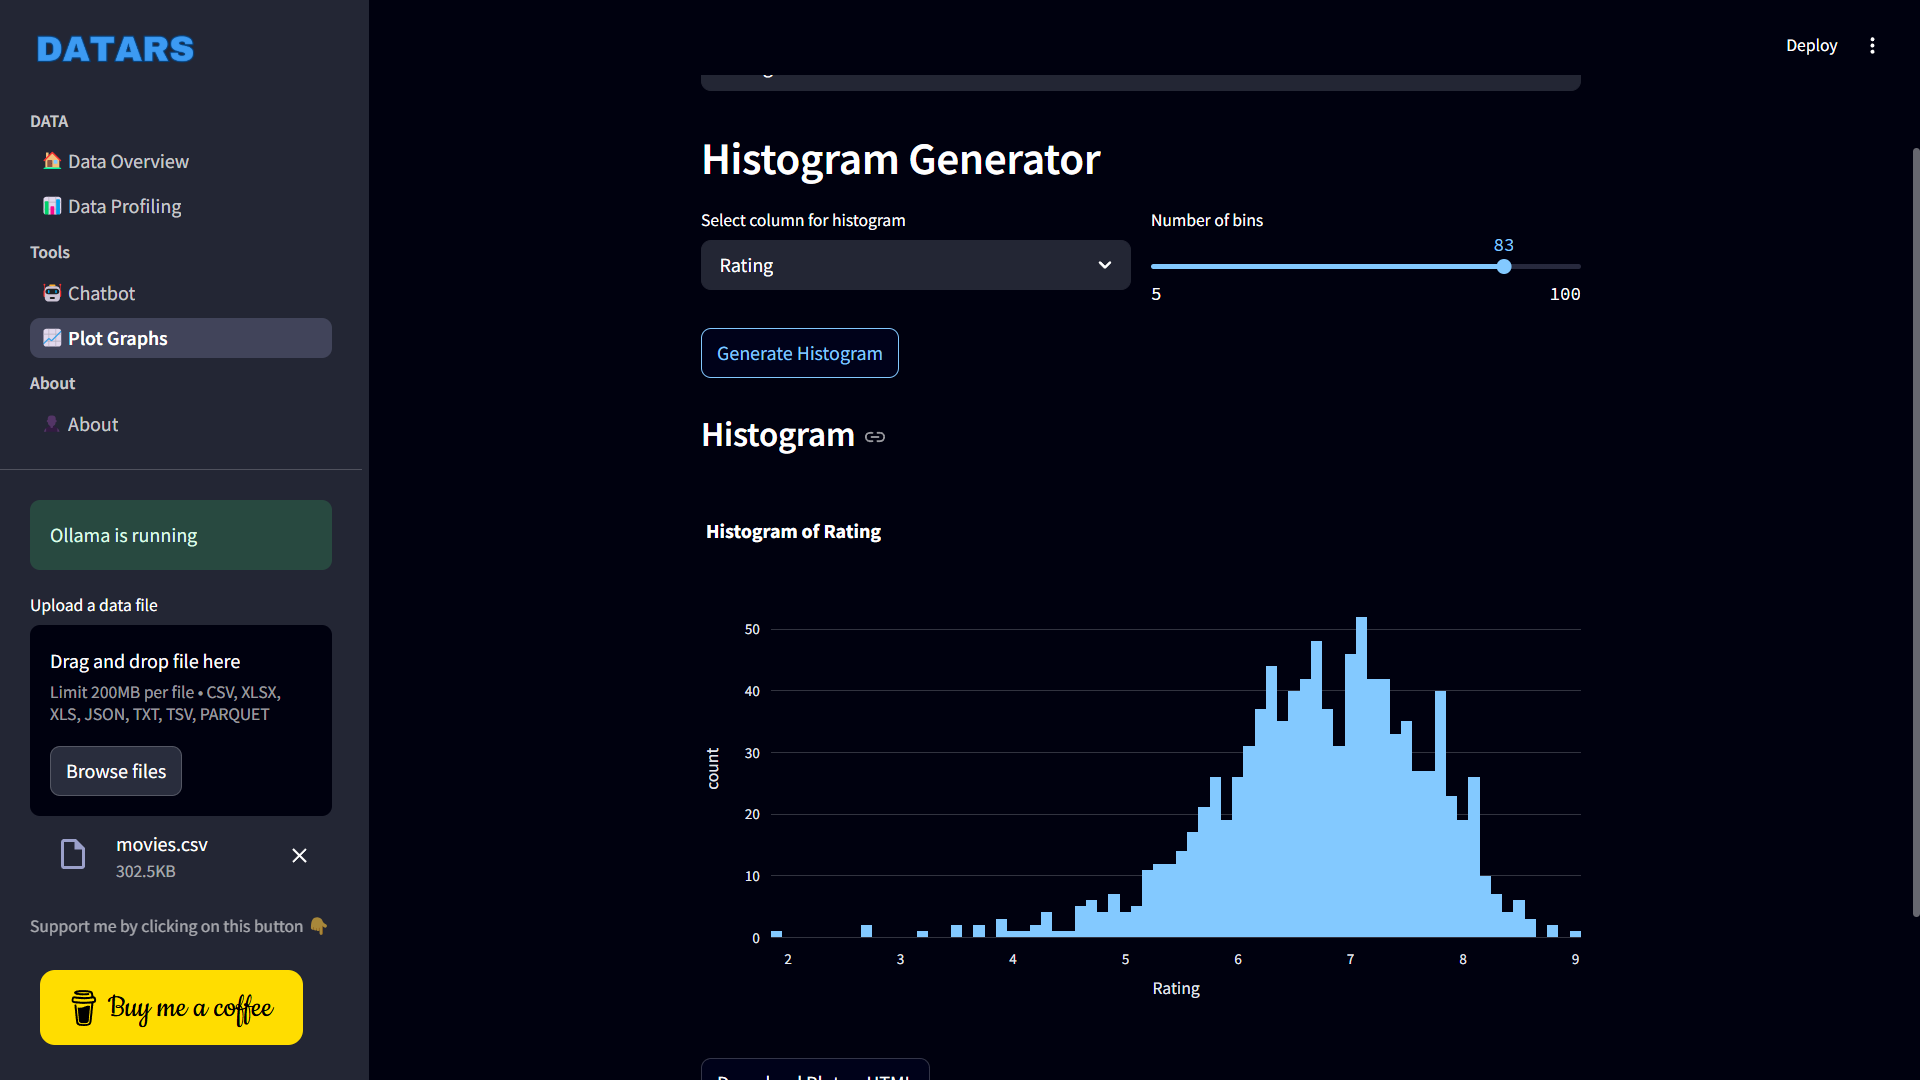
### 📈 4. Manual Graph Plotter
If you want to customize visualizations yourself, use the dedicated graph plotter to manually create a wide variety of plots.
---
## 🧰 Tech Stack & Libraries
- [Streamlit](https://streamlit.io/)
- [Ollama](https://ollama.com/)
- [Pandas](https://pandas.pydata.org/)
- [Matplotlib](https://matplotlib.org/)
- [Seaborn](https://seaborn.pydata.org/)
- [Plotly](https://plotly.com/python/)
- [YData Profiling](https://github.com/ydataai/ydata-profiling)
- [streamlit-extras](https://github.com/arnaudmiribel/streamlit-extras)
- [streamlit-pandas-profiling](https://github.com/pandas-profiling/pandas-profiling)
---
## Getting Started
### Installation
```bash
git clone https://github.com/sarvamm/DATARS-AI.git
cd DATARS-AI
pip install -r requirements.txt
```
### Set Up Ollama
Ensure Ollama and your preferred local LLM are installed and running.
By default gemma3 and qwen2.5-coder:7b are used so make sure you have them.
### Install Ollama
```bash
pip install ollama
```
### Install gemma3 and qwen2.5-coder:7b
```bash
ollama pull gemma3
```
```bash
ollama pull qwen2.5-coder:7b
```
---
## Run the App
```bash
streamlit run App.py
```
---
## Folder Structure
```
DATARS/
│
├── App.py # Main entry point
├── Functions.py # Helper functions
├── .streamlit/ # Config and secrets
├── pages/
│ ├── About.py
│ ├── Chatbot.py
│ ├── Graph_Plots.py
│ ├── Overview.py
│ └── Statistics.py
├── assets/ # Logo and media
├── outputs/ # Generated reports
├── requirements.txt
├── LICENSE
└── .gitignore
```
---
## 📬 Contact
🔗 [LinkedIn](https://www.linkedin.com/in/sarvamm) • [GitHub](https://github.com/sarvamm) • [Buy me a Coffee](https://buymeacoffee.com/astrayn)
---
## License
This project is licensed under the terms of the Non-Profit Open Software License version 3.0.