https://github.com/schiegl/quickplot
Quick and easy data visualizations with Haskell
https://github.com/schiegl/quickplot
data-visualization haskell visualization-library
Last synced: about 1 month ago
JSON representation
Quick and easy data visualizations with Haskell
- Host: GitHub
- URL: https://github.com/schiegl/quickplot
- Owner: schiegl
- License: gpl-3.0
- Created: 2016-02-08T16:36:59.000Z (almost 10 years ago)
- Default Branch: master
- Last Pushed: 2018-08-08T05:12:30.000Z (over 7 years ago)
- Last Synced: 2025-09-15T18:43:48.470Z (3 months ago)
- Topics: data-visualization, haskell, visualization-library
- Language: JavaScript
- Size: 5.58 MB
- Stars: 84
- Watchers: 12
- Forks: 11
- Open Issues: 8
-
Metadata Files:
- Readme: README.md
- License: LICENSE
Awesome Lists containing this project
README
# QuickPlot

**This project is no longer maintained**
Since the demand of data visualization has been getting bigger many language agnostic libraries popped up. It would be much more efficient to just write clients for their visualization servers.
How does it work?
----------------
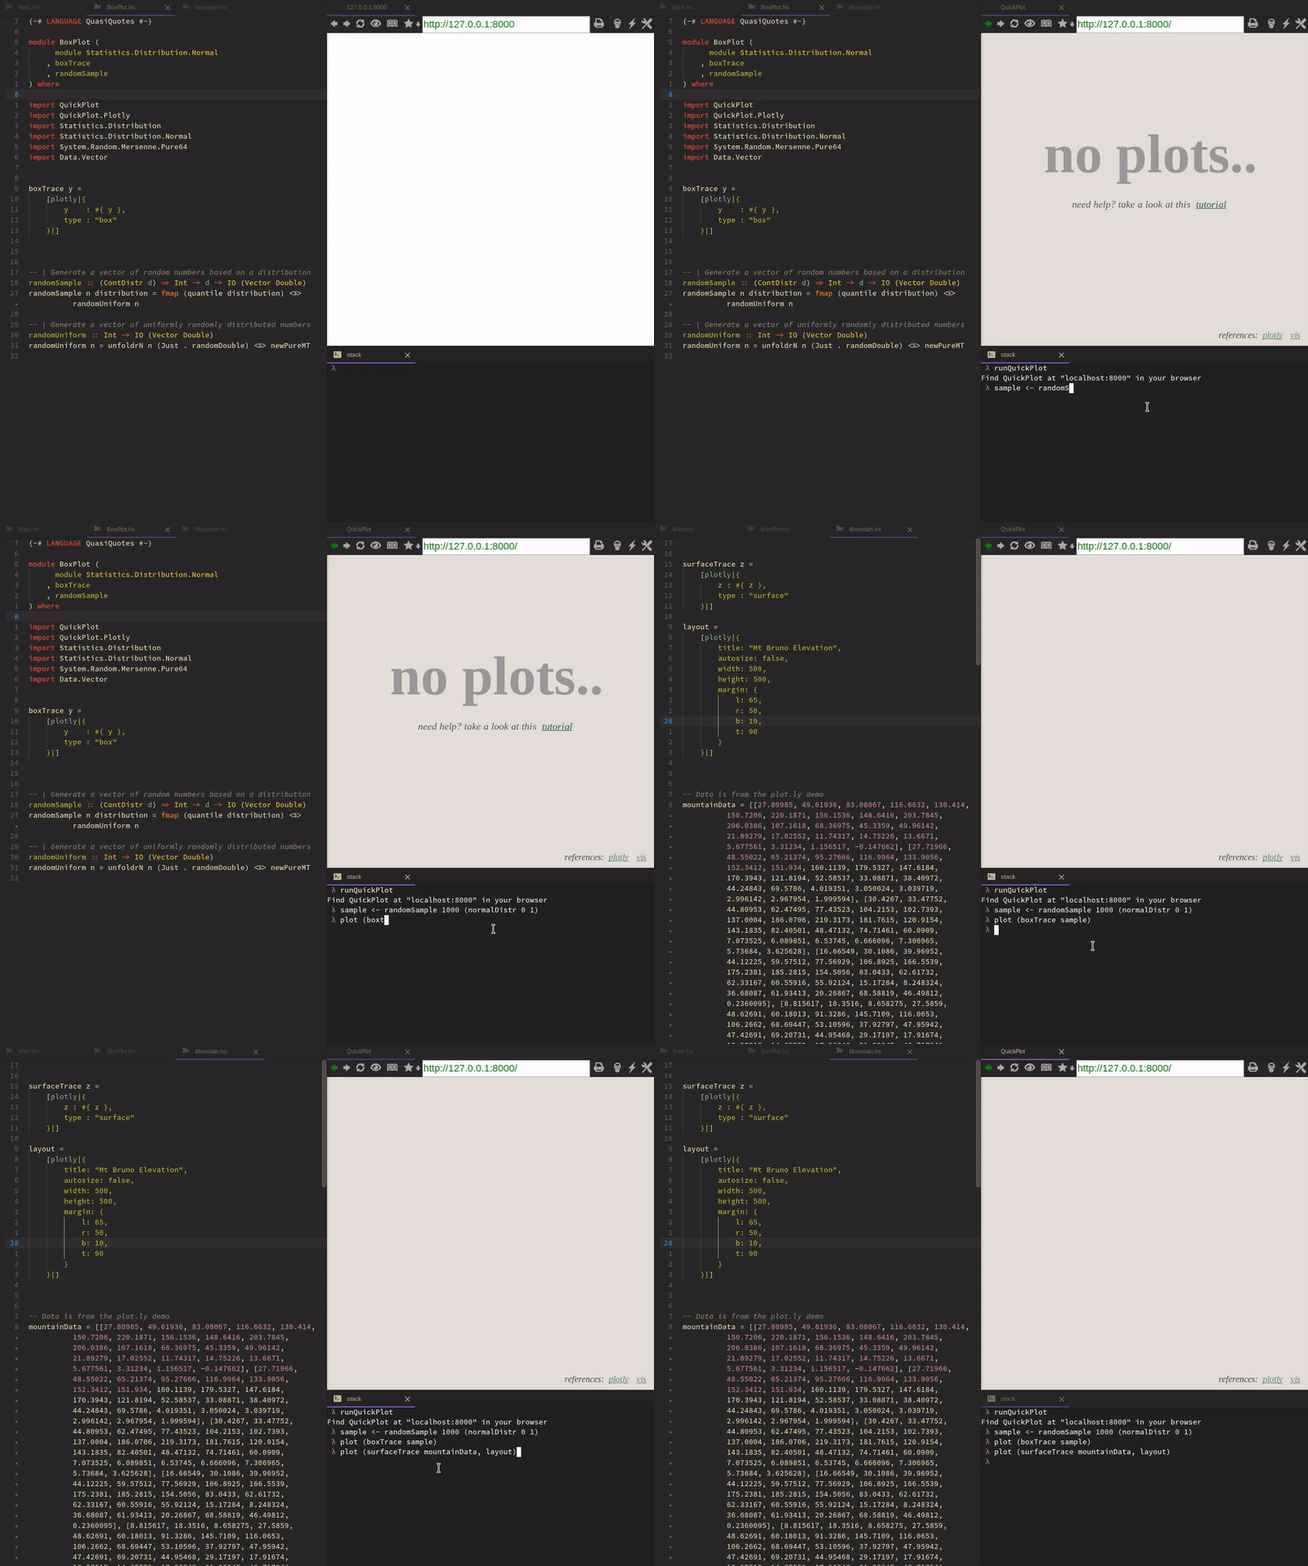
Haskell creates a simple server that runs in the background and sends data to a browser that visualizes it. In the demo above the browser and ghci runs inside [Atom](https://atom.io), but you can use any editor (even [butterflies](https://xkcd.com/378/)) with a fairly modern browser. Once the data arrives at the browser any JavaScript visualization library could take care of it like for example [plot.ly](https://plot.ly/javascript/)
How do I use it?
----------------
QuickPlot was designed to make interactive data exploration easier. So the following won't make much sense outside of ghci
**0. Install QuickPlot**
````haskell
stack install QuickPlot
cabal install QuickPlot
-- or manually
````
**1. Import QuickPlot**
````haskell
import QuickPlot
import QuickPlot.Plotly -- if you want to use the plotly library
````
**2. Start QuickPlot**
````haskell
runQuickPlot
````
**3. Connect to QuickPlot**
Go to the address `runQuickPlot` printed
**4. Plot**
Here is the less verbose version of the [full example](https://github.com/tepf/QuickPlot/blob/master/examples/BasicPlotting.lhs):
````haskell
-- As box aficionados we just measured the weight of all our boxes at home
-- and gathered the following data
blueBoxSizes = [1.1, 1.8, 2.9, 3.3] :: [Double]
orangeBoxSizes = [3.1, 3.8, 5.9, 2.3] :: [Double]
-- We create traces from our data
blueBoxTrace = [plotly|{
y : #{ blueBoxSizes },
type : "box"
}|]
orangeBoxTrace = [plotly|{
y : #{ orangeBoxSizes },
type : "box"
}|]
-- And finally gain great insight from the data visualization
plot [blueBoxTrace, orangeBoxTrace]
````
FAQ
---
#### Does it work on X?
Probably yes. If your browser supports WebSockets, HTML5, CSS3 you'll be fine. If not please update your browser. Find out more about [here](http://caniuse.com/)
#### Can you implement library X?
If the library takes JSON as an input, submit an issue. Libraries like [D3.js](https://d3js.org) are problematic however. Graphs in D3 are created programatically and therefore you can't just pick a graph type and say plot it. You have to create them from scratch. If there are examples that give you goosebumps it is possible to integrate them separately. Or you just include it as a user script yourself (once this is implemented)
#### How can I help?
There are many ways to do so:
- If you know JavaScript/HTML/CSS you could make the UI prettier, more user friendly or easier extensible
- Implement a visualization library in JavaScript
#### Can this library only use JavaScript libraries?
Technically any library that Haskell can convice to create graphics is compatible.