https://github.com/sdr-enthusiasts/docker-adsb-ultrafeeder
ADSB-Ultrafeeder is an all-in-one ADSB container with readsb, tar1090, graphs1090, autogain, multi-feeder, and mlat-hub built in
https://github.com/sdr-enthusiasts/docker-adsb-ultrafeeder
Last synced: 11 days ago
JSON representation
ADSB-Ultrafeeder is an all-in-one ADSB container with readsb, tar1090, graphs1090, autogain, multi-feeder, and mlat-hub built in
- Host: GitHub
- URL: https://github.com/sdr-enthusiasts/docker-adsb-ultrafeeder
- Owner: sdr-enthusiasts
- License: gpl-3.0
- Created: 2023-03-21T09:28:30.000Z (about 2 years ago)
- Default Branch: main
- Last Pushed: 2025-04-08T19:25:12.000Z (14 days ago)
- Last Synced: 2025-04-12T06:18:16.530Z (11 days ago)
- Language: Shell
- Homepage:
- Size: 705 KB
- Stars: 255
- Watchers: 10
- Forks: 37
- Open Issues: 0
-
Metadata Files:
- Readme: README-grafana.md
- License: LICENSE
Awesome Lists containing this project
- awesome-adsb - sdr-enthusiasts/docker-adsb-ultrafeeder - All-in-one ADSB container with readsb, tar1090, graphs1090, autogain, multi-feeder, and mlat-hub built in. (Software / Feeding)
README
# Using Ultrafeeder with Grafana and Prometheus
- [Using Ultrafeeder with Grafana and Prometheus](#using-ultrafeeder-with-grafana-and-prometheus)
- [Introduction](#introduction)
- [Ultrafeeder Image Tag](#ultrafeeder-image-tag)
- [Hardware requirements](#hardware-requirements)
- [Steps to install Prometheus, Grafana, and the Grafana Dashboard](#steps-to-install-prometheus-grafana-and-the-grafana-dashboard)
- [Step 1: Make Prometheus data available for the Ultrafeeder](#step-1-make-prometheus-data-available-for-the-ultrafeeder)
- [Step 2: create a container stack for `prometheus` and `grafana`](#step-2-create-a-container-stack-for-prometheus-and-grafana)
- [Step 3: Configuring Prometheus](#step-3-configuring-prometheus)
- [Prometheus scraping of `ultrafeeder`](#prometheus-scraping-of-ultrafeeder)
- [Prometheus scraping of `dump978`](#prometheus-scraping-of-dump978)
- [Accessing Prometheus and Grafana via your browser](#accessing-prometheus-and-grafana-via-your-browser)
- [Configuring data source and dashboard in Grafana](#configuring-data-source-and-dashboard-in-grafana)
- [Making the feeder's heatmap and graphs pages available in Grafana](#making-the-feeders-heatmap-and-graphs-pages-available-in-grafana)
- [Advanced Configuration: support for dashboards for multiple ultrafeeder instances](#advanced-configuration-support-for-dashboards-for-multiple-ultrafeeder-instances)
- [Step 1: Edit your Prometheus config file so the `job_name`s look like this](#step-1-edit-your-prometheus-config-file-so-the-job_names-look-like-this)
- [Step 2: Change your initial Grafana dashboard to use the new job name](#step-2-change-your-initial-grafana-dashboard-to-use-the-new-job-name)
- [Step 3: Clone the dashboard and repoint it at your second `ultrafeeder` instance](#step-3-clone-the-dashboard-and-repoint-it-at-your-second-ultrafeeder-instance)
## Introduction
[`Grafana`](https://grafana.com/) is an analytics platform that can provide alternative graphs for `readsb`.
In this guide we will be using [`Prometheus`](https://prometheus.io/) as the data repository.
Using Grafana and Prometheus in this configuration does not require a plan, account, or credentials for their respective cloud offerings.
## Ultrafeeder Image Tag
When using the `:telegraf` tag, the image contains [Telegraf](https://docs.influxdata.com/telegraf/), which can be used to capture metrics from `readsb` if an output is enabled.
**NOTE - READ CAREFULLY**: As of 27 April 2023, the `latest` image no longer contains Telegraf. If you want to send metrics to InfluxDB or Prometheus, please use the `:telegraf` tag like this in your `docker-compose.yml` file:
```yaml
services:
ultrafeeder:
image: ghcr.io/sdr-enthusiasts/docker-adsb-ultrafeeder:telegraf
...
```
## Hardware requirements
Prometheus will store a lot of data, and Grafana will do a lot of data queries. As a result, it would be better if you run these containers on a different system than your feeder Raspberry Pi. This will leave your Pi focused on data collection and processing, and unbothered by the CPU and Disk IO load that Prometheus/Grafana will cause.
You _can_ do it on a single system. We're assuming below that you are not. If you do it on a single system, then you can combine the `docker-compose.yml` components in a single file
## Steps to install Prometheus, Grafana, and the Grafana Dashboard
### Step 1: Make Prometheus data available for the Ultrafeeder
- Edit your Ultrafeeder's `docker-compose.yml` file and ensure that the following is set for the `ultrafeeder` service:
```yaml
environment:
- PROMETHEUS_ENABLE=true
- TAR1090_ENABLE_AC_DB=true
ports:
- 9273-9274:9273-9274
```
Now recreate the ultrafeeder container (`docker-compose up -d ultrafeeder`) and it will generate Prometheus data.
### Step 2: create a container stack for `prometheus` and `grafana`
On the machine where you will run Prometheus and Grafana, create a docker-compose file in the `/opt/grafana` directory:
```bash
sudo mkdir -p -m777 /opt/grafana/grafana/appdata /opt/grafana/prometheus/config /opt/grafana/prometheus/data
cd /opt/grafana
cat > docker-compose.yml
```
Now paste in the following text \*):
<‐‐ Click the arrow to see the docker-compose.yml text
```yaml
version: '3.9'
volumes:
grafana:
driver: local
driver_opts:
type: none
device: "/opt/grafana/grafana/appdata"
o: bind
prom-config:
driver: local
driver_opts:
type: none
device: "/opt/grafana/prometheus/config"
o: bind
prom-data:
driver: local
driver_opts:
type: none
device: "/opt/grafana/prometheus/data"
o: bind
services:
grafana:
image: grafana/grafana-oss:latest
restart: unless-stopped
container_name: grafana
hostname: grafana
# uncomment the following section and set the variables if you are exposing Grafana to the internet behind a rev web proxy:
environment:
# windrose panel plugin is needed for polar plots:
- GF_INSTALL_PLUGINS=snuids-radar-panel,fatcloud-windrose-panel
# uncomment and set the following variables if you are exposing Grafana to the internet behind a rev web proxy:
# - GF_SERVER_ROOT_URL=https://mywebsite.com/grafana/
# - GF_SERVER_SERVE_FROM_SUB_PATH=true
# The following variables are needed if you want to expose and embed any dashboards publicly:
- GF_AUTH_ANONYMOUS_ENABLED=true
- GF_AUTH_ANONYMOUS_ORG_NAME=public
- GF_SECURITY_ALLOW_EMBEDDING=true
- GF_PANELS_DISABLE_SANITIZE_HTML=true
- GF_FEATURE_TOGGLES_ENABLE=publicDashboards
# The following variables will allow you to "share/render" dashboards as PNG graphics.
# You should also enabled the renderer container below.
- GF_RENDERING_SERVER_URL=http://renderer:8081/render
- GF_RENDERING_CALLBACK_URL=http://grafana:3000/
- GF_LOG_FILTERS=rendering:debug
ports:
- 3000:3000
volumes:
- grafana:/var/lib/grafana
# The `renderer` container is needed if you want to share images of your dashboard as a graphic:
renderer:
image: grafana/grafana-image-renderer:latest
prometheus:
image: prom/prometheus
container_name: prometheus
hostname: prometheus
restart: unless-stopped
tmpfs:
- /tmp
volumes:
- prom-config:/etc/prometheus
- prom-data:/prometheus
ports:
- 9090:9090
```
\*) The volume definition structure is written this way purposely to ensure that the containers can place files in the persistent directories. Do not try to "directly" map volumes (`/opt/grafana/grafana/appdata:/var/lib/grafana`).
You should be able to see the following directories:
- `/opt/grafana/grafana/appdata`
- `/opt/grafana/prometheus/config`
- `/opt/grafana/prometheus/data`
Download and create Grafana and Prometheus for the first time with this command:
```bash
docker compose up -d
```
### Step 3: Configuring Prometheus
#### Prometheus scraping of `ultrafeeder`
Prometheus needs to be told where to look for the data from the ultrafeeder. We will create a target prometheus configuration file that does this, please copy and paste the following. Make sure to replace `ip_xxxxxxx` with the IP address or hostname of the machine where `ultrafeeder` is running:
```bash
docker exec -it prometheus sh -c "echo -e \" - job_name: 'ultrafeeder'\n static_configs:\n - targets: ['ip_xxxxxxx:9273', 'ip_xxxxxxx:9274']\" >> /etc/prometheus/prometheus.yml"
docker stop prometheus
docker compose up -d
```
This will add the following to the bottom of the `prometheus.yml` file:
```yaml
- job_name: "ultrafeeder"
static_configs:
- targets: ["ip_xxxxxxx:9273", "ip_xxxxxxx:9274"]
```
(If you screw this up, **do NOT** re-run the command. Instead, try `sudo nano /opt/grafana/prometheus/config/prometheus.yml` and fix it that way.)
#### Prometheus scraping of `dump978`
If you are using the `docker-dump978` container to receive UAT data (USA only!), you can add a Prometheus scraper for this also needs to be told where to look for the data from the ultrafeeder. We add a target to the prometheus configuration file to do this. Please copy and paste the following. Make sure to replace `ip_xxxxxxx` with the IP address or hostname of the machine where `dump978` is running:
```bash
docker exec -it prometheus sh -c "echo -e \" - job_name: 'dump978'\n static_configs:\n - targets: ['ip_xxxxxxx:9273']\" >> /etc/prometheus/prometheus.yml"
docker stop prometheus
docker compose up -d
```
This will add the following to the bottom of the `prometheus.yml` file:
```yaml
- job_name: "dump978"
static_configs:
- targets: ["ip_xxxxxxx:9273"]
```
(If you screw this up, **do NOT** re-run the command. Instead, try `sudo nano /opt/grafana/prometheus/config/prometheus.yml` and fix it that way.)
### Accessing Prometheus and Grafana via your browser
You should be able to point your web browser at:
- `http://docker.host.ip.addr:9090/` to access the `prometheus` console.
- `http://docker.host.ip.addr:3000/` to access the `grafana` console, use admin/admin as initial credentials, you should be prompted to change the password on first login.
Remember to change `docker.host.ip.addr` to the IP address of your docker host.
### Configuring data source and dashboard in Grafana
After you have logged into the `grafana` console the following manual steps are required to connect to `prometheus` as the data source
1. Click `Add your first data source` in the main panel
2. Click `Prometheus` from the list of options provided
3. Input or select the following options, if the option is not listed, do not input anything for that option:
| Option | Input |
| ------ | ------------------------- |
| Name | ultrafeeder |
| URL | `http://prometheus:9090/` |
Clicking `Save & Test` should return a green message indicating success. The dashboard can now be imported with the following steps:
1. Click the `+` icon at the top right and select `Import dashboard`
2. Enter `18398` into the `Find and import dashboards` section and click `Load`
3. Select `ultrafeeder` from the bottom drop down list under `Prometheus`
4. Click `Import` at the bottom
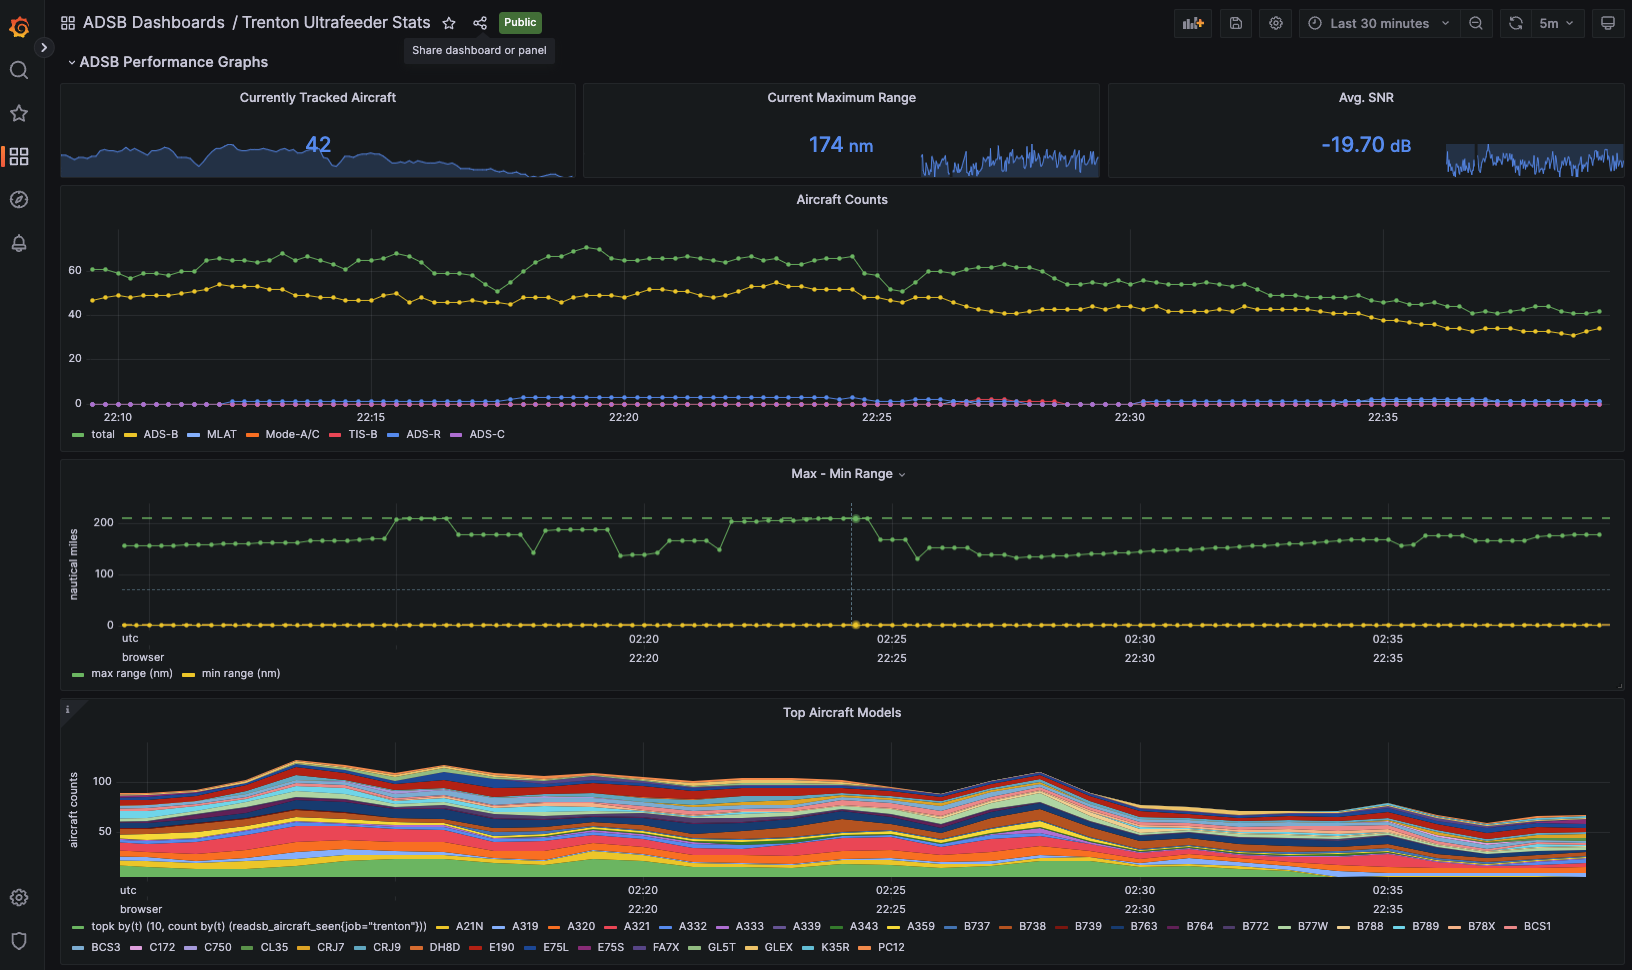
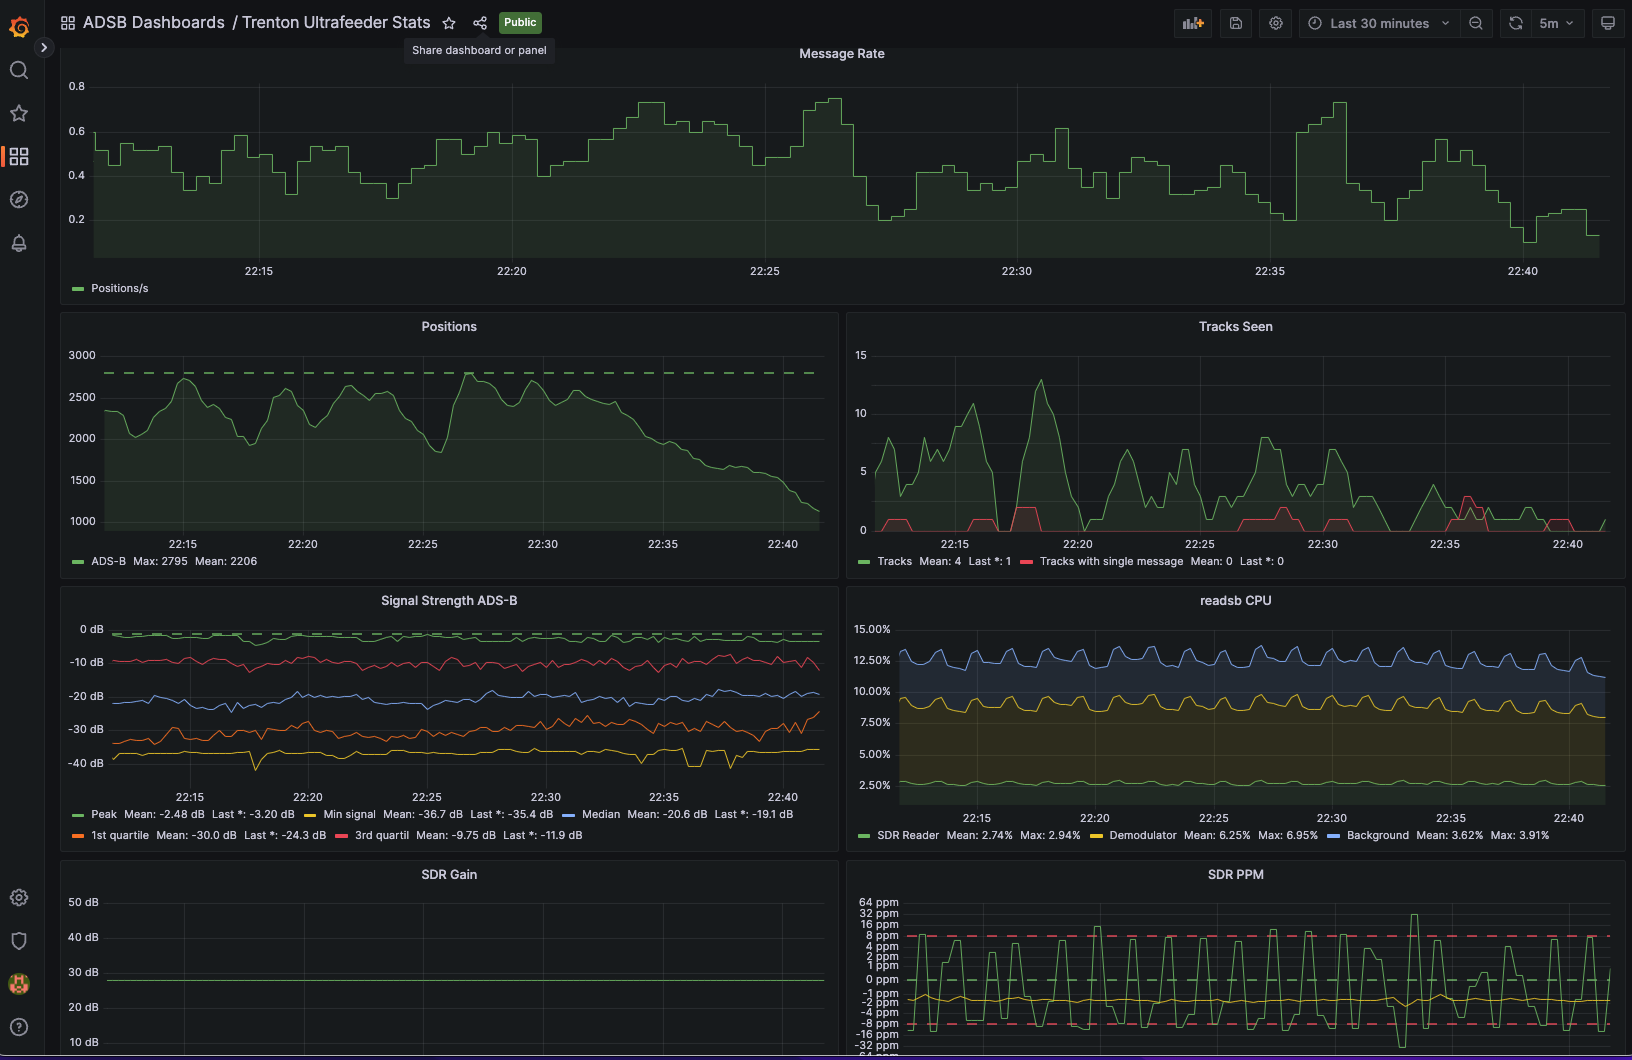
At this point you should see a very nice dashboard, you can find it under `General` in the `Dashboards` section.
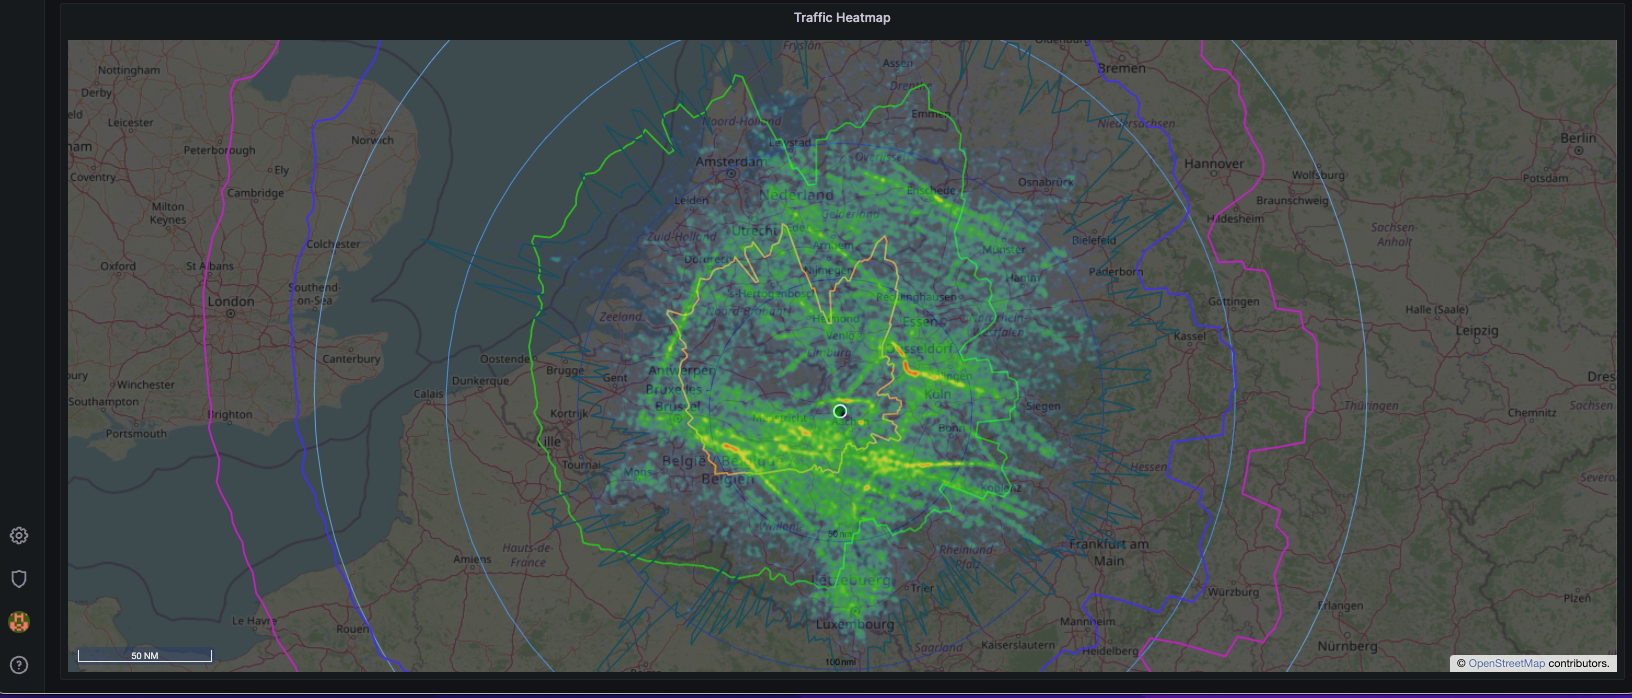
### Making the feeder's heatmap and graphs pages available in Grafana
The dashboard comes preconfigured with panels that show the tar1090 heatmap and graphs1090 stats pages. These panels need to be configured to look for this data at the correct URL.
Note that these URLs need to be accessible from the browser that you use to see the Grafana dashboard - they should work if you enter them in your browser's URL box.
If you don't have access to these URLs, it'd be safe to simply delete these panels from your dashboard.
- Step a: Log into Grafana and open the Ultrafeeder dashboard that you already created
- Step b: Click on the cogwheel (`Dashboard Settings`) in the top of the screen
- Step c: Choose `JSON Model` from the tabs under `Settings` and click anywhere in the JSON text
- Step d. Press CTRL-F (Window/Linux) or CMD-F (Mac) and click the `>` icon to show Find and Replace:
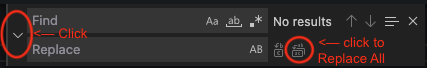
- Step e: Find all (2) instances of `feeder_url` and replace them with the IP or hostname of your graphs1090 map URL (eg. `adsb.local:8080`)
- Step f: Click `Save changes` at the bottom of the JSON code section
- Step g: Press `Save dashboard` at the top right of the screen, followed by `Save` on the next screen
- Step h: Press ESC to go back to your dashboard
## Advanced Configuration: support for dashboards for multiple ultrafeeder instances
If you have multiple feeder stations with multiple instances of `ultrafeeder`, you can configure a dashboard for each of them. Here's how. In our example, we have two `ultrafeeder` instance called `heerlen` and `trenton`. You can adjust these names in accordance with your needs.
First execute all steps above, and then continue here.
### Step 1: Edit your Prometheus config file so the `job_name`s look like this
```yaml
- job_name: "heerlen"
static_configs:
- targets: ["10.0.0.100:9273", "10.0.0.100:9274"]
- job_name: "trenton"
static_configs:
- targets: ["10.0.0.101:9273", "10.0.0.101:9274"]
```
Here, `10.0.0.100` is the IP address of the `heerlen` station, and `10.0.0.101` is the IP address of the `trenton` station. Yours will be different. Please keep the ports as you mapped them for Ultrafeeder in each instance. You should have a `- job_name` block for each ultrafeeder instance.
You can remove the `ultrafeeder` section as it will probably be a duplicate of what you just created.
Once you are done editing, restart Prometheus (`docker restart prometheus`).
### Step 2: Change your initial Grafana dashboard to use the new job name
In the previous step, you replaced the `ultrafeeder` job name by two or more new names. Now, we need to create a copy of the dashboard for each of the job names and make sure they each use the data source from the correct `ultrafeeder` instance.
- Step 2a: Log into Grafana and open the Ultrafeeder dashboard that you already created
- Step 2b: Click on the cogwheel (`Dashboard Settings`) in the top of the screen
- Step 2c: Choose `JSON Model` from the tabs under `Settings` and click anywhere in the JSON text
- Step 2d. Press CTRL-F (Window/Linux) or CMD-F (Mac) and click the `>` icon to show Find and Replace:

- Step 2e: Find all instances of `job=\"ultrafeeder\"` and replace them with `job=\"heerlen\"` (or whatever name your first feeder has)
- Step 2f: Click `Save changes` at the bottom of the JSON code section
- Step 2g: Press `Save dashboard` at the top right of the screen, followed by `Save` on the next screen
- Step 2h: Press ESC to go back to your dashboard
Now your first Grafana dashboard gets its data from the your first `ultrafeeder` instance.
### Step 3: Clone the dashboard and repoint it at your second `ultrafeeder` instance
If you followed the steps above, you should be at your updated (first) dashboard. We'll now clone and adapt it for your second `ultrafeeder` instance:
- Step 3a: Press the `Share` icon (to the right of the star, next to the page title)
- Step 3b: Click the `Export` tab. Switch on `Export for sharing externally`
- Step 3c: Press `View JSON` and `Copy to Clipboard`
- Step 3d: `X` out of the popup box, leave the Dashboard, and go back to the `Browse Dashboards` page.
- Step 3e: Click `New` -> `Import`. Right-click in the `Import via panel json` box, and paste your clipboard. Press `Load`
- Step 3f: Change the `Name` and `uid` (pick anything you want), and select `Prometheus` as data source. IMPORTANT: if you do not change the `Name` and `uid`, it will overwrite your existing dashboard. CHANGE BOTH OF THEM! Then press `Import`
- Step 3g: You will see your new dashboard, but it's still getting data from your first one. Follow steps 2b - 2g above to change the data source from `heerlen` (or whatever you named it) to `trenton` (or whatever name you want to give to it)
Now you have 2 dashboards for 2 instances of Ultrafeeder!