https://github.com/sdr-enthusiasts/docker-shipfeeder
AIS feeder for ShipXplorer, VesselFinder, MarineTraffic, etc. based on AIS-Catcher. Multi-architecture (amd64, armhf, arm64)
https://github.com/sdr-enthusiasts/docker-shipfeeder
ais docker marinetraffic raspberry-pi sdr sdr-enthusiasts shipxplorer vesselfinder
Last synced: about 1 year ago
JSON representation
AIS feeder for ShipXplorer, VesselFinder, MarineTraffic, etc. based on AIS-Catcher. Multi-architecture (amd64, armhf, arm64)
- Host: GitHub
- URL: https://github.com/sdr-enthusiasts/docker-shipfeeder
- Owner: sdr-enthusiasts
- License: gpl-3.0
- Created: 2022-11-01T16:07:58.000Z (over 3 years ago)
- Default Branch: main
- Last Pushed: 2025-04-11T21:37:18.000Z (about 1 year ago)
- Last Synced: 2025-04-13T01:52:38.439Z (about 1 year ago)
- Topics: ais, docker, marinetraffic, raspberry-pi, sdr, sdr-enthusiasts, shipxplorer, vesselfinder
- Language: Shell
- Homepage:
- Size: 1.17 MB
- Stars: 53
- Watchers: 5
- Forks: 4
- Open Issues: 0
-
Metadata Files:
- Readme: README-grafana.md
- License: LICENSE
Awesome Lists containing this project
README
# Using ShipXplorer with Grafana and Prometheus
[`Grafana`](https://grafana.com/) is an analytics platform that can provide alternative graphs for `readsb`.
In this guide we will be using [`Prometheus`](https://prometheus.io/) as the data repository.
Using Grafana and Prometheus in this configuration does not require a plan, account, or credentials for their respective cloud offerings.
## Hardware requirements
Prometheus will store a lot of data, and Grafana will do a lot of data queries. As a result, it would be better if you run these containers on a different system than your feeder Raspberry Pi. This will leave your Pi focused on data collection and processing, and unbothered by the CPU and Disk IO load that Prometheus/Grafana will cause.
You *can* do it on a single system. We're assuming below that you are not. If you do it on a single system, then you can combine the `docker-compose.yml` components in a single file
## Step 1: Make Prometheus data available for the ShipXplorer
- Edit your ShipXplorer's `docker-compose.yml` file and ensure that the following is set for the `shipxplorer` service:
```yaml
environment:
- PROMETHEUS_ENABLE=true
ports:
- 9273:9273
```
Now recreate the ShipXplorer container (`docker-compose up -d shipxplorer`) and it will generate Prometheus data.
## Step 2: create a container stack for `prometheus` and `grafana`
You can skip this if you already have Prometheus and Grafana installed.
On the machine where you will run Prometheus and Grafana, create a docker-compose file in the `/opt/grafana` directory:
```bash
sudo mkdir -p -m777 /opt/grafana/grafana/appdata /opt/grafana/prometheus/config /opt/grafana/prometheus/data
cd /opt/grafana
cat > docker-compose.yml
```
Now paste in the following text *):
<‐‐ Click the arrow to see the docker-compose.yml text
```yaml
version: '3.9'
volumes:
grafana:
driver: local
driver_opts:
type: none
device: "/opt/grafana/grafana/appdata"
o: bind
prom-config:
driver: local
driver_opts:
type: none
device: "/opt/grafana/prometheus/config"
o: bind
prom-data:
driver: local
driver_opts:
type: none
device: "/opt/grafana/prometheus/data"
o: bind
services:
grafana:
image: grafana/grafana-oss:latest
restart: unless-stopped
container_name: grafana
hostname: grafana
# uncomment the following section and set the variables if you are exposing Grafana to the internet behind a rev web proxy:
environment:
# snuids-radar-panel plugin is needed for polar plots:
- GF_INSTALL_PLUGINS=snuids-radar-panel
# uncomment and set the following variables if you are exposing Grafana to the internet behind a rev web proxy:
# - GF_SERVER_ROOT_URL=https://mywebsite.com/grafana/
# - GF_SERVER_SERVE_FROM_SUB_PATH=true
ports:
- 3000:3000
volumes:
- grafana:/var/lib/grafana
prometheus:
image: prom/prometheus
container_name: prometheus
hostname: prometheus
restart: unless-stopped
tmpfs:
- /tmp
volumes:
- prom-config:/etc/prometheus
- prom-data:/prometheus
ports:
- 9090:9090
```
*) The volume definition structure is written this way purposely to ensure that the containers can place files in the persistent directories. Do not try to "directly" map volumes (`/opt/grafana/grafana/appdata:/var/lib/grafana`).
You should be able to see the following directories:
- `/opt/grafana/grafana/appdata`
- `/opt/grafana/prometheus/config`
- `/opt/grafana/prometheus/data`
Download and create Grafana and Prometheus for the first time with this command:
```bash
docker compose up -d
```
## Step 3: Configuring Prometheus
Prometheus needs to be told where to look for the data from the ShipXplorer. We will create a target prometheus configuration file that does this, please copy and paste the following. Make sure to replace `ip_of_ShipXplorer_machine:90` with the IP address or hostname of the machine and the web port where `shipxplorer` is running:
```bash
docker exec -it prometheus sh -c "echo -e \" - job_name: 'ais'\n static_configs:\n - targets: ['ip_of_ShipXplorer_machine:90']\" >> /etc/prometheus/prometheus.yml"
docker restart prometheus
```
(If you screw this up, **do NOT** re-run the command. Instead, try `sudo nano /opt/grafana/prometheus/config/prometheus.yml` and fix it that way.)
## Accessing Prometheus and Grafana via your browser
You should be able to point your web browser at:
- `http://docker.host.ip.addr:9090/` to access the `prometheus` console.
- `http://docker.host.ip.addr:3000/` to access the `grafana` console, use admin/admin as initial credentials, you should be prompted to change the password on first login.
Remember to change `docker.host.ip.addr` to the IP address of the machine where Prometheus and Grafana are located.
## Configuring data source and dashboard in Grafana
After you have logged into the `grafana` console the following manual steps are required to connect to `prometheus` as the data source. **You must do this** even if you are already connected to Prometheus for other purposes (such as for getting `readsb`/`ultrafeeder`/`tar1090` data)
1. In Grafana, click `Configuration` (cogwheel) -> `Data Sources`
2. Click `Add a new data source` in the main panel
3. Click `Prometheus` from the list of options provided
4. Input or select the following options, if the option is not listed, do not input anything for that option:
Option | Input
------------- | -------------
Name | `ais`
URL | `http://prometheus:9090/`
Clicking `Save & Test` should return a green message indicating success. The dashboard can now be imported with the following steps
1. Hover over the `four squares` icon in the sidebar, click `+ Import`
2. Enter `18417` into the `Import via grafana.com` section and click `Load`
3. Select `readsb` from the bottom drop down list
4. Click `Import` on the subsequent dialogue box
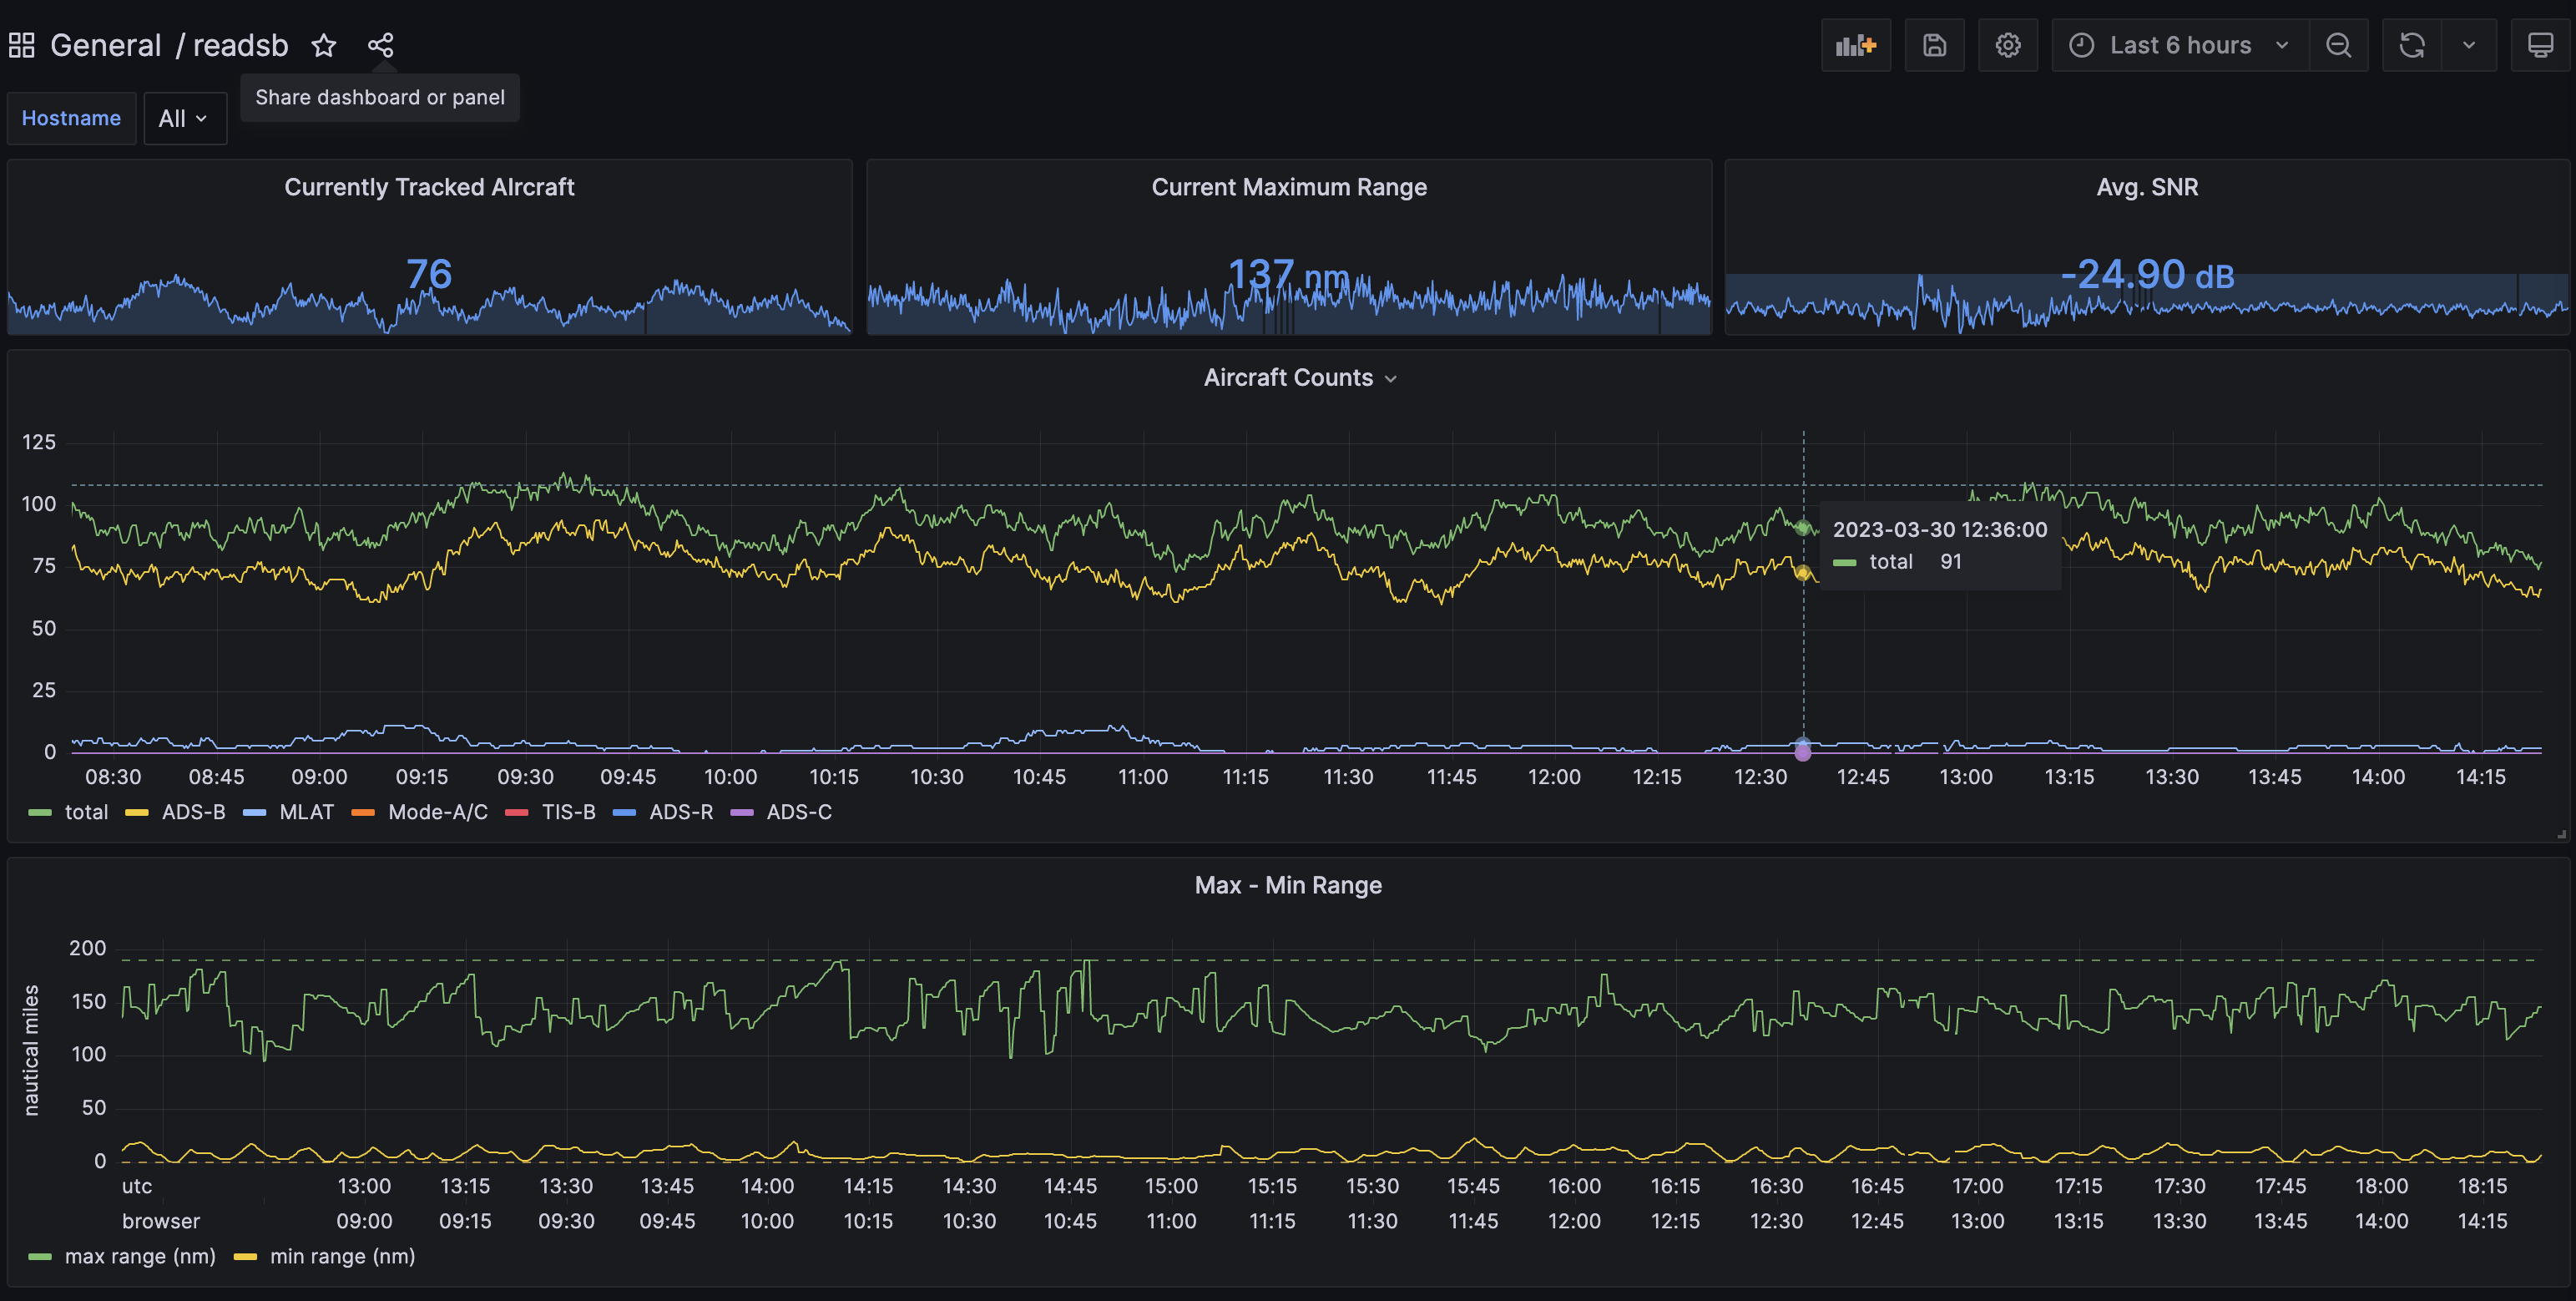
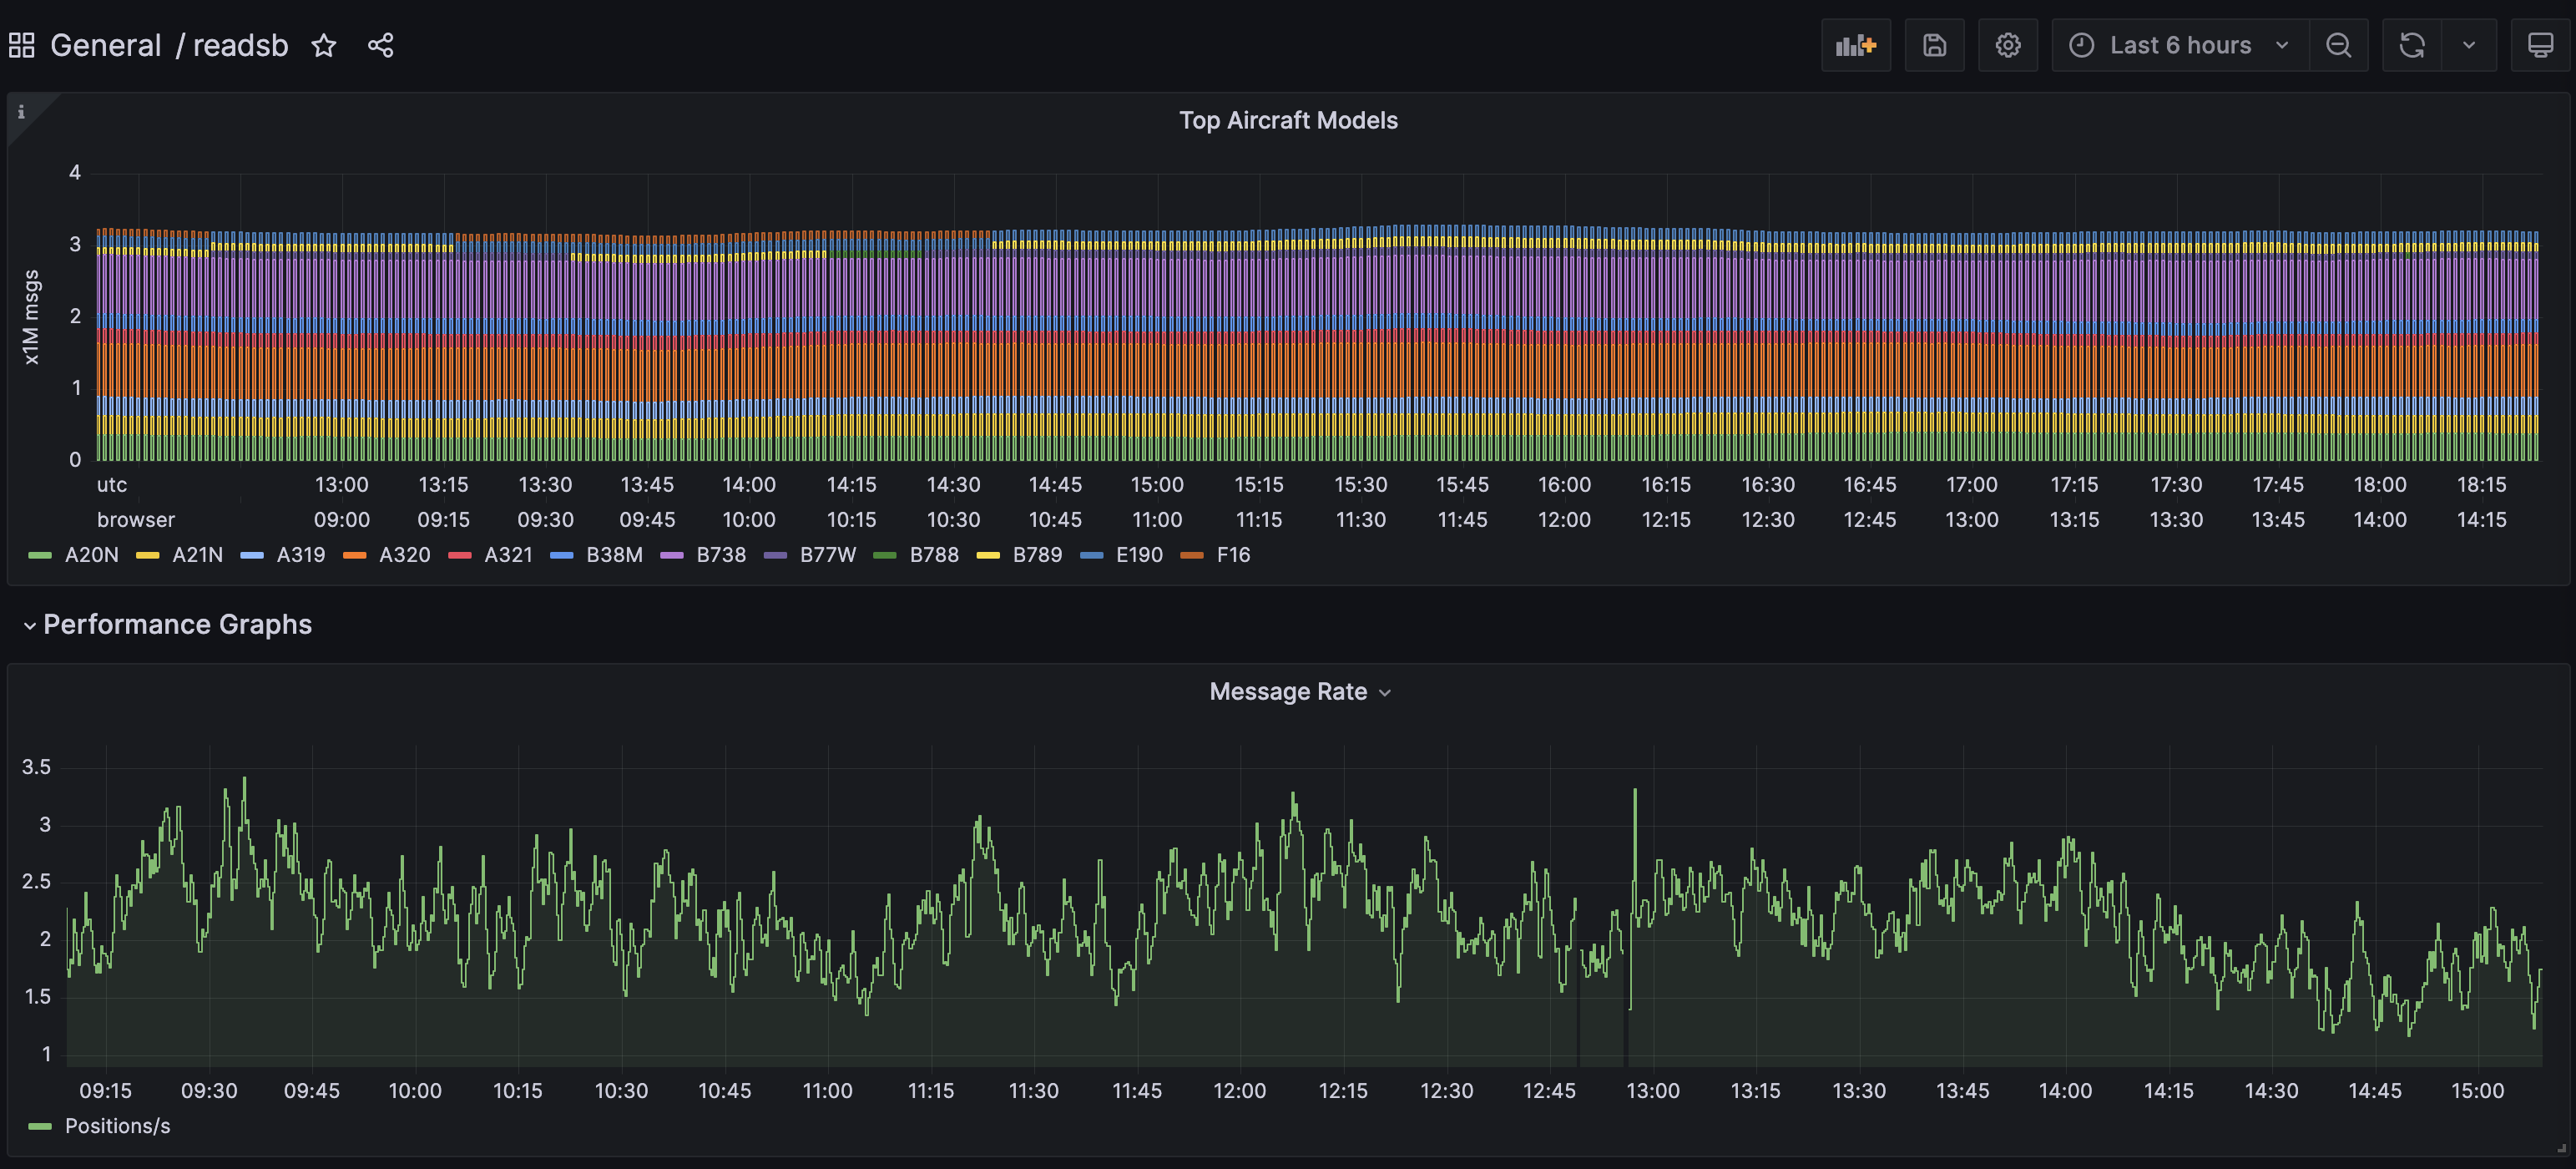
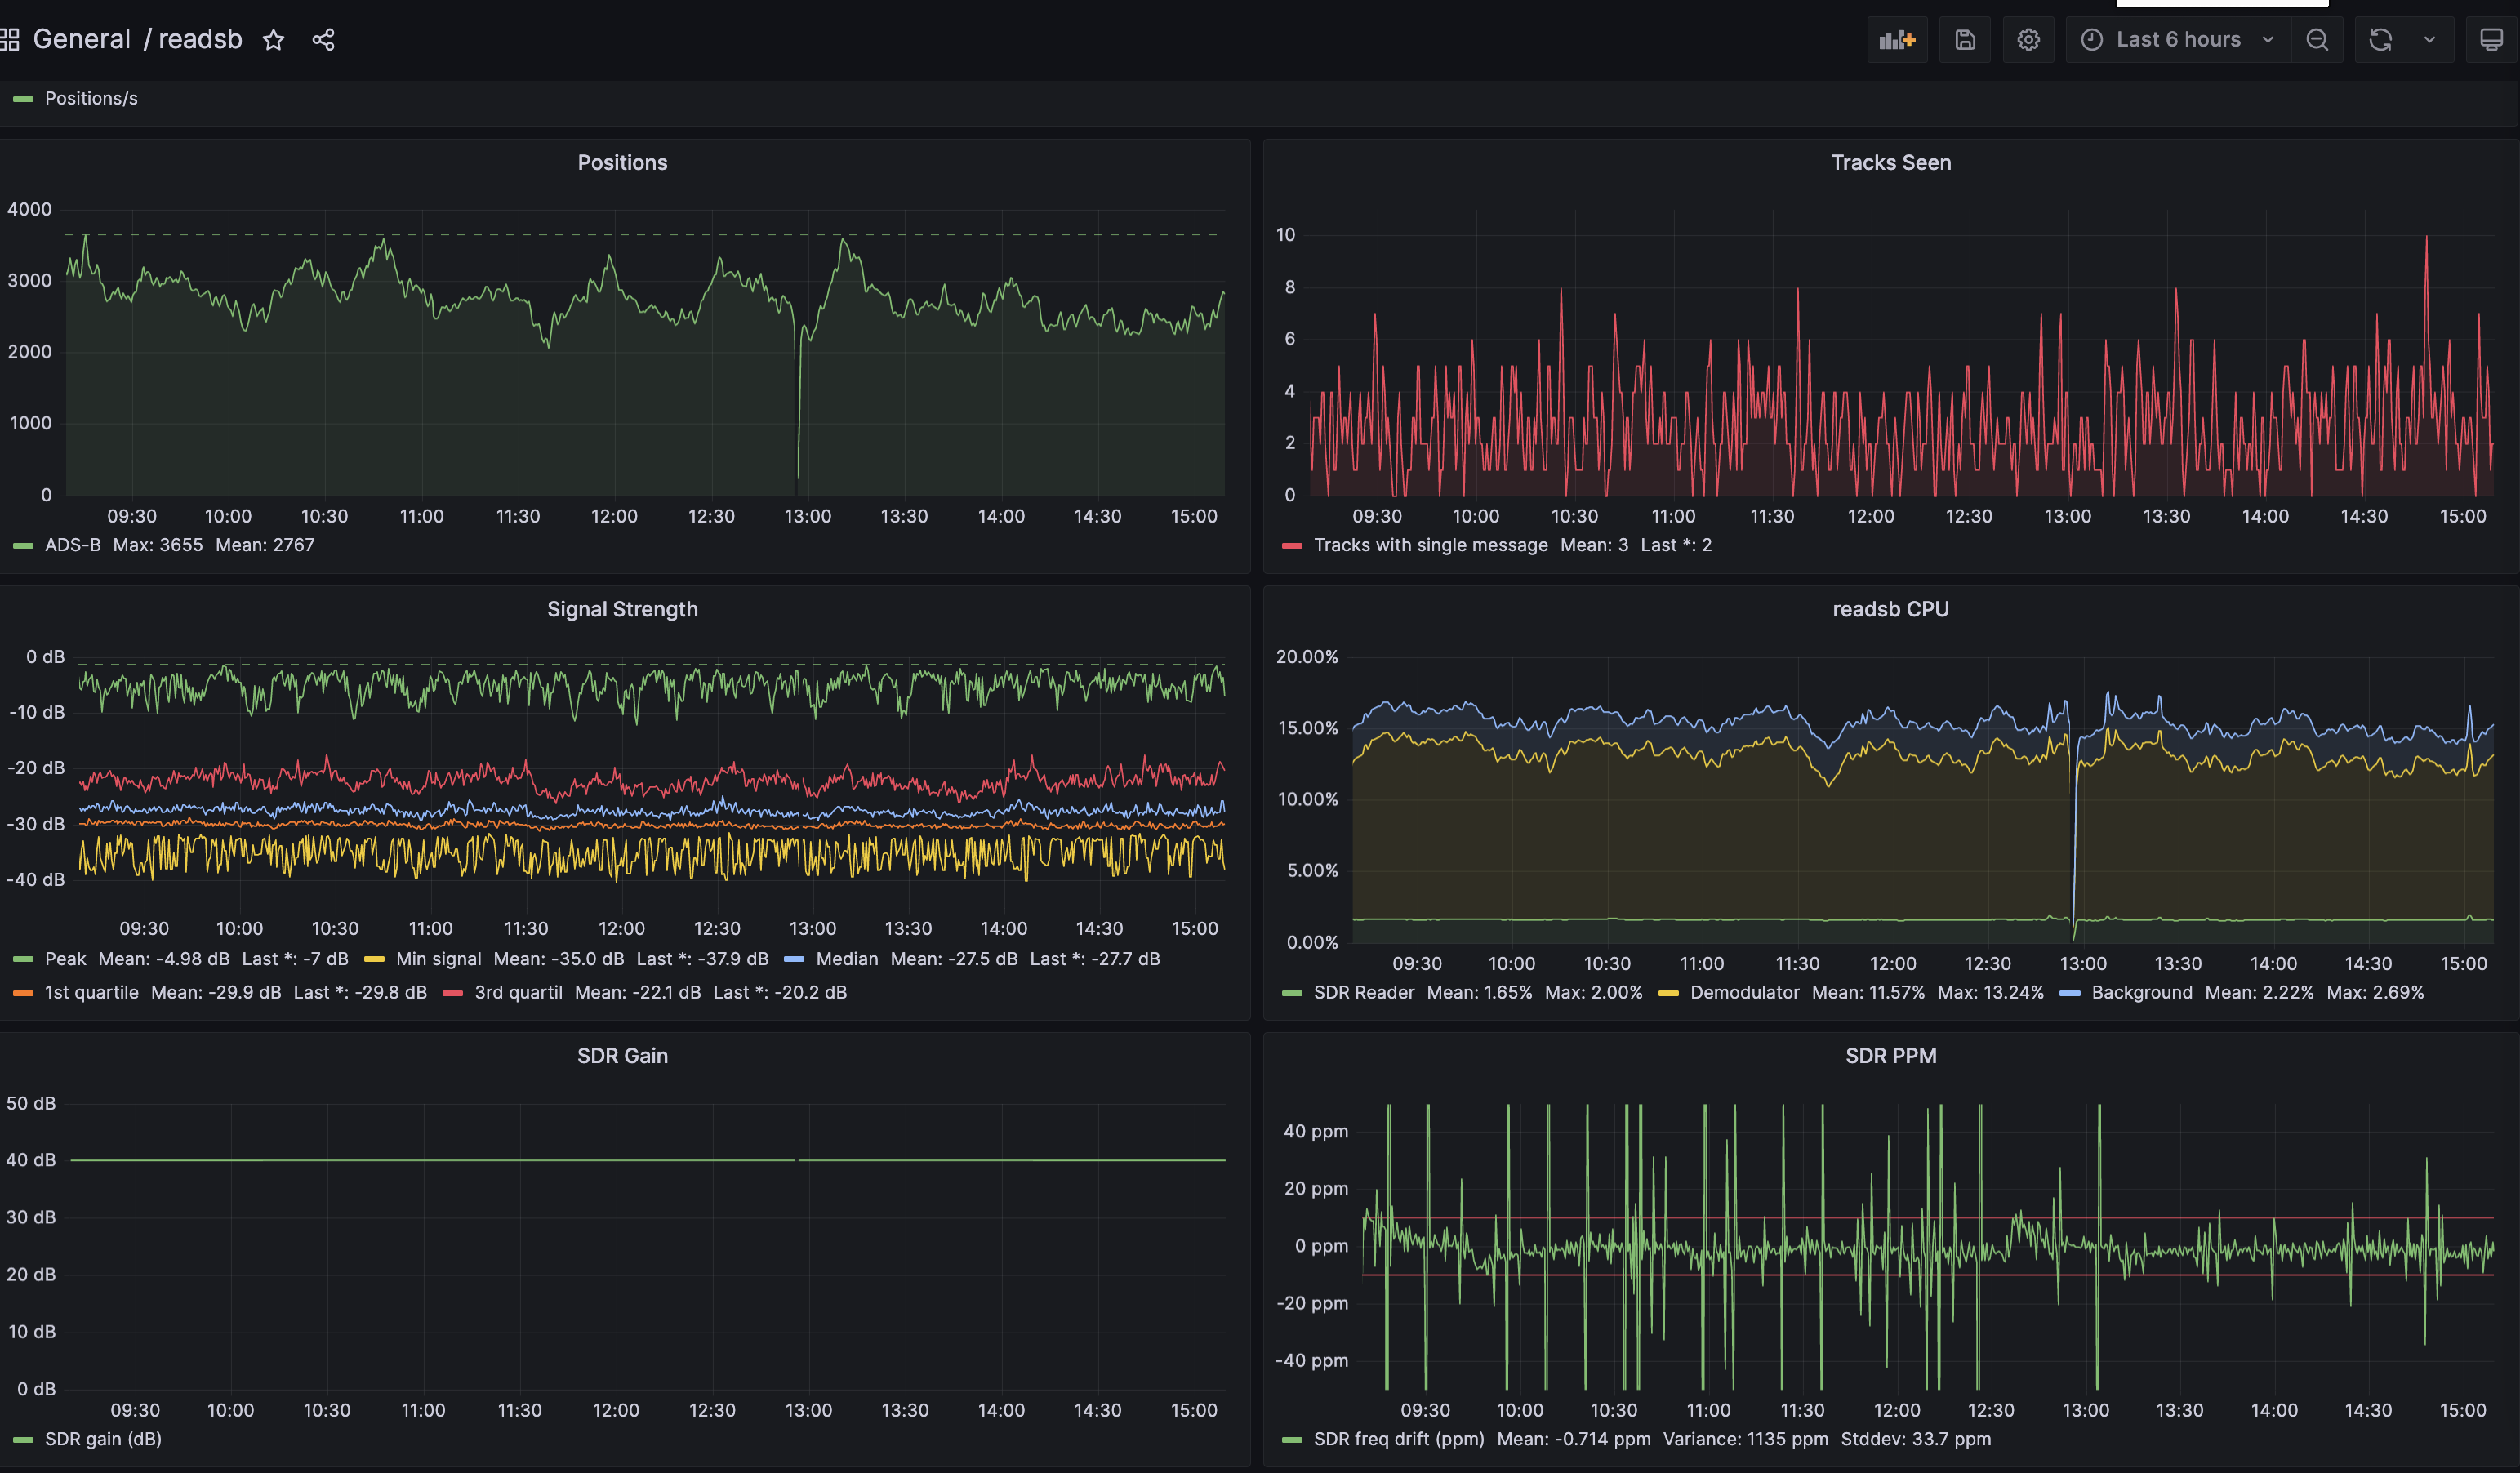
At this point you should see a very nice dashboard, you can find it under `General` in the `Dashboards` section.
## Embedding your Grafana Dashboard to your AIS-Catcher About page
This description presumes that you already do the following:
- have a working Grafana setup as per the instructions above
- have configured an About page as per the instructions [here](https://github.com/sdr-enthusiasts/docker-shipxplorer/blob/main/README.md#adding-an-about-page-to-the-ais-catcher-website)
- If your AIS-Catcher/ShipXplorer website is exposed outside your intranet, you should also have an externally accessible link to your Grafana instance.
### 1 - Create a new Organization in Grafana and import your Data Source and Dashboard
This is not 100% mandatory, but since "anonymous" access enables seeing all Dashboards of an Organization, it's recommendable to isolate your AIS-Catcher dashboard in a separate Organization.
1. Log in to Grafana with an Admin account
2. Go to `Server Admin` (Shield icon) -> `Organizations`
3. Click `+ New org` and create a new Organization. You can call it whatever you want; for simplicity, we've called it "`public`". Click on it to select it.
4. Now you have to import your Prometheus Data Source and Grafana Dashboard again. Follow the instructions above; make sure it says "`Organization: public`" at the top of the page. If you have made adjustments to your Grafana Dashboard in your other organization, you can go there, export the JSON "for external use", and then copy this JSON code into a new Dashboard in the `public` organization.
You should now be able to see your Grafana AIS-Catcher Dashboard in the `public` organization.
### 2 - Enable your Grafana Config for showing Dashboards without logging in
This enables Grafana to show and embed dashboards without logging in, limited to a **single organization**.
Add the following parameters to the `environment:` section of your Grafana Service definition in `docker-compose.yml`. If you have named your Organization something else than `public`, you'll have to adjust that below:
```yaml
environment:
- GF_AUTH_ANONYMOUS_ENABLED=true
- GF_AUTH_ANONYMOUS_ORG_NAME=public
- GF_SECURITY_ALLOW_EMBEDDING=true
```
Then restart the Grafana container with `docker restart grafana`.
Once you have done this, you need to do a Hard Reload of the Grafana Dashboard in your Web Browser. If you use Chrome, this would be CTRL-SHIFT-R (Windows) or CMD-SHIFT-R (Mac).
### 3 - Get your Grafana Dashboard Link and add it to `about.md`
1. In your Grafana Dashboard page (`public` organization), click the "Share Dashboard or Panel" button next to the title of the Dashboard
2. In the Link tab of the pop-up box, make sure that you **deselect** `Lock time range` and optionally **select** `Shorten URL`. If you usually render a Dark Mode Dashboard, you may want to select "Light Mode" because this fits better with the About page. Then copy the resulting URL
3. Edit `about.md` in the `/data` directory that previously created using the [instructions](https://github.com/sdr-enthusiasts/docker-shipxplorer/blob/main/README.md#adding-an-about-page-to-the-ais-catcher-website). Wherever you want the Dashboard to appear, add the following Markdown/HTML code block:
```html
```
Of course, replace `http://copied/link/from/grafana` by the Dashboard link you copied.