https://github.com/sefakcmn00/python-for-finance-cryptocurrency-analysis
In this project, after extracting the data sets as csv, we tried to reflect them graphically and schematically about cryptocurrencies in finance by using data analysis and data visualization methods. In this project, there are other cryptocurrencies in the data set we provided in this project, but if you want, you can do the same after reading them as csv files. We used 3 cryptocurrencies of our choice. These are Ethereum, bitcoin and dogecoin.
https://github.com/sefakcmn00/python-for-finance-cryptocurrency-analysis
coin datascience financial-analysis financial-data matplotlib pandas-dataframe pandas-python python3 seaborn
Last synced: 2 months ago
JSON representation
In this project, after extracting the data sets as csv, we tried to reflect them graphically and schematically about cryptocurrencies in finance by using data analysis and data visualization methods. In this project, there are other cryptocurrencies in the data set we provided in this project, but if you want, you can do the same after reading them as csv files. We used 3 cryptocurrencies of our choice. These are Ethereum, bitcoin and dogecoin.
- Host: GitHub
- URL: https://github.com/sefakcmn00/python-for-finance-cryptocurrency-analysis
- Owner: sefakcmn00
- Created: 2022-08-06T19:01:49.000Z (almost 4 years ago)
- Default Branch: main
- Last Pushed: 2022-08-06T19:02:18.000Z (almost 4 years ago)
- Last Synced: 2025-01-13T16:48:03.536Z (over 1 year ago)
- Topics: coin, datascience, financial-analysis, financial-data, matplotlib, pandas-dataframe, pandas-python, python3, seaborn
- Language: Jupyter Notebook
- Homepage:
- Size: 1.85 MB
- Stars: 2
- Watchers: 1
- Forks: 0
- Open Issues: 0
-
Metadata Files:
- Readme: README.md
Awesome Lists containing this project
README
# Finance-Cryptocurrency-Analysis-with-Python
In this project, after extracting the data sets as csv, we tried to reflect them graphically and schematically about cryptocurrencies in finance by using data analysis and data visualization methods. In this project, there are other cryptocurrencies in the data set we provided in this project, but if you want, you can do the same after reading them as csv files. We used 3 cryptocurrencies of our choice. These are Ethereum, bitcoin and dogecoin.
## Libraries and Utilities
```Python
import numpy as np
import pandas as pd
import matplotlib.pyplot as plt
```
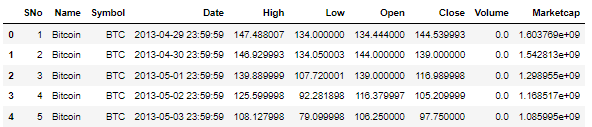
### Let's take a look at our top five data
```Python
df_btc.head()
```
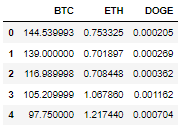
```Python
df = pd.DataFrame({'BTC': df_btc['Close'],
'ETH': df_eth['Close'],
'DOGE': df_doge['Close']})
df.head()
```
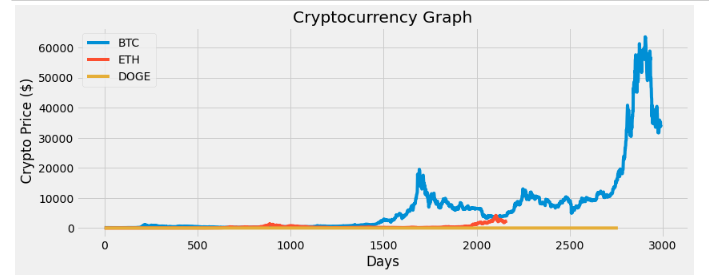
### Cryptocurrency Graph
```Python
import matplotlib.pyplot as plt
plt.style.use('fivethirtyeight')
my_crypto = df
plt.figure(figsize = (12.2, 4.5))
for c in my_crypto.columns.values:
plt.plot(my_crypto[c], label = c)
plt.title('Cryptocurrency Graph')
plt.xlabel('Days')
plt.ylabel(' Crypto Price ($)')
plt.legend(my_crypto.columns.values, loc= 'upper left')
plt.show()
```
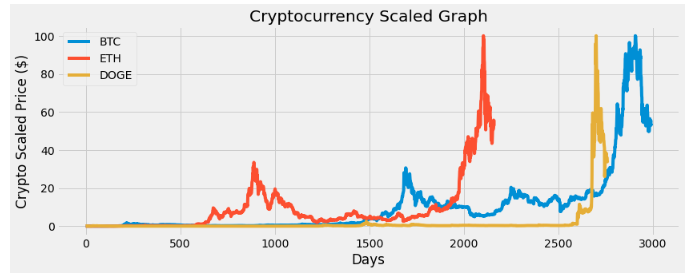
### Cryptocurrency Scaled Graph
```Python
#Visualize the scaled data
my_crypto = df_scale
plt.figure(figsize=(12.4, 4.5))
for c in my_crypto.columns.values:
plt.plot(my_crypto[c], label=c)
plt.title('Cryptocurrency Scaled Graph')
plt.xlabel('Days')
plt.ylabel('Crypto Scaled Price ($)')
plt.legend(my_crypto.columns.values, loc = 'upper left')
plt.show()
```
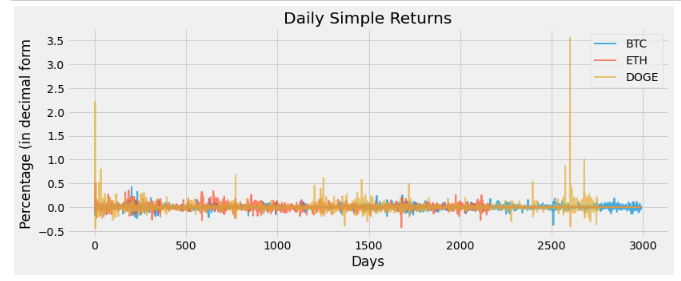
### Daily Simple Returns
```Python
plt.figure(figsize=(12, 4.5))
for c in DSR.columns.values:
plt.plot(DSR.index, DSR[c], label = c, lw = 2, alpha = .7)
plt.title('Daily Simple Returns')
plt.ylabel('Percentage (in decimal form')
plt.xlabel('Days')
plt.legend(DSR.columns.values, loc= 'upper right')
plt.show()
```
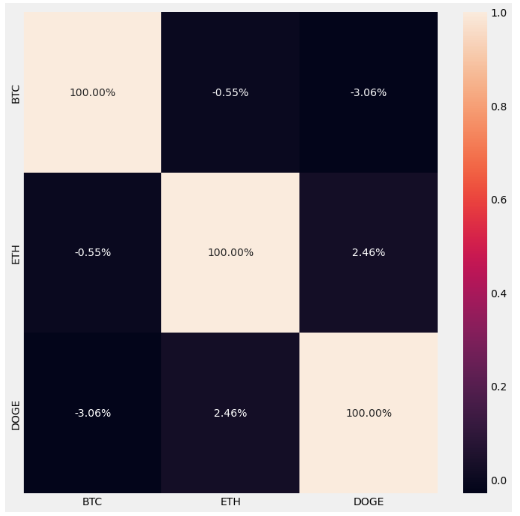
### Heat Map
```Python
import seaborn as sns
plt.subplots(figsize= (11,11))
sns.heatmap(DSR.corr(), annot= True, fmt= '.2%')
```
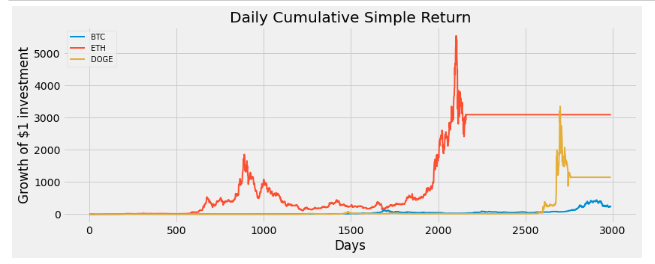
### Daily Cumulative Simple Return
```Python
plt.figure(figsize=(12.2, 4.5))
for c in DCSR.columns.values:
plt.plot(DCSR.index, DCSR[c], lw=2, label= c)
plt.title('Daily Cumulative Simple Return')
plt.xlabel('Days')
plt.ylabel('Growth of $1 investment')
plt.legend(DCSR.columns.values, loc = 'upper left', fontsize = 10)
plt.show()
```