https://github.com/selva221724/edasql
edaSQL is a python library to bridge the SQL with Exploratory Data Analysis where you can connect to the Database and insert the queries. The query results can be passed to the EDA tool which can give greater insights to the user.
https://github.com/selva221724/edasql
correlation data-analysis data-science data-visualization dataprofiling eda missing-values outlier-detection pandas python sql
Last synced: about 1 year ago
JSON representation
edaSQL is a python library to bridge the SQL with Exploratory Data Analysis where you can connect to the Database and insert the queries. The query results can be passed to the EDA tool which can give greater insights to the user.
- Host: GitHub
- URL: https://github.com/selva221724/edasql
- Owner: selva221724
- License: mit
- Created: 2021-11-03T08:33:22.000Z (over 4 years ago)
- Default Branch: main
- Last Pushed: 2021-11-14T05:59:52.000Z (over 4 years ago)
- Last Synced: 2025-05-29T13:14:34.408Z (about 1 year ago)
- Topics: correlation, data-analysis, data-science, data-visualization, dataprofiling, eda, missing-values, outlier-detection, pandas, python, sql
- Language: Python
- Homepage:
- Size: 4.91 MB
- Stars: 10
- Watchers: 2
- Forks: 1
- Open Issues: 0
-
Metadata Files:
- Readme: README.md
- License: LICENSE
Awesome Lists containing this project
README
[ ](https://pypi.org/project/edaSQL/)
[ ](https://edasql.readthedocs.io/en/latest/)
[ ](https://opensource.org/licenses/MIT)


## SQL Bridge Tool to Exploratory Data Analysis
**edaSQL** is a library to link SQL to **Exploratory Data Analysis** and further more in the Data Engineering. This will solve many limitations in the SQL studios available in the market. Use the SQL Query language to get your Table Results.
## Installation
Install dependency Packages before installing edaSQL
```shell
pip install pyodbc
pip install ipython
```
Optional dependency for better visualization - [Jupyter Notebook](https://jupyter.org/install)
```shell
pip install notebook
```
**Now Install using pip** . [Offical Python Package Here!!](https://pypi.org/project/edaSQL/)
```shell
pip install edaSQL
```
(OR)
Clone this Repository. Run this from the root directory to install
```shell
python setup.py install
```
## Documentation

[Read the detailed documentation in readthedocs.io](https://edasql.readthedocs.io/en/latest/) (still under the development)
## License
The license for edaSQL is MIT license
## Need help?
Stuck on your edaSQL code or problem? Any other questions? Don't
hestitate to send me an email (selva221724@gmail.com).
## edaSQL Jupyter NoteBook Tutorial
Access the sample Jupyter Notebook [here!!](https://github.com/selva221724/edaSQL/blob/main/example_notebook/SampleNoteBook_edaSQL.ipynb)
Access the Sample Data Used in this Repo
- [CSV](https://github.com/selva221724/edaSQL/blob/main/sampleData/CSV/INX.csv)
- [DataBase Backup](https://github.com/selva221724/edaSQL/blob/main/sampleData/DataBaseBackup/INX.bak) ( you can restore the DB in SQL Studio )
**edaSQL for DataFrame:** If you are using the CSV or Excel as a source , Read using the Pandas & start from the [**3. Data Overview**](#Chapter1)
### Import Packages
```python
import edaSQL
import pandas as pd
```
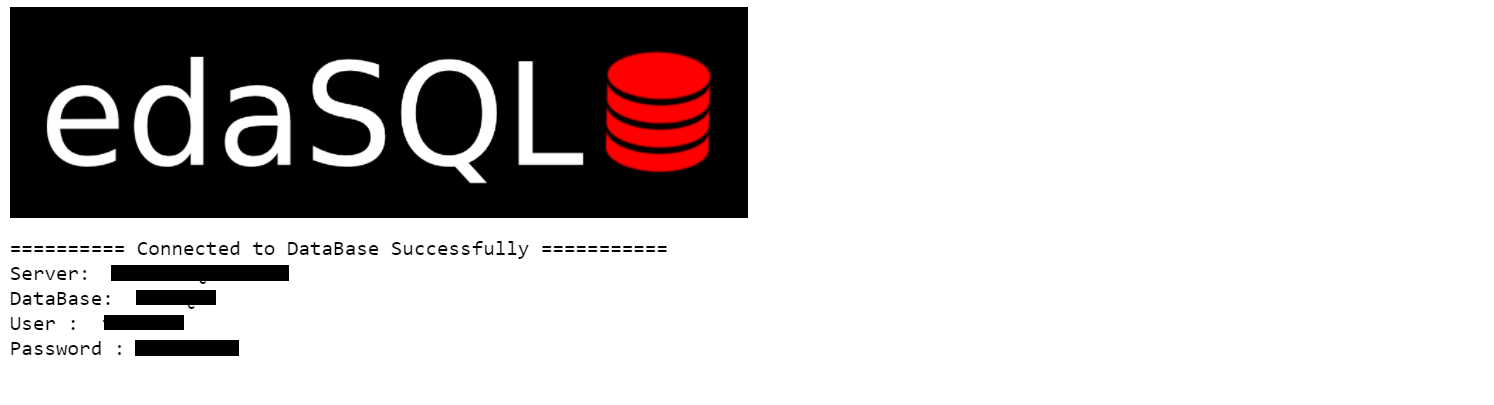
### 1. Connect to the DataBase
```python
edasql = edaSQL.SQL()
edasql.connectToDataBase(server='your server name',
database='your database',
user='username',
password='password',
sqlDriver='ODBC Driver 17 for SQL Server')
```
### 2. Query Data
```python
sampleQuery = "select * from INX"
data = pd.read_sql(sampleQuery, edasql.dbConnection)
```
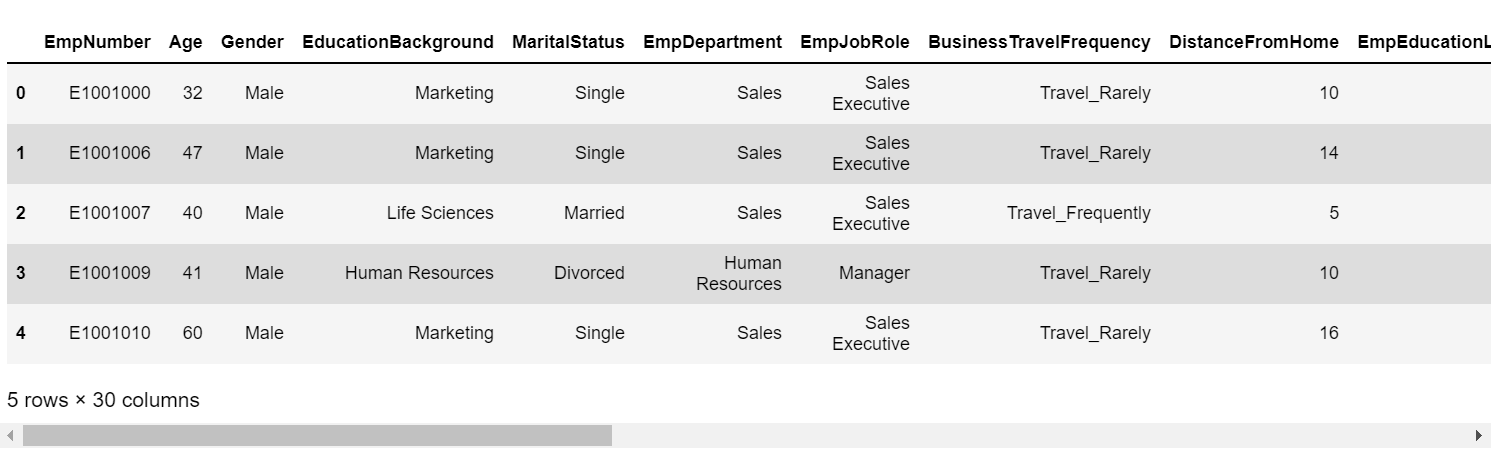
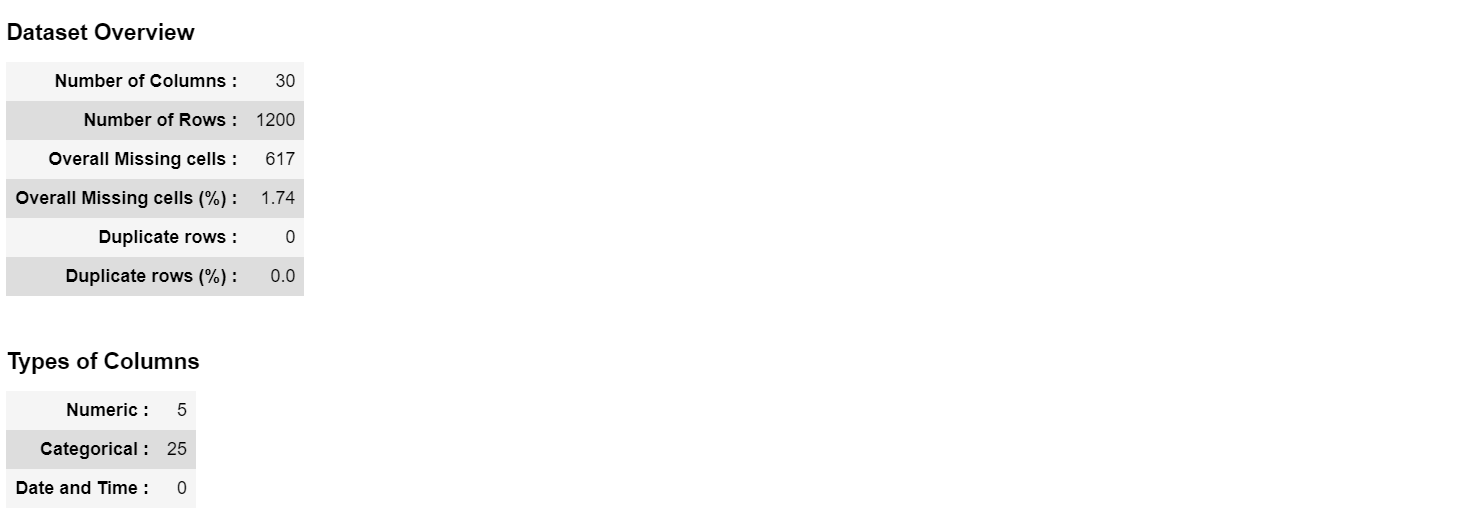
### 3. Data Overview
```python
insights = edaSQL.EDA(dataFrame=data,HTMLDisplay=True)
dataInsights =insights.dataInsights()
```
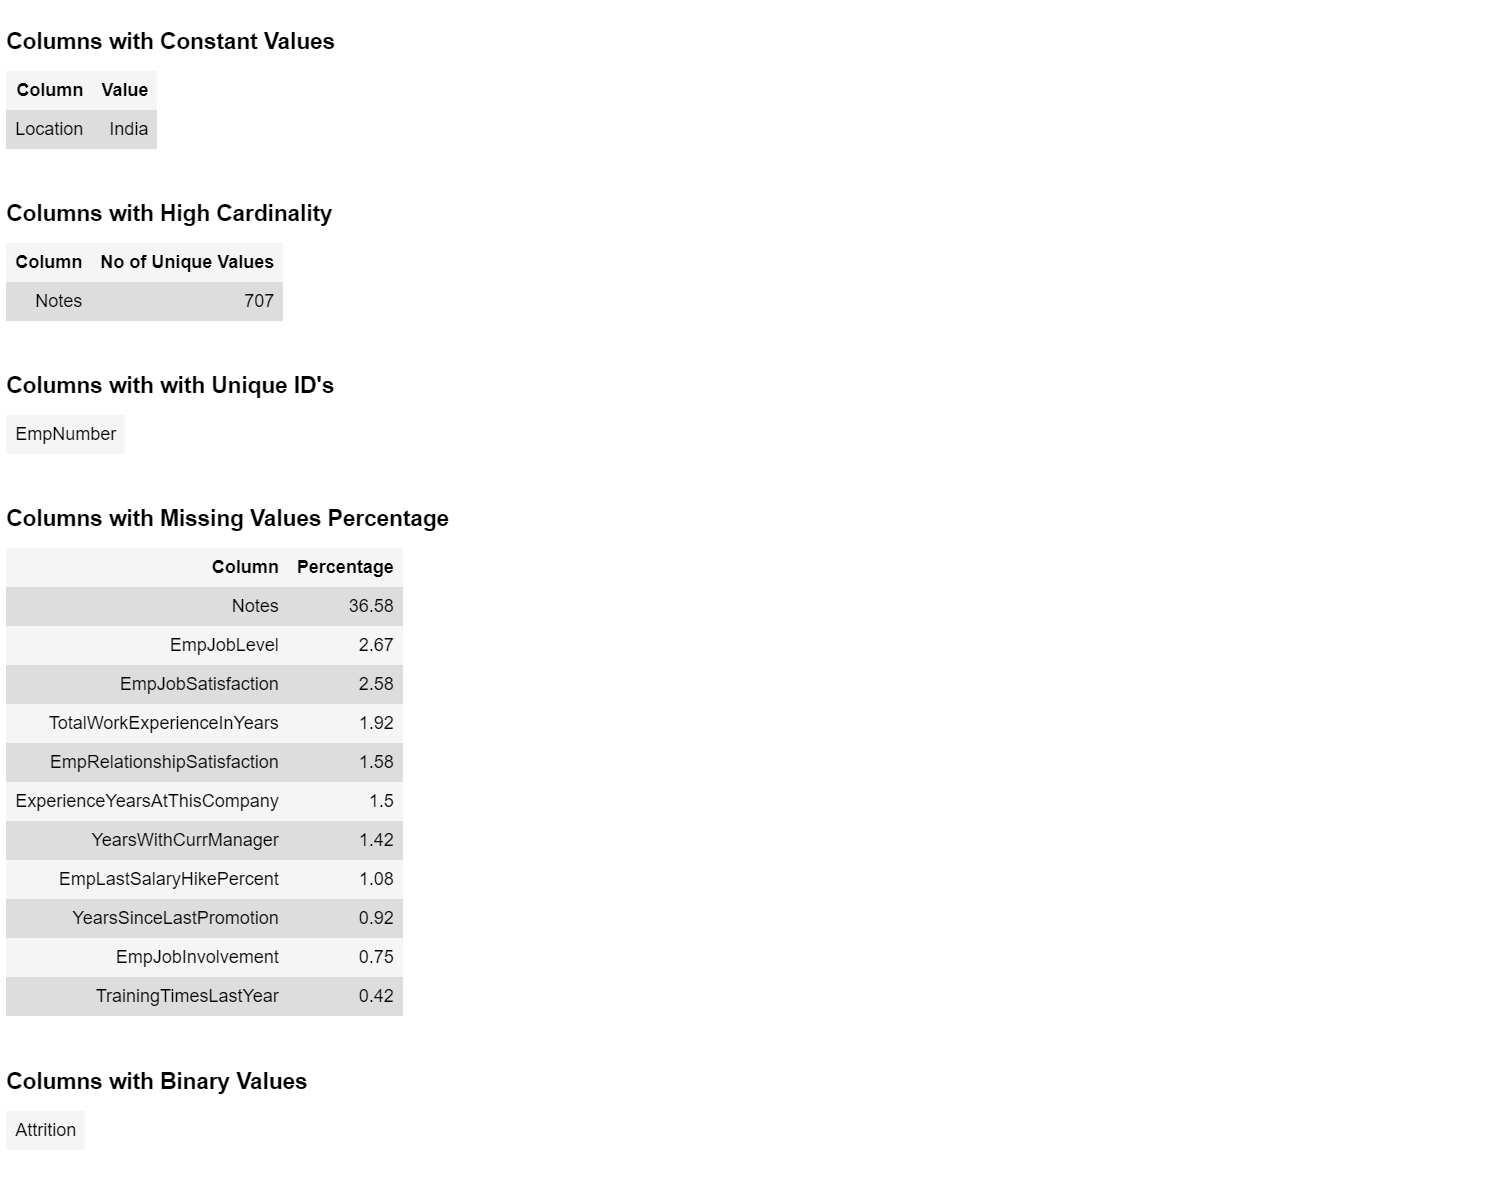
```python
deepInsights = insights.deepInsights()
```
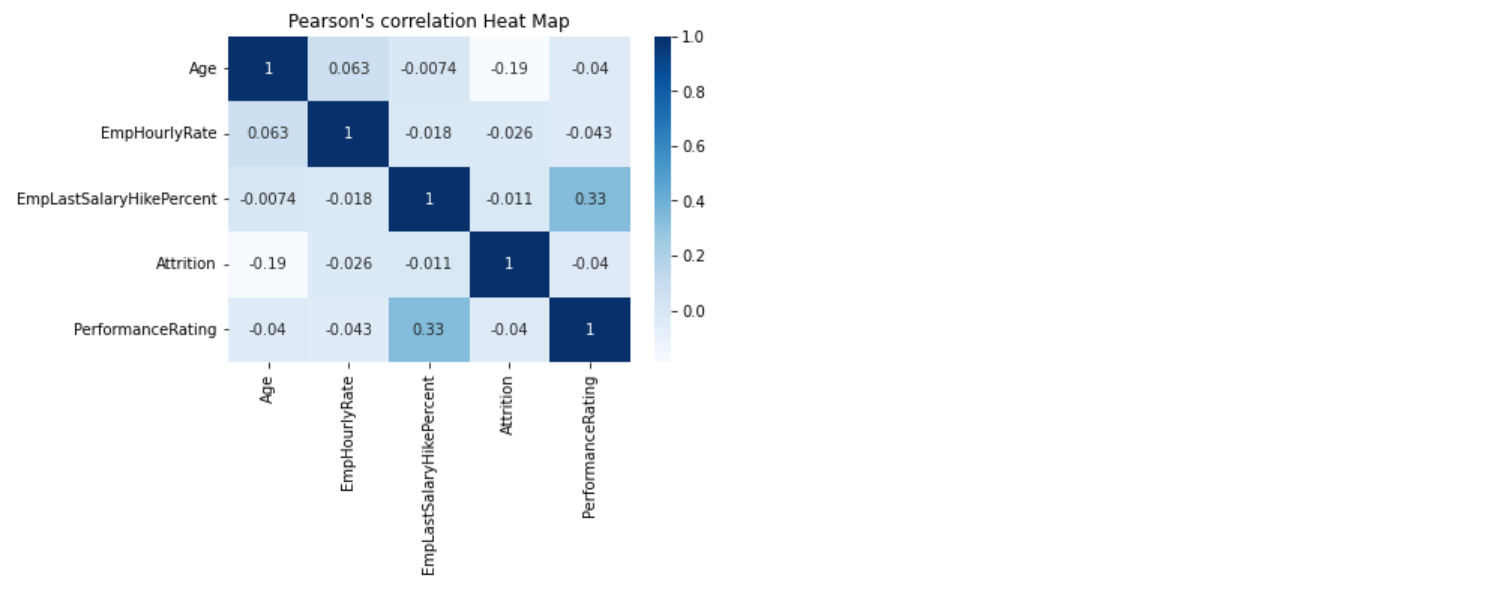
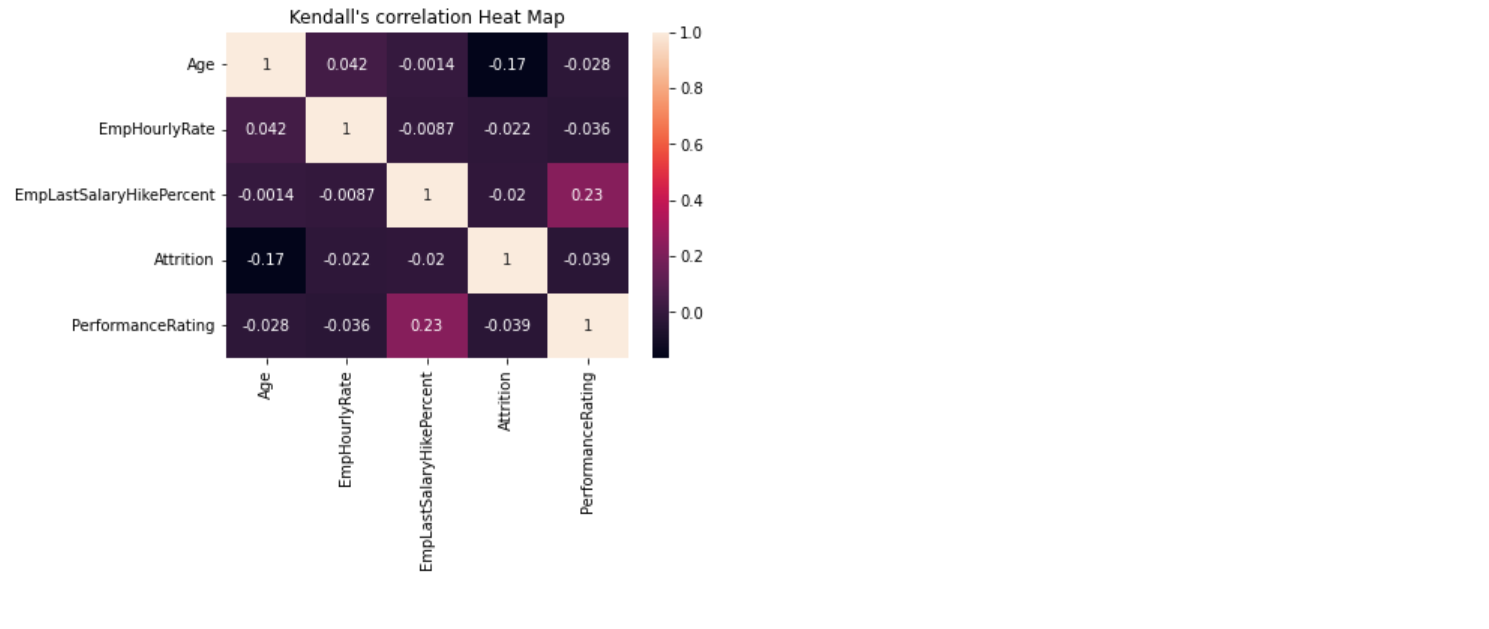
### 4. Correlation
```python
eda = edaSQL.EDA(dataFrame=data)
eda.pearsonCorrelation()
```
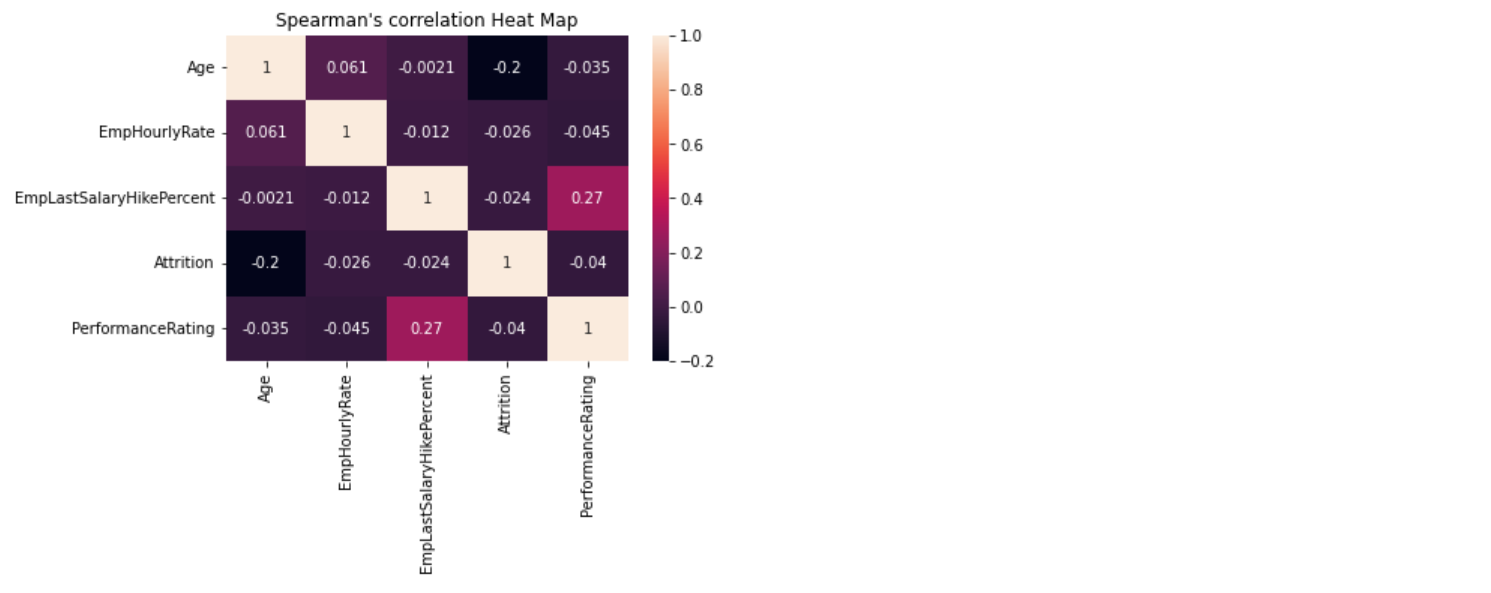
```python
eda.spearmanCorrelation()
```
```python
eda.kendallCorrelation()
```
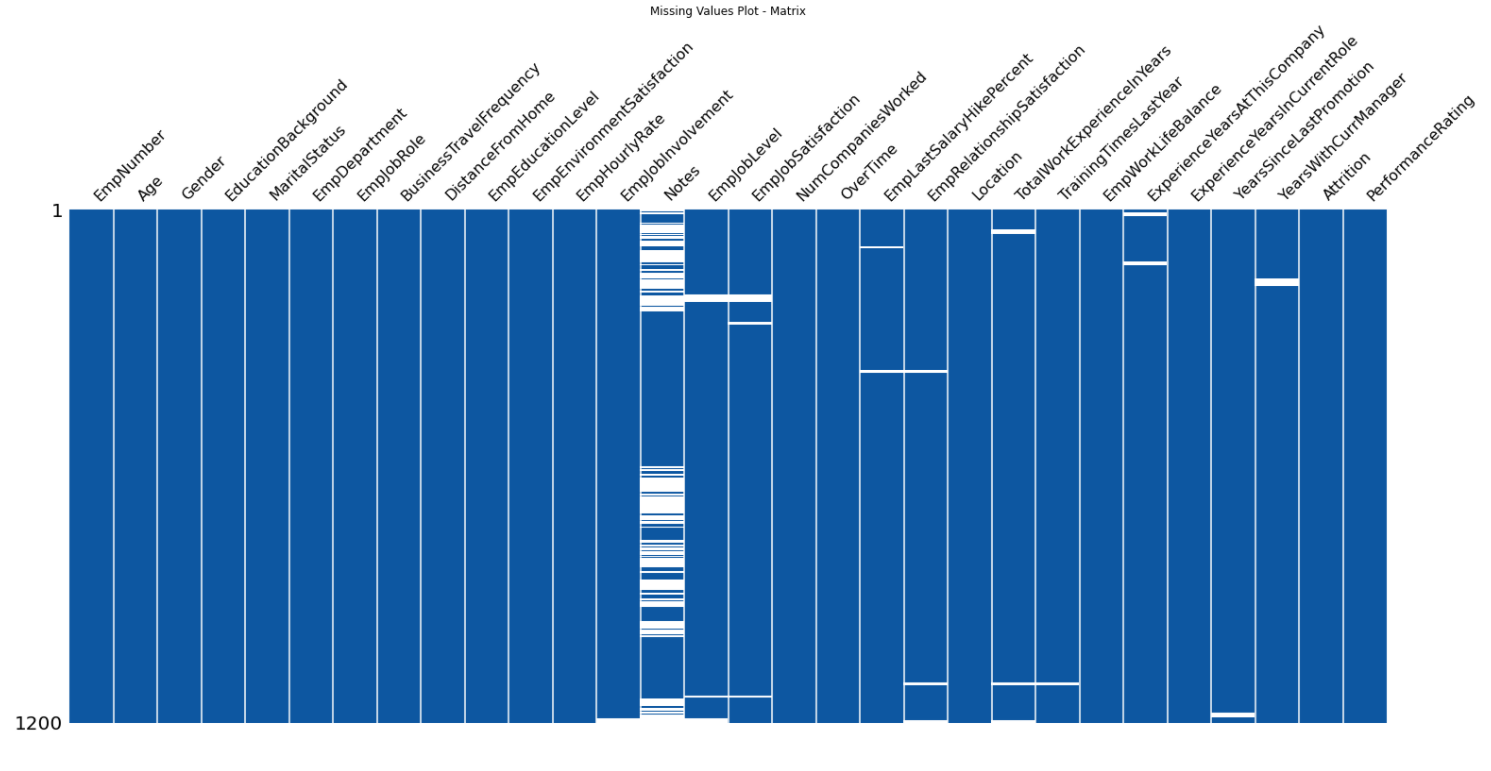
### 5. Missing Values
```python
eda.missingValuesPlot(plot ='matrix')
```
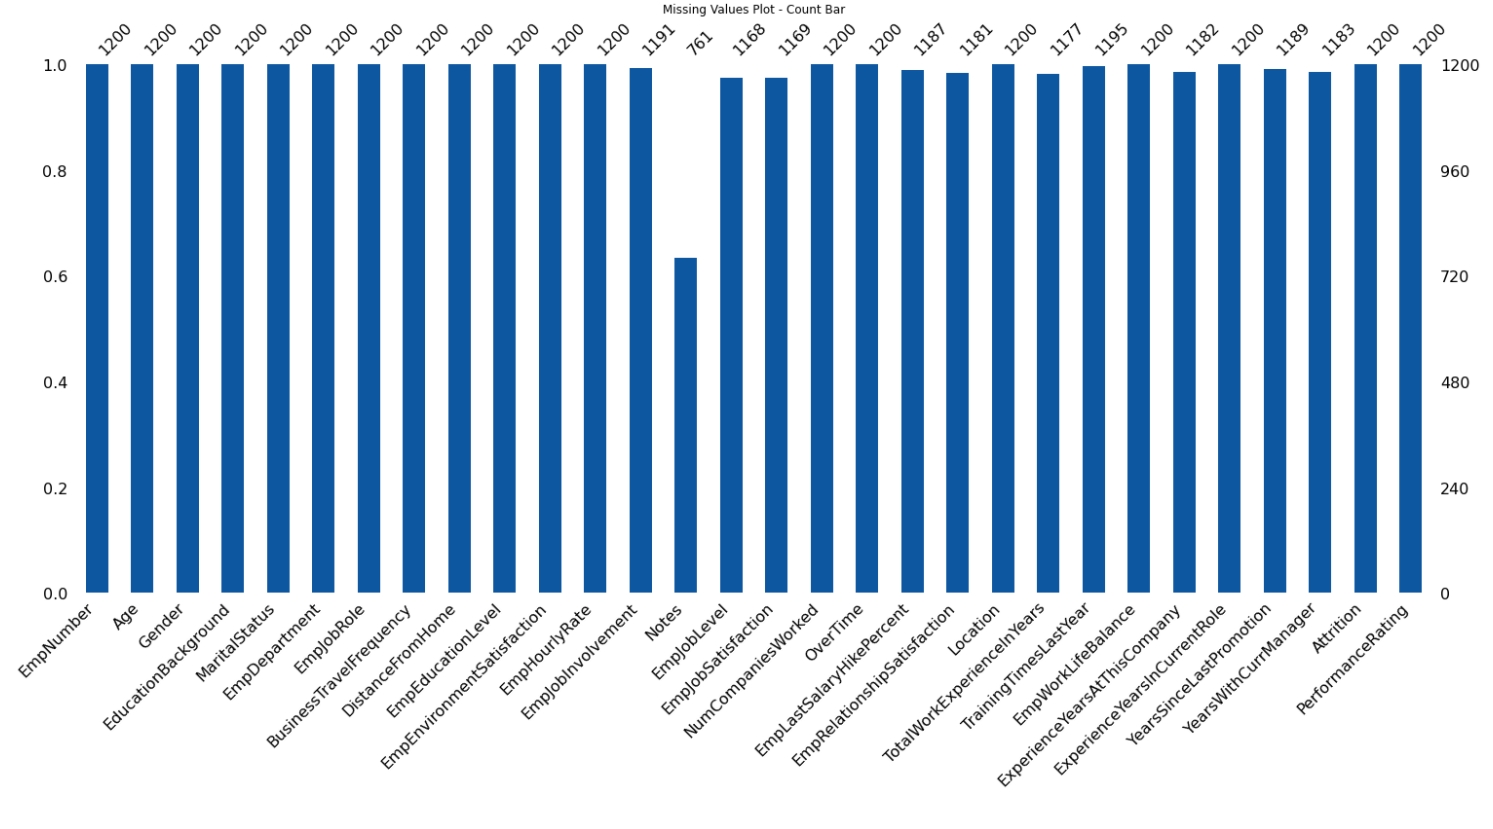
```python
eda.missingValuesPlot(plot ='bar')
```
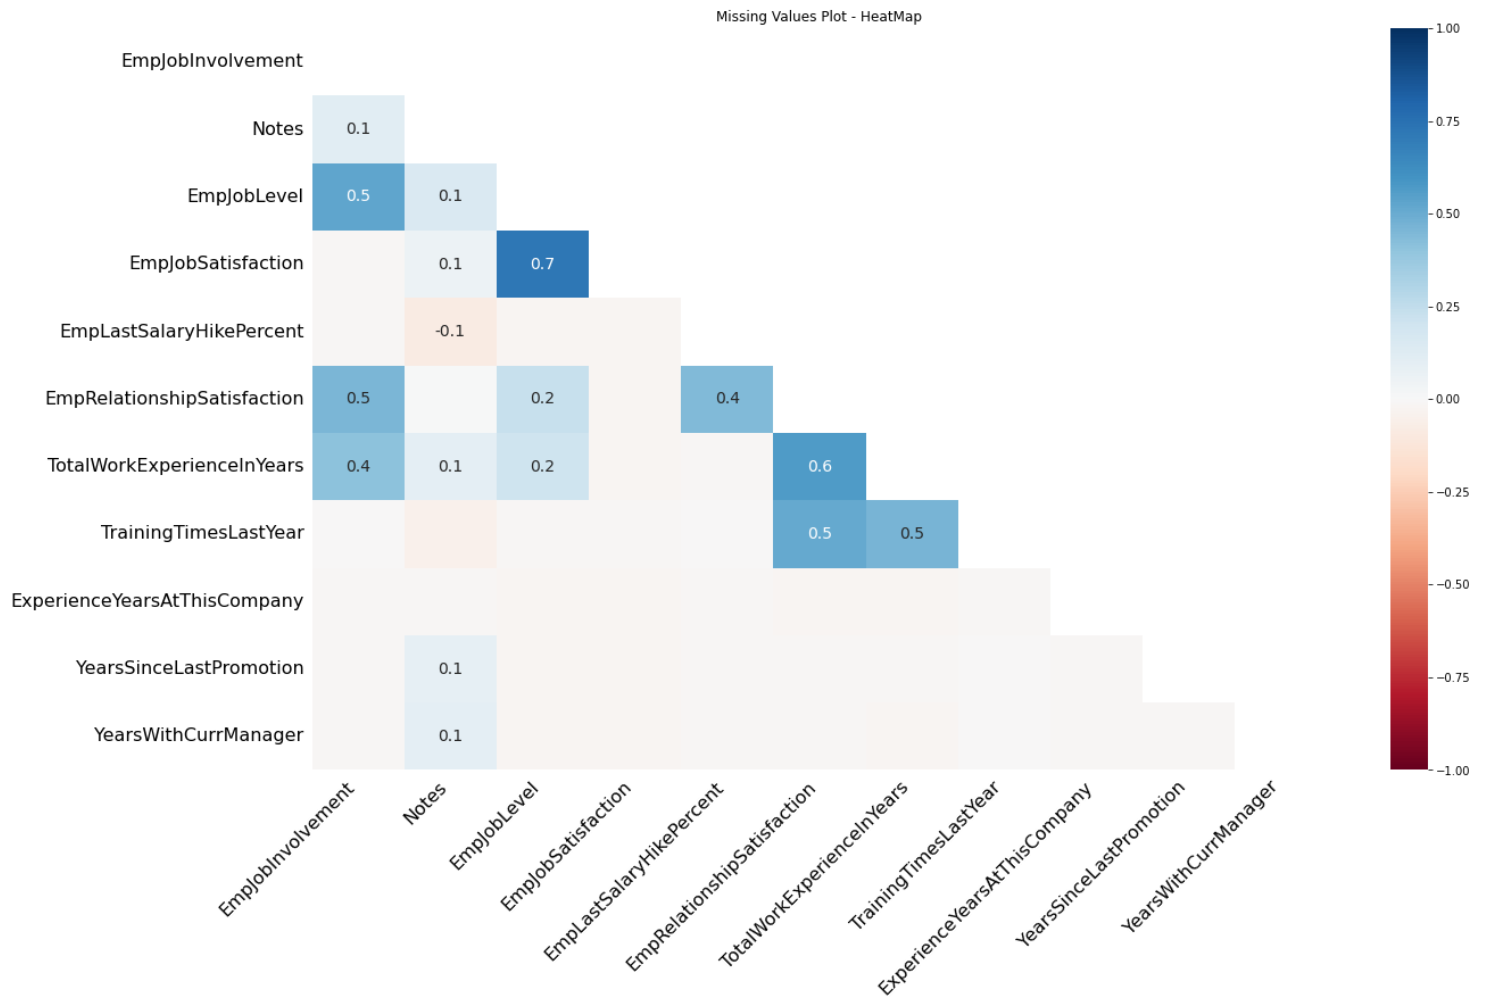
```python
eda.missingValuesPlot(plot ='heatmap')
```
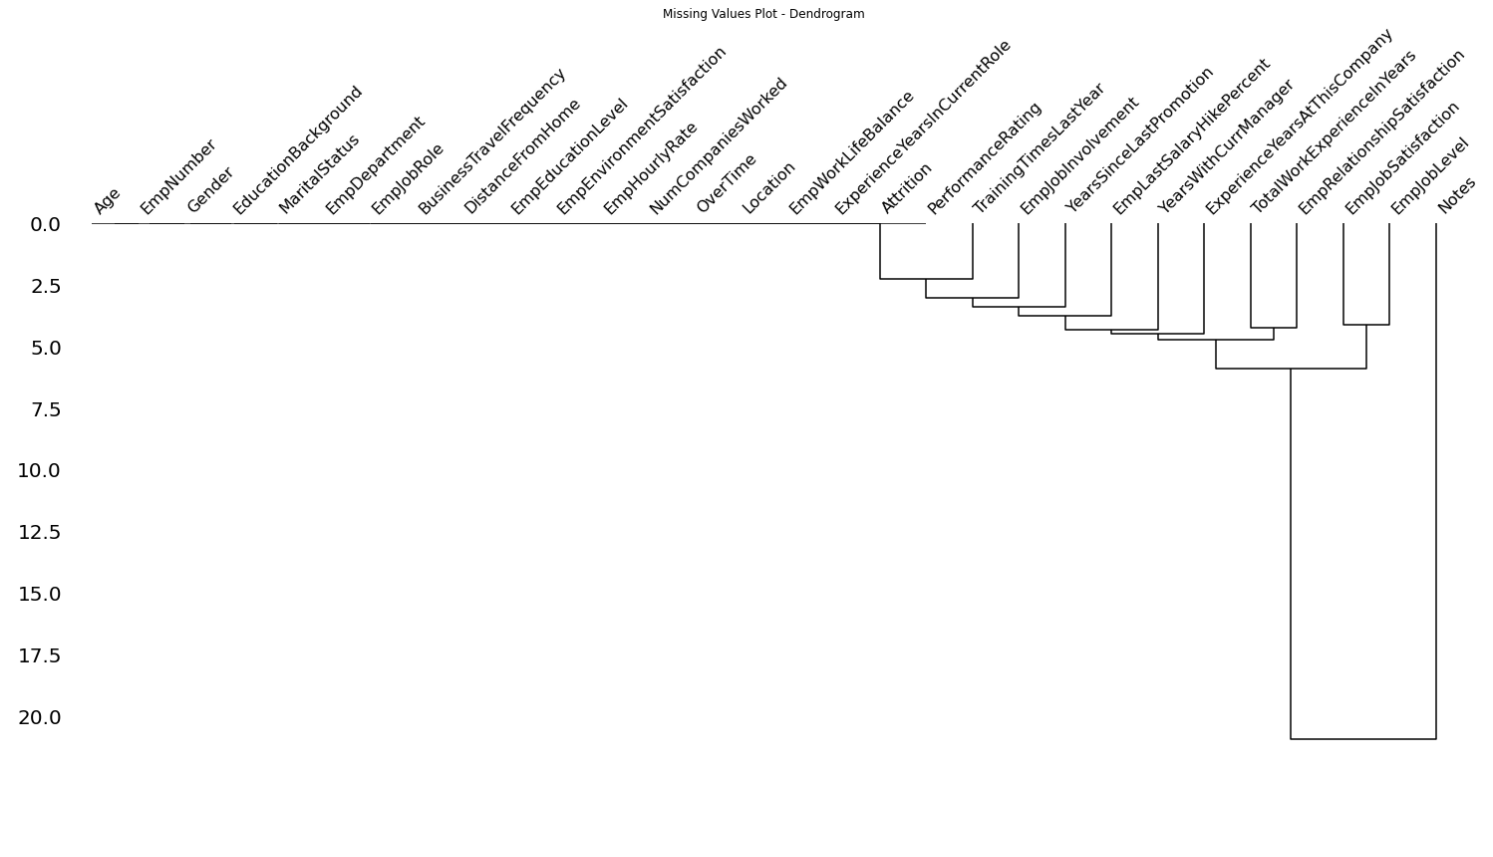
```python
eda.missingValuesPlot(plot ='dendrogram')
```
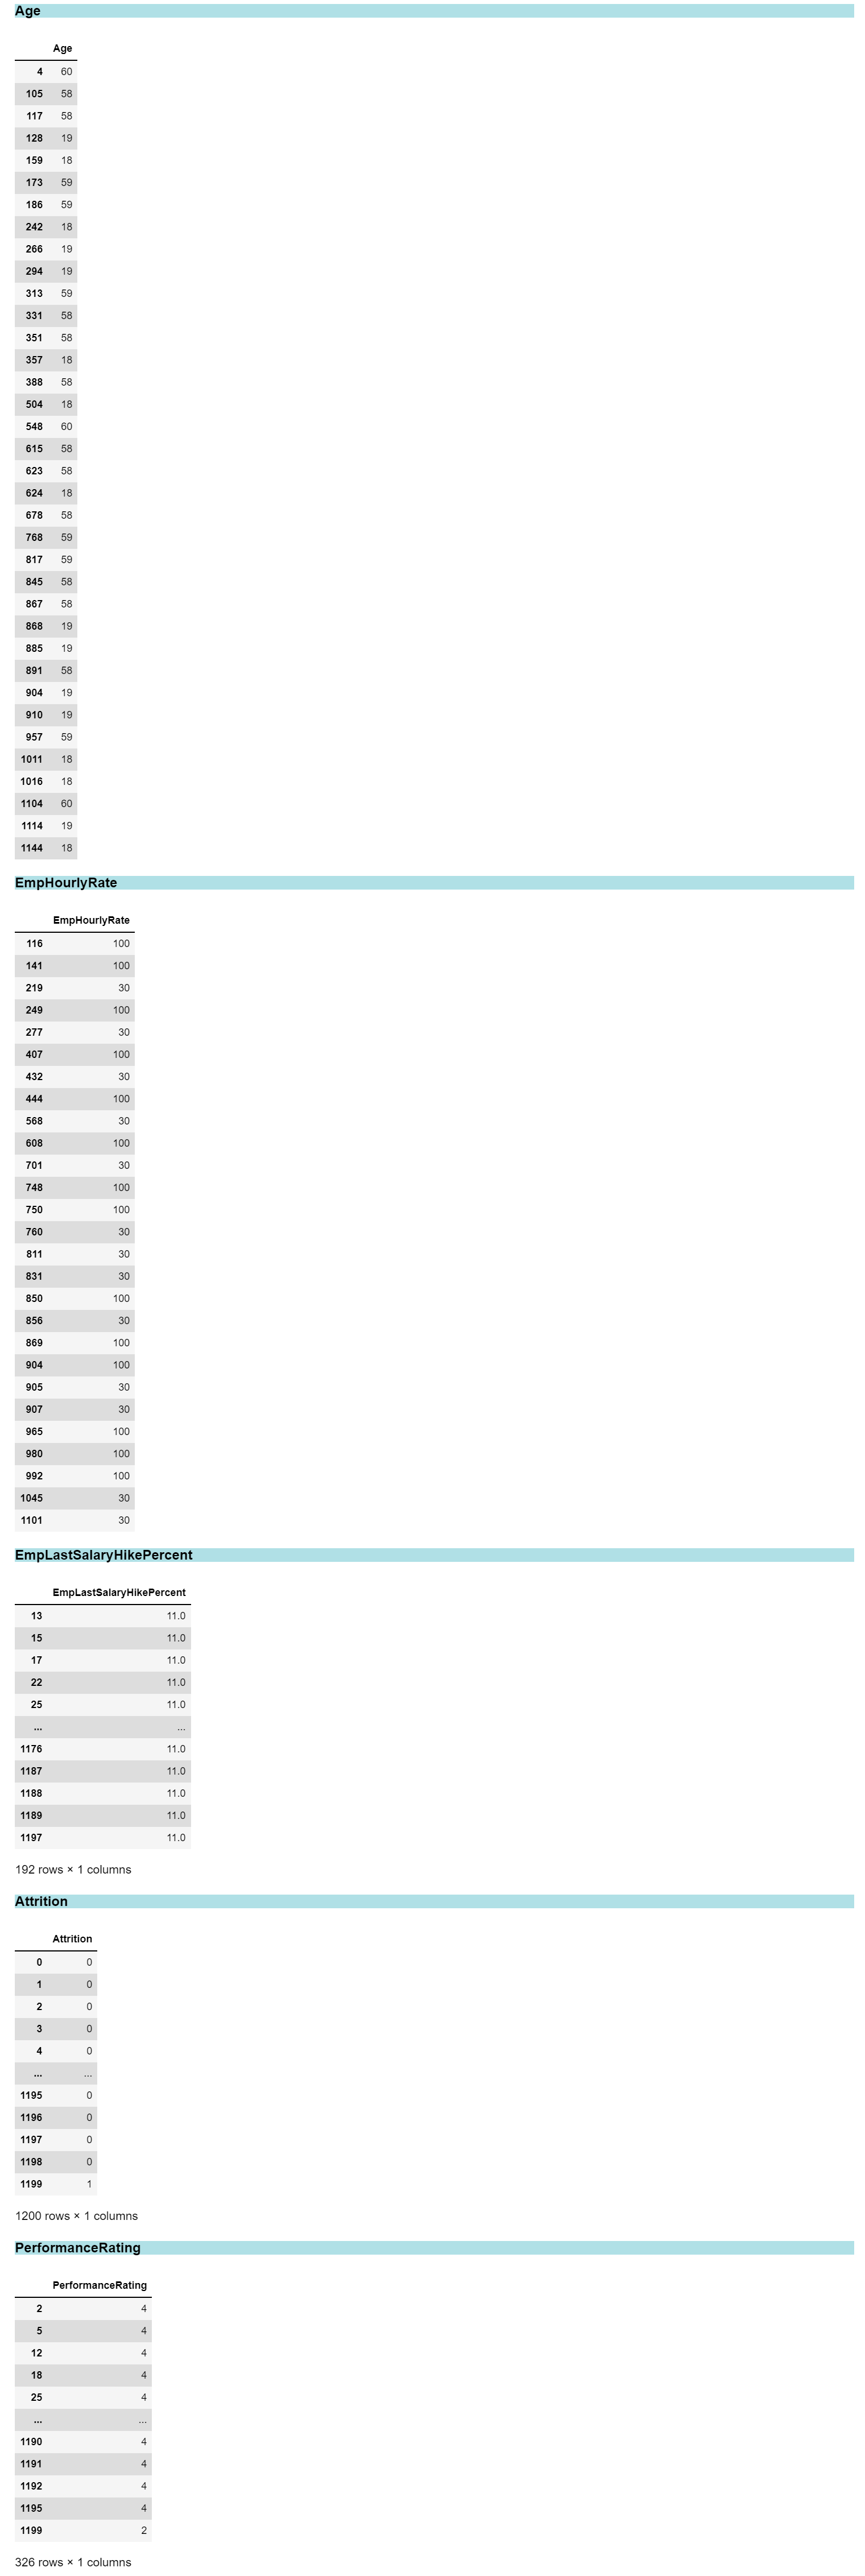
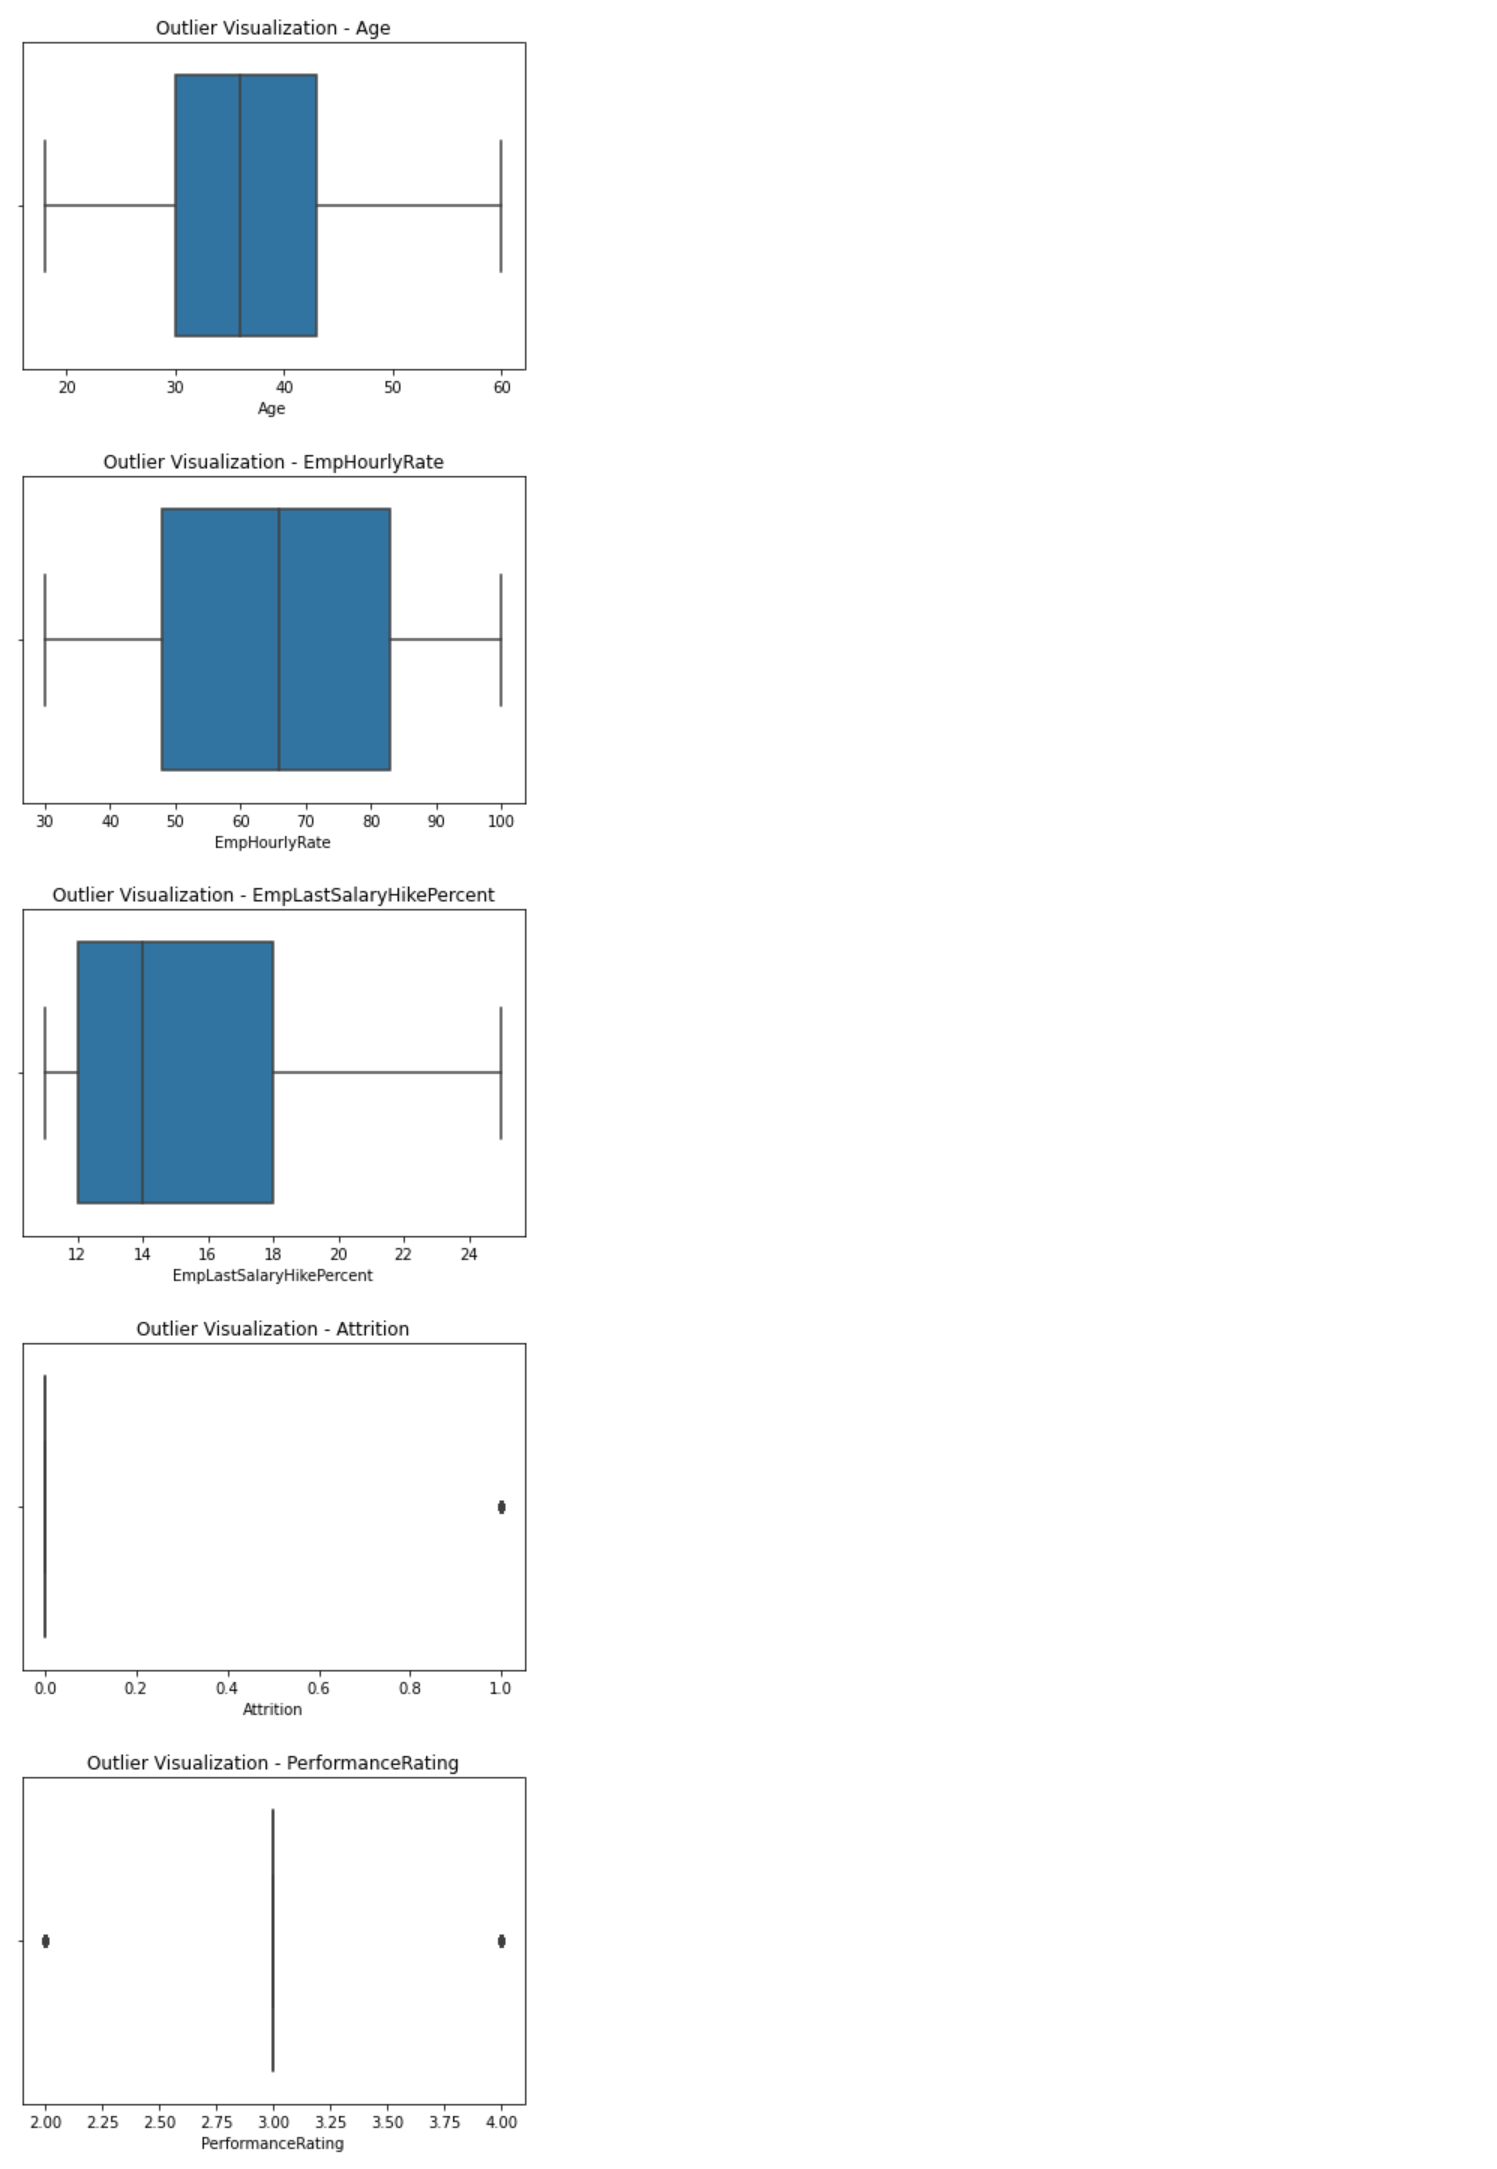
### 6. Outliers
```python
eda.outliersVisualization(plot = 'box')
```
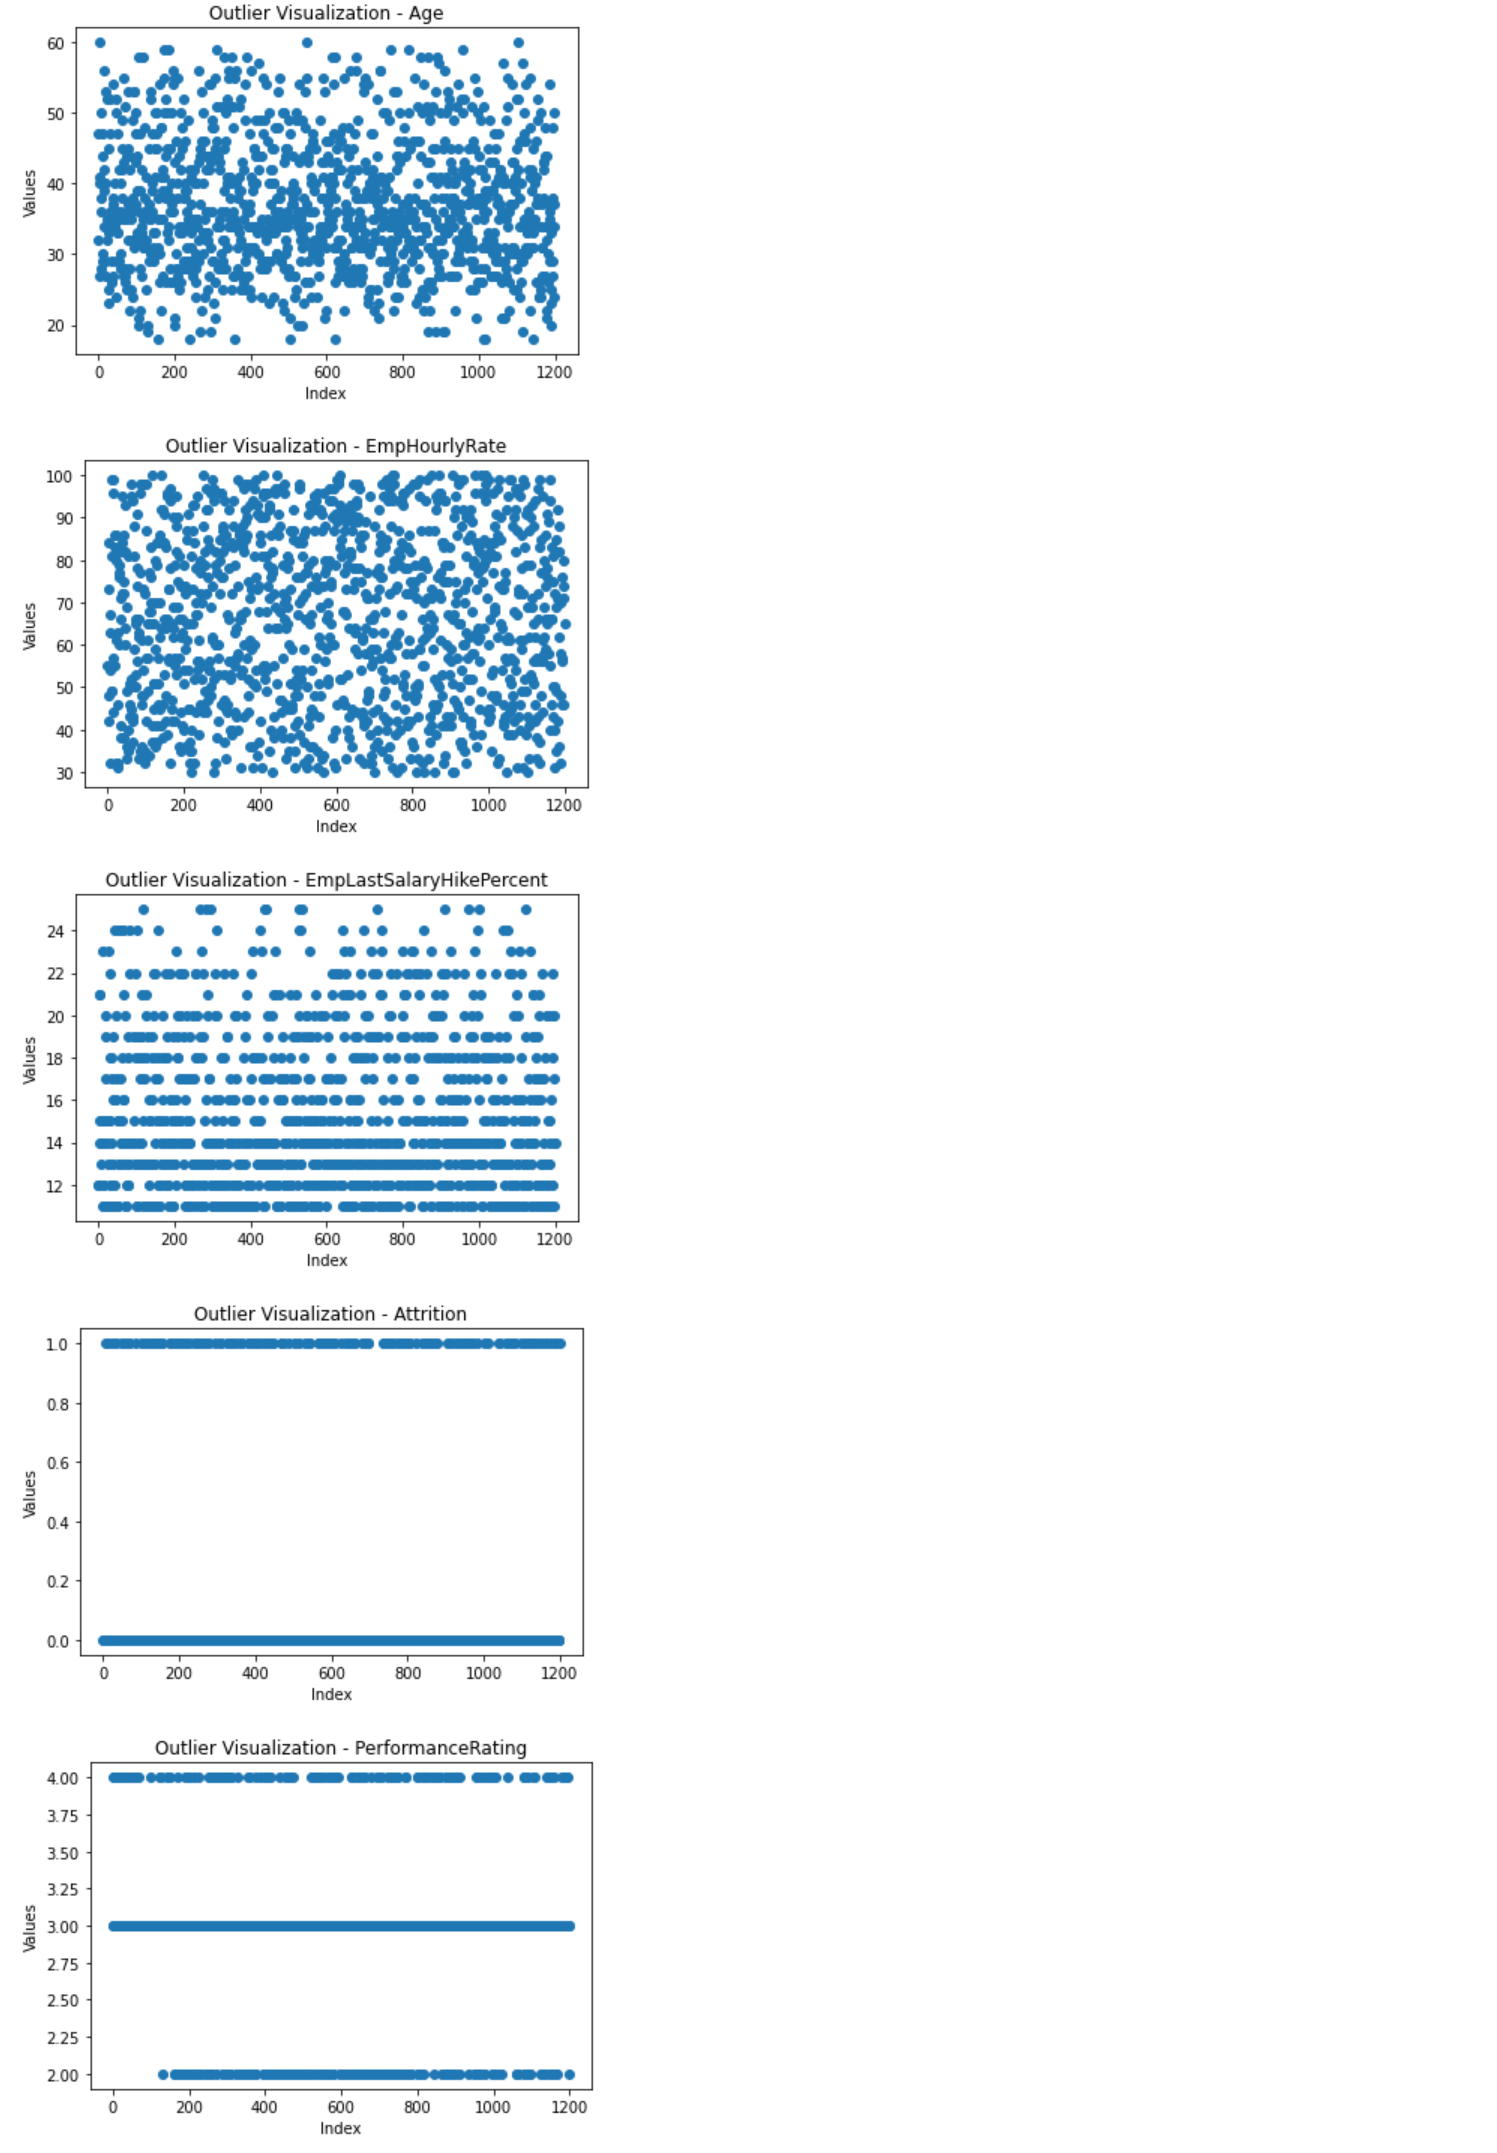
```python
eda.outliersVisualization(plot = 'scatter')
```
```python
outliers = eda.getOutliers()
```