https://github.com/sensedeep/dynamodb-metrics
DynamoDB Metrics for Single Table Designs
https://github.com/sensedeep/dynamodb-metrics
aws dynamodb metrics monitoring nosql serverless
Last synced: 6 months ago
JSON representation
DynamoDB Metrics for Single Table Designs
- Host: GitHub
- URL: https://github.com/sensedeep/dynamodb-metrics
- Owner: sensedeep
- License: mit
- Created: 2021-09-09T06:49:30.000Z (almost 5 years ago)
- Default Branch: main
- Last Pushed: 2023-02-15T05:21:41.000Z (over 3 years ago)
- Last Synced: 2023-08-28T12:14:52.554Z (almost 3 years ago)
- Topics: aws, dynamodb, metrics, monitoring, nosql, serverless
- Language: TypeScript
- Homepage:
- Size: 232 KB
- Stars: 1
- Watchers: 2
- Forks: 0
- Open Issues: 0
-
Metadata Files:
- Readme: README.md
- Contributing: CONTRIBUTING.md
- License: LICENSE.md
- Code of conduct: CODE_OF_CONDUCT.md
Awesome Lists containing this project
README
## Metrics for your DynamoDB Single Table designs!
[](https://img.shields.io/github/actions/workflow/status/sensedeep/dynamodb-metrics/build.yml?branch=main)
[](https://www.npmjs.com/package/dynamodb-metrics)
[](https://www.npmjs.com/package/dynamodb-metrics)
[](https://coveralls.io/github/sensedeep/dynamodb-metrics?branch=main)
DynamoDB Metrics calculates detailed DynamoDB metrics for single table design patterns.
The standard DynamoDB metrics provide basic table and index level metrics. However, when using single-table design patterns, a more detailed set of performance metrics are required.
If you've wondered:
* Which customer tenant is causing the most load and consuming the most RCU/WCU.
* Which app or function is causing the most load and consuming the most RCU/WCU.
* Which single-table entity/model is most loaded and consuming RCU/WCU.
* Which operations are being used the most.
* Which queries are the most inefficient (items vs scanned).
* Who is doing scans (app, function, model).
DynamoDB metrics was created for those with single-table DynamoDB designs who need to understand how their application data entities are performing.
## DynamoDB Metrics Features
* Creates detailed CloudWatch metrics for Tables, Tenants, Indexes, Apps/Functions, Entities and DynamoDB operations
* Emits metrics using [CloudWatch EMF](https://docs.aws.amazon.com/AmazonCloudWatch/latest/monitoring/CloudWatch_Embedded_Metric_Format_Specification.html) for zero-latency metric creation.
* Control which dimensions and additional properties are emitted in the EMF log data.
* Supports AWS V2 and V3 SDKs.
* Easy few line integration.
* Very low CPU and memory impact.
* Supported by the free [SenseDeep Developer Plan](https://www.sensedeep.com/) for graphical DynamoDB single-table monitoring.
* No dependencies.
* Optionally integrates with [SenseLogs](https://www.npmjs.com/settings/sensedeep/packages) for dynamic control of metrics.
* Clean, readable small code base (<400 lines).
* Full TypeScript support.
## Quick Tour
Install the library using npm or yarn.
npm i dynamodb-metrics
Import the DynamoDB Metrics library. If you are not using ES modules or TypeScript, use `require` to import the library.
```javascript
import Metrics from 'dynamodb-metrics'
```
Then create your `Metrics` instance and pass your DynamoDB client as a parameter.
```javascript
const metrics = new Metrics({
client: client,
indexes: {primary: {hash: 'pk', sort: 'sk'}},
separator: '#',
})
```
The `client` should be a DynamoDB client instance. The `indexes` parameter describes the names of your primary and secondary keys. Metrics uses this key description to decode your single-table items.
Read [Single Table Configuration](#single-table-configuration) below for options on how to tell Metrics about your key design.
Metrics will flush metrics by default every 30 seconds or after 100 requests, but you can tailor these defaults via constructor parameters. You can also force out the metrics via `metrics.flush` at any time.
```javascript
metrics.flush()
```
## Initializing the AWS SDK V2, V3 with/without DocumentClient
If using the AWS V2 SDK with the DocumentClient, create your DynamoDB client.
```javascript
import DynamoDB from 'aws-sdk/clients/dynamodb'
client: new DynamoDB.DocumentClient({})
// or if using the AWS V2 SDK with the low level API
const client = new DynamoDB({})
```
If using the AWS V3 SDK, first create the low level client and then create the V3 DocumentClient instance.
```javascript
import { DynamoDBClient } from '@aws-sdk/client-dynamodb'
import { DynamoDBDocumentClient } from '@aws-sdk/lib-dynamodb'
const low = new DynamoDBClient({})
const client = DynamoDBDocumentClient.from(low)
```
## Metrics
DynamoDB Metrics creates the following metrics
* read — Read capacity units consumed
* write — Write capacity units consumed
* latency — Aggregated request latency in milliseconds
* count — Count of items returned
* scanned — Number of items scanned
* requests — Number of API requests issued
DynamoDB Metrics will create these metrics for the following dimensions:
* Table
* Tenant
* Source
* Index
* Model
* Operation
The enabled dimensions by default are: Table, Source, Index, Model and Operation. You can vary the enabled dimensions via the `dimensions` constructor property.
The Table dimension is set to the table Name.
The Tenant dimension is defined via the `Metric` constructor `tenant` parameter. You can set this to any identifying string you like. It is typically set to your customer or tenant ID or name. If unset, it will not be used. Be careful using Tenant with high cardinality data sets. See [Under the Hood](#under-the-hood) for managing CloudWatch metric costs.
The Source dimension is defined via the `Metric` constructor `source` parameter. You can set this to any identifying string you like. It is typically set to your application or function name. If unset, it will default to the name of the executing Lambda function.
The Index dimension is set to `primary` for the primary index and to the name of a Global Secondary Index (GSI) is that is being used.
The Model is the single-table entity name. Read [DynamoDB Single Table Design](https://www.sensedeep.com/blog/posts/2021/dynamodb-singletable-design.html) for background on single table design patterns. The model name is determined based on the keys used or returned in the request. See below for Single Table Configuration.
The operation dimension is set to the DynamoDB operation: getItem, putItem etc.
You can tailor the set of dimensions via the `dimensions` constructor parameter.
## Single Table Configuration
DynamoDB Metrics needs to determine the single-table model/entity for each request so that it can attribute the request to the appropriate entity. And so, Metrics needs to be able to interpret your key attributes in requests and responses. To do this, when constructing the `Metrics` instance you describe your indexes and the hash/sort key separator you are using.
## Model via Separators
If you construct your hash/sort keys with unique prefixes for your single-table entity models, then the separator approach is ideal. Simply set the separator property in the Metric constructor. By default this is set to '#'.
For example, if your hash key format was `MODEL_NAME:ID` then you would set the separator to ':'.
```javascript
const metrics = new Metrics({
indexes,
separator: ':'
})
```
## Model via Callback
If you are using a more complex scheme to encode your single-table entities, then set the `model` callback so you can determine the model name yourself. For example:
```javascript
const metrics = new Metrics({
indexes,
model(operation, params, result) => {
// Custom logic to return the model name. For example:
return Object.values(params.Item[hash])[0].split('#')[0]
}
})
```
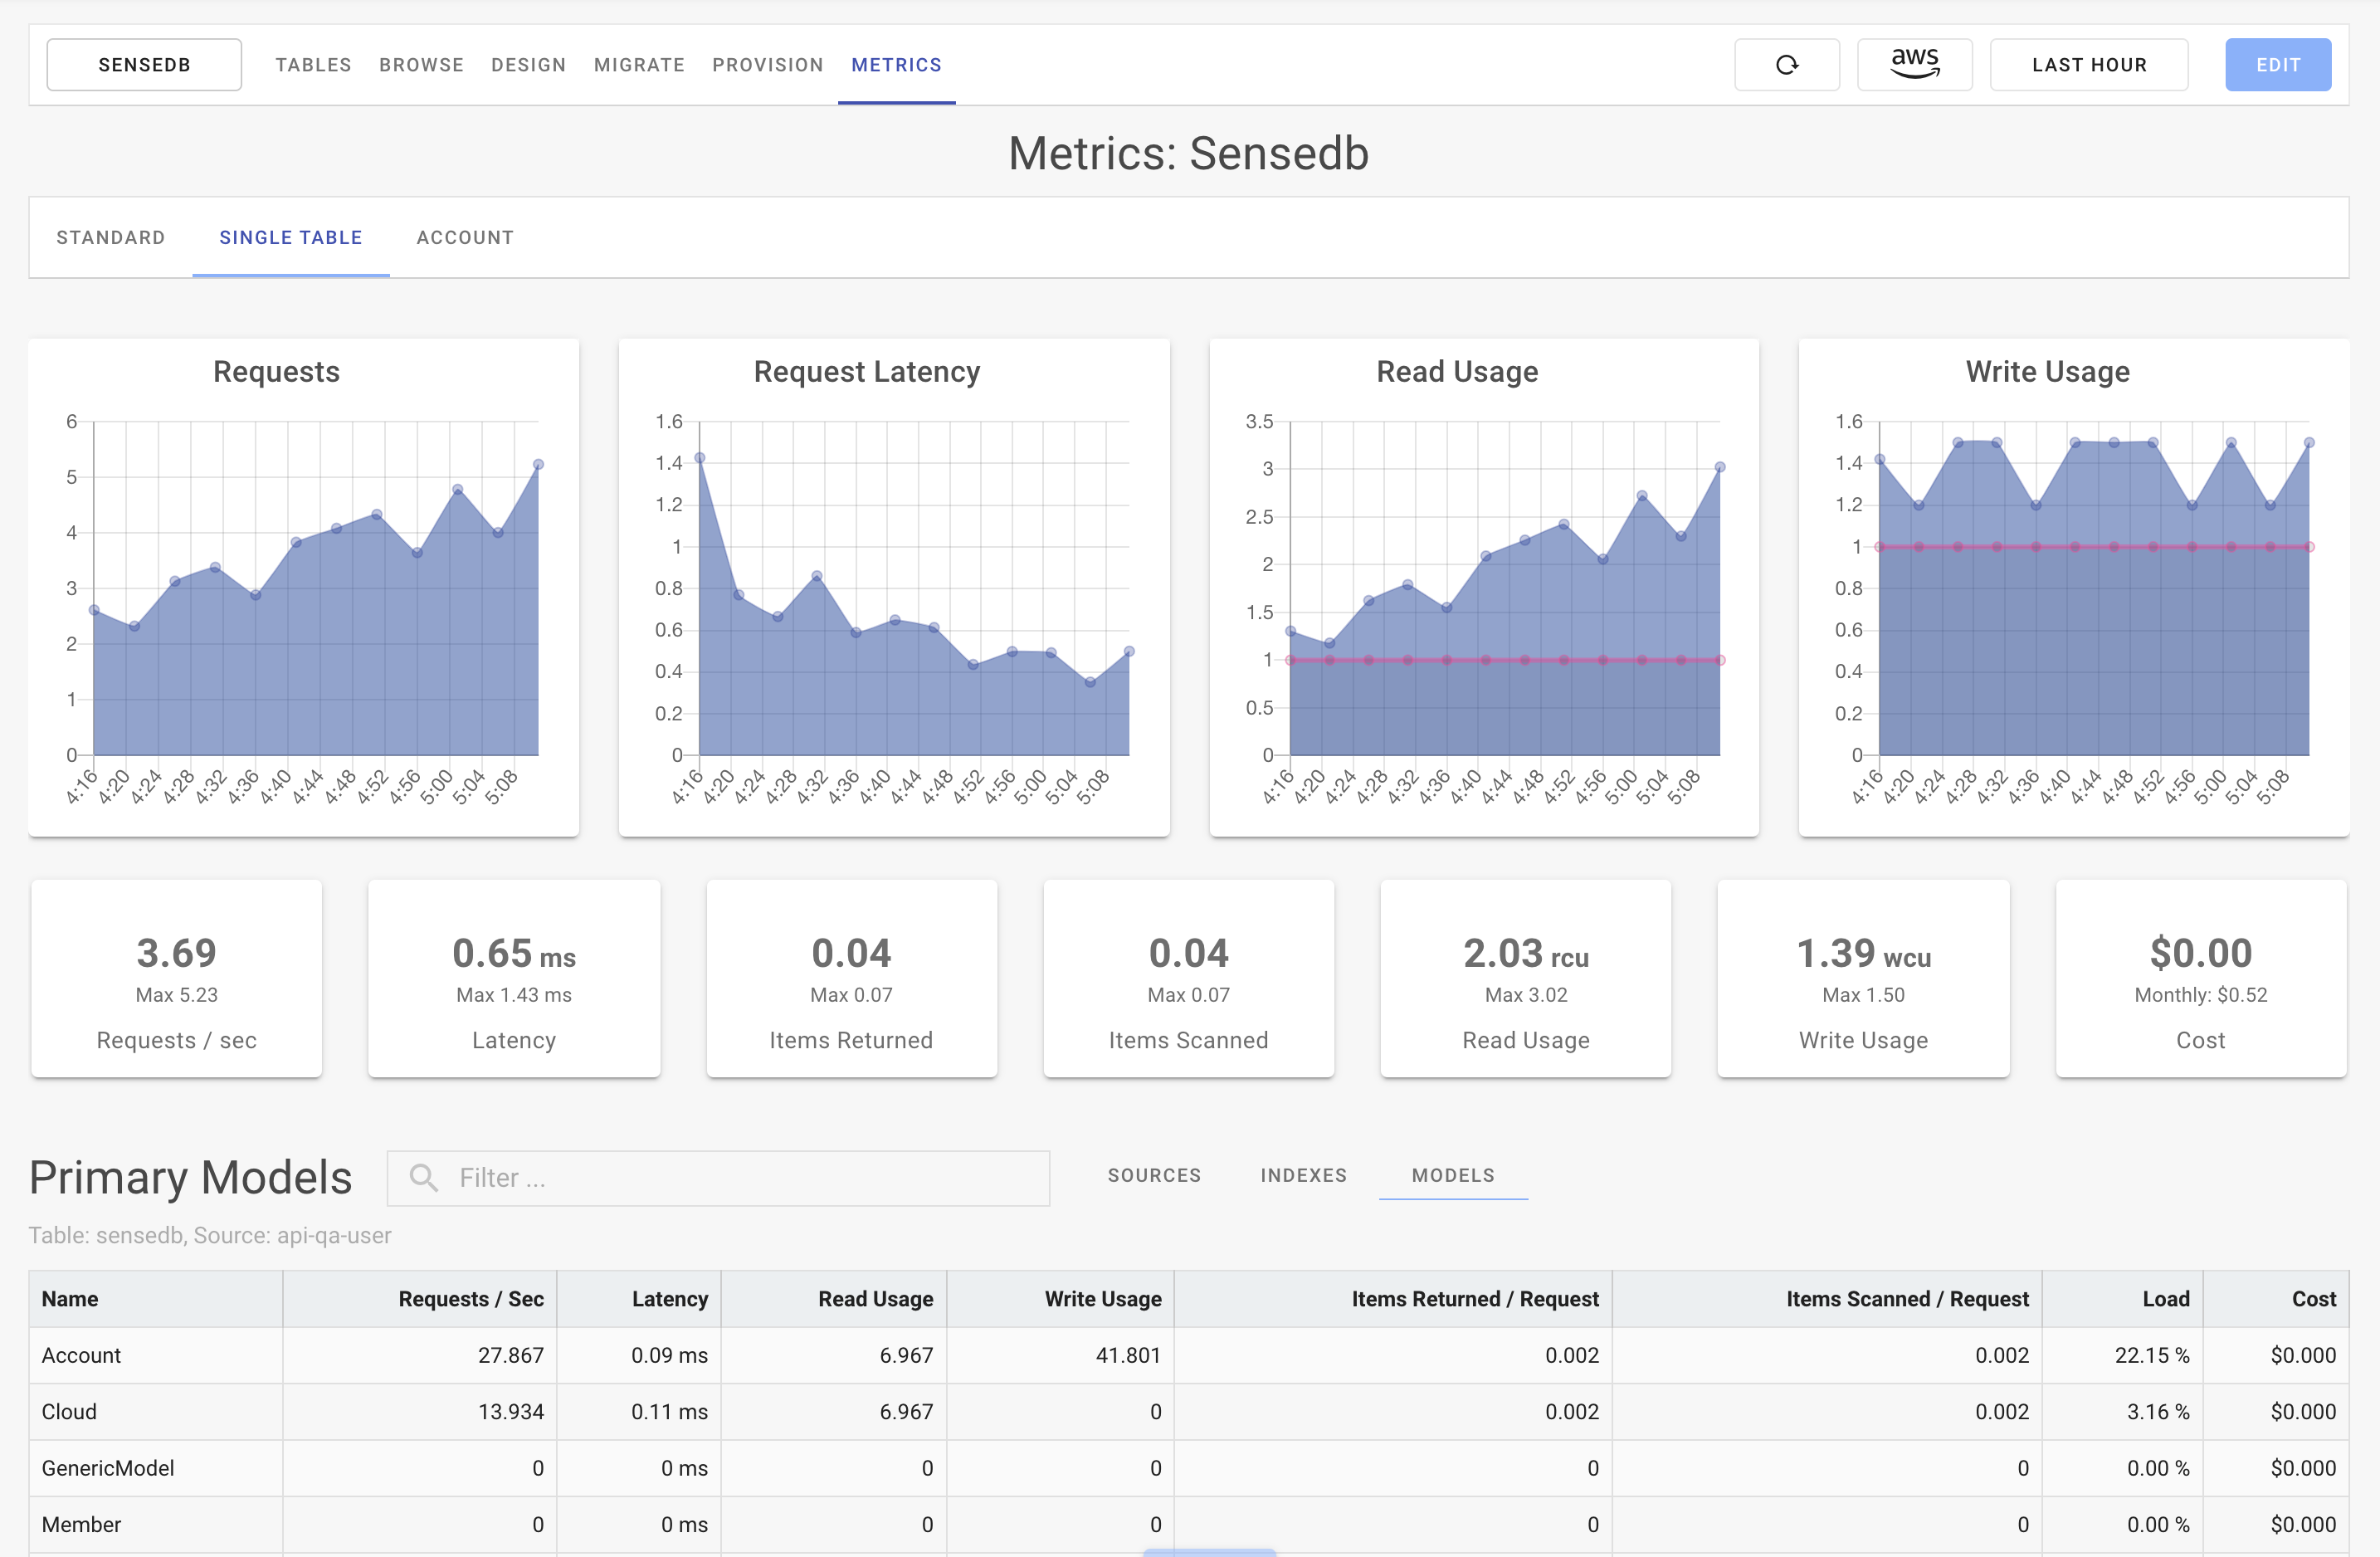
### SenseDeep
[SenseDeep](https://www.sensedeep.com/) offers a free subscription for developers that monitors and graphs the DynamoDB metrics.
Here is a screen shot:
### Metrics Class API
The Metrics class provides the public API.
### Constructor
```javascript
new Metrics(options)
```
The Metrics constructor takes an options map parameter with the following properties.
| Property | Type | Description |
| -------- | :--: | ----------- |
| chan | `string` | If using SenseLogs, this will define the SenseLogs channel to use for the output.|
| client | `DynamoDB client` | Set to an AWS V2 or V3 DynamoDB DocumentClient instance.|
| dimensions | `array` | Ordered array of dimensions to emit. Defaults to [Table, Tenant, Source, Index, Model, Operation].|
| enable | `boolean` | Set to true to enable metrics. Defaults to true.|
| env | `boolean` | Set to true to enable dynamic control via the LOG_FILTER environment variable. Defaults to false.|
| indexes | `map` | Map of indexes supported by the table. The map keys are the names of the indexes. The values are a map of 'hash' and 'sort' attribute names. Must always contain a `primary` element.|
| max | `number` | Maximum number of metric events to buffer before flushing to stdout and on to CloudWatch EMF. Defaults to 100.|
| model | `function` | Set to a function to be invoked to determine the entity model name. Invoked as: `model(operation, params, result)`. Defaults to null.|
| namespace | `string` | Namespace to use for the emitted metrics. Defaults to `SingleTable/Metrics.1`.|
| period | `number` | Number of seconds to buffer metric events before flushing to stdout. Defaults to 30 seconds.|
| properties | `map\|function` | Set to a map of additional properties to be included in EMF log record. These are not metrics. Set to a function that will be invoked as `properties(operation, params, result)` and should return a map of properties. Defaults to null.|
| queries | `boolean` | Set to true to enable per-query profile metrics. Defaults to true.|
| separator | `string` | Separator used between entity/model names in the hash and sort keys. Defaults to '#'.|
| senselogs | `instance` | SenseLogs instance to use to emit the metrics. This permits dynamic control of metrics.|
| source | `string` | Set to an identifying string for the application or function calling DynamoDB. Defaults to the Lambda function name.|
| tenant | `string` | Set to an identifying string for the customer or tenant. Defaults to null.|
For example, every parameter in use:
```javascript
const metrics = new Metrics({
client,
dimensions: ['Table', 'Source', 'Index', 'Model', 'Operations'],
chan: 'metrics',
enable: true,
env: true,
indexes: {
primary: { hash: 'pk', sort: 'sk' },
gs1: { hash: 'gs1pk', sort: 'gs1sk' },
gs2: { hash: 'gs2pk', sort: 'gs2sk' }
},
max: 99,
model: (operation, params, result) => {
// Determine the entity model from the API params
return Object.values(params.Item['pk'])[0].split('#')[0]
},
namespace: 'Acme/Launches',
period: 15 * 1000,
properties: (operation, params, result) => {
// Additional properties to add to the EMF record
return {color: 'red'}
},
queries: true,
separator: '#',
source: 'BigRocket',
tenant: 'Customer-42',
})
```
Metrics can be dynamically controlled by the LOG_FILTER environment variable. If this environment variable contains the string `dbmetrics` and the `env` params is set to true, then Metrics will be enabled. If the `env` parameter is unset, LOG_FILTER will be ignored.
## Profiling Queries
You can also profile queries and scans by setting the `queries` constructor parameter to true and passing a `profile` property to the relevant DynamoDB query or scan command. You can set the profile value to any identifying string to describe the query or scan.
These profile metrics are created under the Profile dimension.
Note: the Profile dimension is separate and is not listed in the `dimensions` constructor parameter.
For example:
```javascript
let items = await client.query({
TableName,
KeyConditionExpression: `pk = :pk`,
ExpressionAttributeValues: {':pk': 'User#42'},
profile: 'test-query',
}).promise()
// or V3
let items = await client.send(new QueryCommand({
TableName,
KeyConditionExpression: `pk = :pk`,
ExpressionAttributeValues: {':pk': 'User#42'},
profile: 'test-query',
}))
```
## Under the Hood
The metric are emitted using the [CloudWatch EMF](https://docs.aws.amazon.com/AmazonCloudWatch/latest/monitoring/CloudWatch_Embedded_Metric_Format_Specification.html) via the `metrics` method. This permits zero-latency creation of metrics without impacting the performance of you Lambdas.
Metrics will only be emitted for dimension combinations that are active. If you have many application entities and indexes, you may end up with a large number of metrics. If your site uses all these dimensions actively, your CloudWatch Metric costs may be high. You will be charged by AWS CloudWatch for the total number of metrics that are active each hour at the rate of $0.30 cents per hour per metric.
If that is the case, you can minimize your cloud watch charges, by reducing the number of dimensions via the `dimensions` property. You could consider disabling the `source` or `operation` dimensions. Alternatively, you should consider using the LOG_FILTER environment variable or [SenseLogs](https://www.npmjs.com/package/senselogs) to dynamically control your metrics.
DynamoDB Metrics are buffered and aggregated to minimize the load on your system. If a Lambda function is reclaimed by AWS Lambda, there may be a few metric requests that are not emitted before the function is reclaimed. This should be a very small percentage and should not significantly impact the quality of the metrics. You can control this buffering via the `max` and `period` parameters.
### Methods
#### flush()
Flush any buffered metrics to stdout. By default, Metrics will flush buffered metrics every 30 seconds or after 100 requests. This parameters are controlled by the Metrics `period` and `max` constructor parameters.
### References
- [DynamoDB Metrics Sample](https://github.com/sensedeep/dynamodb-metrics/tree/main/samples/overview)
- [SenseDeep Blog](https://www.sensedeep.com/blog/)
- [SenseDeep Web Site](https://www.sensedeep.com/)
- [SenseDeep Developer Studio](https://app.sensedeep.com/)
### Participate
All feedback, discussion, contributions and bug reports are very welcome.
* [discussions](https://github.com/sensedeep/dynamodb-metrics/discussions)
* [issues](https://github.com/sensedeep/dynamodb-metrics/issues)
### Contact
You can contact me (Michael O'Brien) on Twitter at: [@mobstream](https://twitter.com/mobstream), or [email](mob-pub-18@sensedeep.com) and ready my [Blog](https://www.sensedeep.com/blog).
### SenseDeep
The best way to monitor DynamoDB is via the Serverless Developer Studio [SenseDeep](https://www.sensedeep.com/).