https://github.com/sergeimakarovv/solar-panel-detection
Applying deep learning models to detect solar panel installations in satellite imagery and estimating their generation capacity
https://github.com/sergeimakarovv/solar-panel-detection
albumentations convolutional-neural-networks deep-learning geopandas pandas pvlib python pytorch rasterio scikit-learn wms-service
Last synced: 2 months ago
JSON representation
Applying deep learning models to detect solar panel installations in satellite imagery and estimating their generation capacity
- Host: GitHub
- URL: https://github.com/sergeimakarovv/solar-panel-detection
- Owner: sergeimakarovv
- Created: 2025-08-12T14:53:22.000Z (11 months ago)
- Default Branch: main
- Last Pushed: 2025-08-12T16:36:18.000Z (11 months ago)
- Last Synced: 2025-08-12T18:31:37.626Z (11 months ago)
- Topics: albumentations, convolutional-neural-networks, deep-learning, geopandas, pandas, pvlib, python, pytorch, rasterio, scikit-learn, wms-service
- Homepage:
- Size: 2.93 KB
- Stars: 0
- Watchers: 0
- Forks: 0
- Open Issues: 0
-
Metadata Files:
- Readme: README.md
Awesome Lists containing this project
README
# Solar Panel Detection
### **Description:**
The project is aimed to evaluate different deep learning network configurations in detecting solar panel installations in satellite imagery and estimate their generation capacity. The methodology includes data collection, data preprocessing, model training and performance evaluation. Pixel-wise binary masks were generated based on the intersection of the images with existing geospatial data of solar panel locations. Fully convolutional network architectures (**U-Net, FPN and PSPNet**) with different encoder backbones (**EfficientNet-B5, ResNet-50, MiT-B3**) were trained on a custom dataset consisting of low-resolution satellite images of the state of **Brandenburg in Germany**. Model performance was evaluated using several standard metrics suitable for segmentation tasks. Finally, the best-performing model configuration was selected for solar panel identification in the satellite imagery of the entire state. Then solar energy generation capacity was estimated using the proposed method.
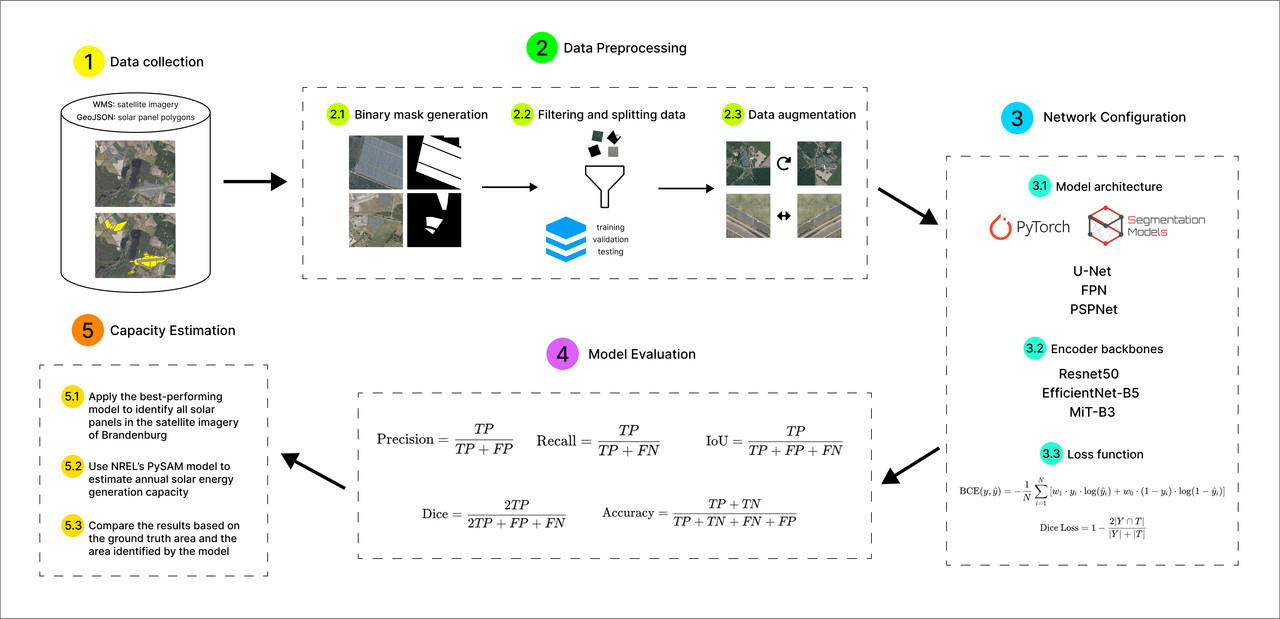
*Figure 1 - Methodology outline*
### **Data sources:**
- [German state boundaries](https://gdz.bkg.bund.de/index.php/default/verwaltungsgebiete-1-250-000-stand-01-01-vg250-01-01.html)
- [Solar panel polygons](https://www.mdpi.com/2306-5729/7/9/128#B8-data-07-00128)
- [WMS satellite imagery](https://isk.geobasis-bb.de/mapproxy/dop20c/service/wms)
### **Python tools used:**
- GIS processing: `geopandas, rasterio, owslib`
- Data handling: `pandas, numpy`
- Deep Learning: `pytorch, segmentation_models_pytorch, albumentations, scikit-learn`
- Visulalization: `matplotlib, plotly, PIL`
- Solar capacity estimation: `PySAM, pvlib`
### **Project overview:**
**1. Data collection**
Download German state boundaries and solar panel polygons annotated in Germany. Create tiles sized 512 x 512 m and extract corresponding satellite images using Web Map Service.
**2. Mask generation**
Generate binary masks for each tile and assign a class to each pixel (1 - solar panel, 2 - background).
**3. Data filtering and splitting**
Since there are too many images that contain only the background and thus create noise, select only those that contain solar panels and an equal number of background-only images to ensure data balance. Split the data into training, validation and testing sets.
**4. Data augmentation**
Apply data augmentation techniques: horizontal flipping, image rotation, shift-scaling transformations and normalization with ImageNet stats.
**5. Model training**
Create a custom PyTorch dataset loader for images and masks. Initialize deep learning models with different architectures (*U-Net, FPN and PSPNet*) and encoder backbones (*EfficientNet-B5, ResNet-50, MiT-B3*). Define loss functions (*Dice Loss* and *Binary Cross Entropy Loss*) with adding a balanced weight to the positive class. Train and validate the configured models (better using GPU).
**6. Performance evaluation**
Evaluate the models' segmentation performance using 5 different metrics: *accuracy, precision, recall, dice coefficient, IoU score (Intersection over Union)*. Visualize sample predictions using the best-performing model and plot the train and validation loss curves.
**7. Capacity estimation**
Calculate the resulting area of the identified solar panels in Brandenburg. Estimate the solar generation capacity using the PySAM model.
### **Sample results**
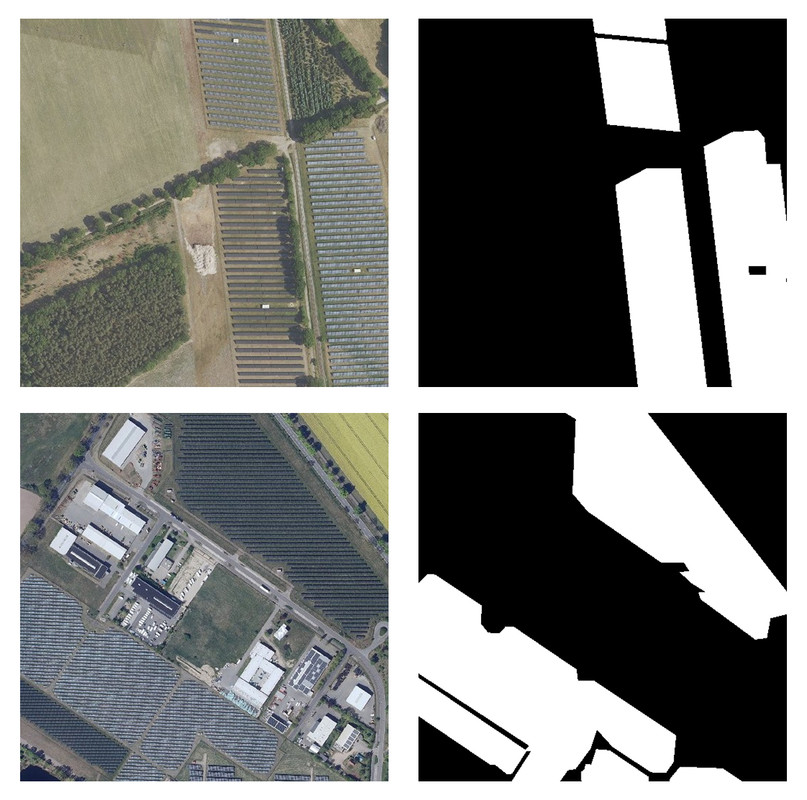
*Figure 2 - Mask generation*
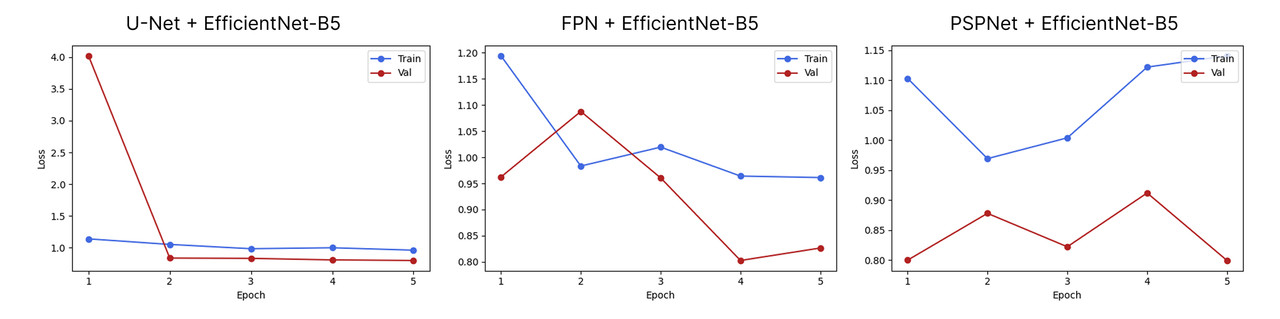
*Figure 3 - Loss curves*
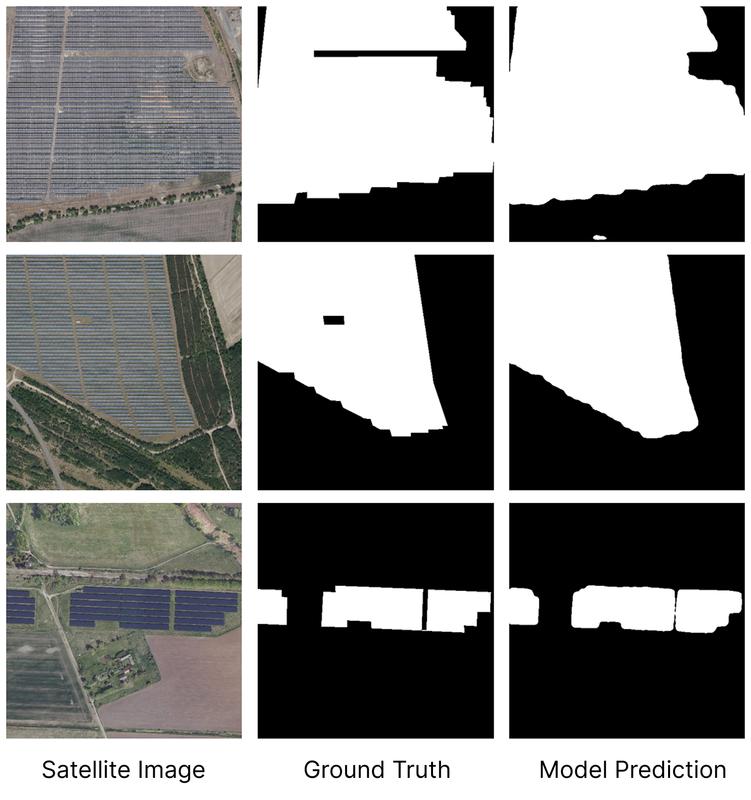
*Figure 4 - Predictions using U-Net with EfficientNet-B5 backbone*
## **Notes**
All the input data, trained models, JSON files with losses and evaluation metrics can be found in [**Google Drive**](https://drive.google.com/drive/folders/10p3SCaN2at0BQcw9AK6mUX1jUAQTx9J_?usp=sharing)
How to run the code:
- Ensure to download the necessary packages as in `requirements.txt`
- Download the data from the mentioned sources (or from the Google Drive)
- Define your own project folder path
- Make sure to use a PyTorch version compatible with the GPU