https://github.com/sgratzl/chartjs-chart-boxplot
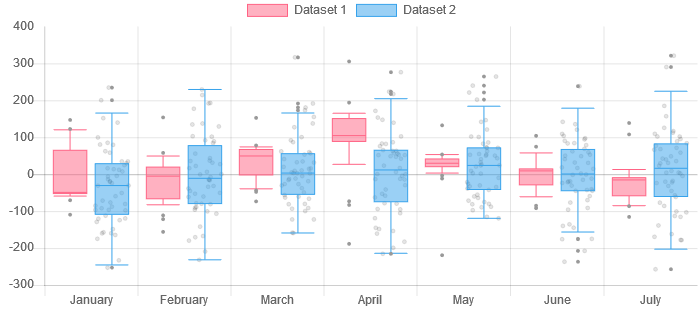
Chart.js Box Plots and Violin Plot Charts
https://github.com/sgratzl/chartjs-chart-boxplot
boxplot charting-boxplots chartjs chartjs-plugin javascript violinplot
Last synced: 10 months ago
JSON representation
Chart.js Box Plots and Violin Plot Charts
- Host: GitHub
- URL: https://github.com/sgratzl/chartjs-chart-boxplot
- Owner: sgratzl
- License: mit
- Created: 2020-04-14T16:08:24.000Z (almost 6 years ago)
- Default Branch: main
- Last Pushed: 2024-10-20T17:11:06.000Z (over 1 year ago)
- Last Synced: 2024-10-22T23:53:14.093Z (over 1 year ago)
- Topics: boxplot, charting-boxplots, chartjs, chartjs-plugin, javascript, violinplot
- Language: TypeScript
- Homepage: https://www.sgratzl.com/chartjs-chart-boxplot/
- Size: 15 MB
- Stars: 109
- Watchers: 4
- Forks: 24
- Open Issues: 3
-
Metadata Files:
- Readme: README.md
- Funding: .github/FUNDING.yml
- License: LICENSE
Awesome Lists containing this project
- awesome - boxplot
README
# Chart.js Box and Violin Plot
[![License: MIT][mit-image]][mit-url] [![NPM Package][npm-image]][npm-url] [![Github Actions][github-actions-image]][github-actions-url]
Chart.js module for charting box and violin plots. This is a maintained fork of [@datavisyn/chartjs-chart-box-and-violin-plot](https://github.com/datavisyn/chartjs-chart-box-and-violin-plot), which I originally developed during my time at datavisyn.


## Install
```bash
npm install chart.js @sgratzl/chartjs-chart-boxplot
```
## Usage
see [Examples](https://www.sgratzl.com/chartjs-chart-boxplot/examples/)
and [![Open in CodePen][codepen]](https://codepen.io/sgratzl/pen/QxoLoY)
## Chart
four new types: `boxplot` and `violin`.
## Config
The config can be done on a per dataset `.data.datasets[0].minStats` or for all datasets under the controllers name. e.g., `.options.boxplot.datasets.minStats`.
see https://github.com/sgratzl/chartjs-chart-boxplot/blob/dev/src/data.ts#L100-L147
## Data structure
Both types support that the data is given as an array of numbers `number[]`. The statistics will be automatically computed. In addition, specific summary data structures are supported:
see https://github.com/sgratzl/chartjs-chart-boxplot/blob/dev/src/data.ts#L24-L49
## Tooltips
In order to simplify the customization of the tooltips the tooltip item given to the tooltip callbacks was improved. The default `toString()` behavior should be fine in most cases. The tooltip item has the following structure:
```ts
interface ITooltipItem {
label: string; // original
value: {
raw: IBoxPlotItem | IViolinItem;
/**
* in case an outlier is hovered this will contains its index
* @default -1
*/
hoveredOutlierRadius: number;
/**
* toString function with a proper default implementation, which is used implicitly
*/
toString(): string;
min: string;
median: string;
max: string;
items?: string[];
//... the formatted version of different attributes IBoxPlotItem or ViolinItem
};
}
```
## ESM and Tree Shaking
The ESM build of the library supports tree shaking thus having no side effects. As a consequence the chart.js library won't be automatically manipulated nor new controllers automatically registered. One has to manually import and register them.
Variant A:
```js
import { Chart, LinearScale, CategoryScale } from 'chart.js';
import { BoxPlotController, BoxAndWiskers } from '@sgratzl/chartjs-chart-boxplot';
// register controller in chart.js and ensure the defaults are set
Chart.register(BoxPlotController, BoxAndWiskers, LinearScale, CategoryScale);
...
new Chart(ctx, {
type: 'boxplot',
data: [...],
});
```
Variant B:
```js
import { BoxPlotChart } from '@sgratzl/chartjs-chart-boxplot';
new BoxPlotChart(ctx, {
data: [...],
});
```
## Related Plugins
Check out also my other chart.js plugins:
- [chartjs-chart-error-bars](https://github.com/sgratzl/chartjs-chart-error-bars) for rendering errors bars to bars and line charts
- [chartjs-chart-geo](https://github.com/sgratzl/chartjs-chart-geo) for rendering map, bubble maps, and choropleth charts
- [chartjs-chart-graph](https://github.com/sgratzl/chartjs-chart-graph) for rendering graphs, trees, and networks
- [chartjs-chart-pcp](https://github.com/sgratzl/chartjs-chart-pcp) for rendering parallel coordinate plots
- [chartjs-chart-venn](https://github.com/sgratzl/chartjs-chart-venn) for rendering venn and euler diagrams
- [chartjs-chart-wordcloud](https://github.com/sgratzl/chartjs-chart-wordcloud) for rendering word clouds
- [chartjs-plugin-hierarchical](https://github.com/sgratzl/chartjs-plugin-hierarchical) for rendering hierarchical categorical axes which can be expanded and collapsed
## Development Environment
```sh
npm i -g yarn
yarn install
yarn sdks vscode
```
### Common commands
```sh
yarn compile
yarn test
yarn lint
yarn fix
yarn build
yarn docs
```
## Credits
Original credits belong to [@datavisyn](https://www.datavisyn.io).
[mit-image]: https://img.shields.io/badge/License-MIT-yellow.svg
[mit-url]: https://opensource.org/licenses/MIT
[npm-image]: https://badge.fury.io/js/%40sgratzl%2Fchartjs-chart-boxplot.svg
[npm-url]: https://npmjs.org/package/@sgratzl/chartjs-chart-boxplot
[github-actions-image]: https://github.com/sgratzl/chartjs-chart-boxplot/workflows/ci/badge.svg
[github-actions-url]: https://github.com/sgratzl/chartjs-chart-boxplot/actions
[codepen]: https://img.shields.io/badge/CodePen-open-blue?logo=codepen