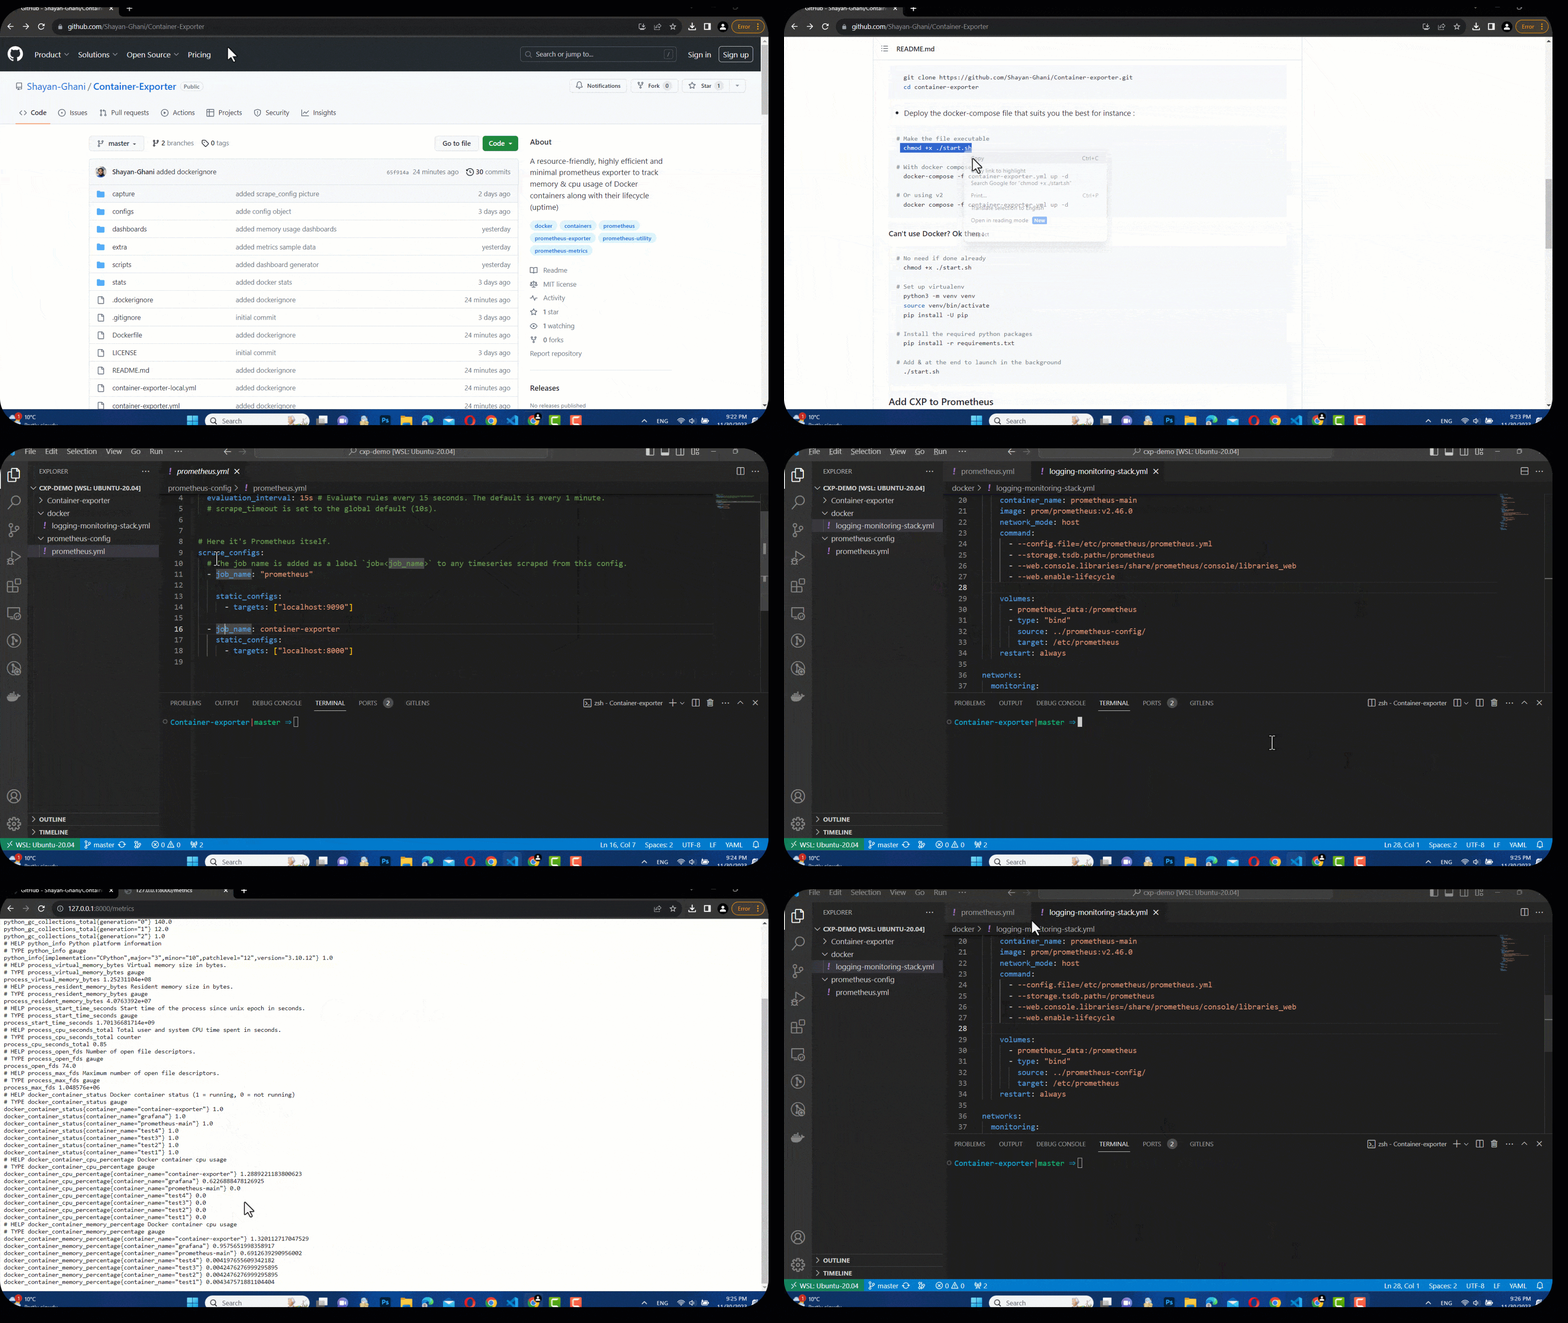
https://github.com/shayan-ghani/container-exporter
A resource-friendly, highly efficient, and minimal Prometheus exporter to track Memory, CPU, Disk and Network I/O usage of Docker containers along with their lifecycle (status).
https://github.com/shayan-ghani/container-exporter
container-exporter containers cxp docker docker-prometheus prometheus prometheus-exporter prometheus-metrics prometheus-utility
Last synced: 6 months ago
JSON representation
A resource-friendly, highly efficient, and minimal Prometheus exporter to track Memory, CPU, Disk and Network I/O usage of Docker containers along with their lifecycle (status).
- Host: GitHub
- URL: https://github.com/shayan-ghani/container-exporter
- Owner: Shayan-Ghani
- License: mit
- Created: 2023-11-27T11:32:17.000Z (almost 2 years ago)
- Default Branch: master
- Last Pushed: 2025-05-02T16:12:37.000Z (7 months ago)
- Last Synced: 2025-05-02T16:46:48.382Z (7 months ago)
- Topics: container-exporter, containers, cxp, docker, docker-prometheus, prometheus, prometheus-exporter, prometheus-metrics, prometheus-utility
- Language: Python
- Homepage:
- Size: 16.3 MB
- Stars: 58
- Watchers: 1
- Forks: 5
- Open Issues: 0
-
Metadata Files:
- Readme: README.md
- Changelog: CHANGELOG.md
- License: LICENSE
Awesome Lists containing this project
README
# 🚀 Container Exporter (CXP)
A resource-friendly, highly efficient, and minimal Prometheus exporter to track Memory, CPU, Disk and Network I/O usage of Docker containers along with their lifecycle (uptime).
## Table of Contents
1. [DEV STACK](#%EF%B8%8F-dev-stack)
2. [DEMO](#-demo)
3. [Step-by-Step Guide](#-step-by-step-guide)
1. [Before You start](#before-you-start)
2. [Getting started](#getting-started)
- [Deploy with Github Actions](#-deploy-with-github-actions)
- [Deploy with Docker](#-deploy-with-docker)
- [Deploy without Docker](#-cant-use-docker-ok-then-)
- [Run with a Custom Port](#-run-with-a-custom-port)
3. [Add CXP to Prometheus](#-add-cxp-to-prometheus)
4. [Grafana Dashboards](#-grafana-dashboards)
5. [TO-DO](#to-do)
6. [Contributions](#contributions)
7. [Contact Information](#contact-information)
## 🛠️ DEV STACK
    
see a sample of the metrics page in [here](./extra/metrics.txt).
## 🎥 DEMO

## 📋 Step-by-Step Guide
### Before You start
- Port 8000 must be open (default port)
- Docker & Docker Compose should be installed (optional)
- The presence of Git and Python3.10
### Getting started
#### ⚙️ Deploy with Github Actions
- fork the repository.
- go to the fork repository and switch to `Action` tab.
- click the `I understand my workflows, go ahead and enable them` button.
- now you have access to all of the workflows, **however make sure you change the secrets listed below accordingly**:
1. `secretes.DOCKER_TOKEN` : the personal access token docker hub of your(or your organization) account.
2. `secretes.GHCR_TOKEN` : github classic access token with (packages read:write permissions) or just simply use `${{github.token}}`. [help](https://docs.github.com/en/authentication/keeping-your-account-and-data-secure/managing-your-personal-access-tokens)
*here's how workflows work:*
- on push to `master` the project will be `built`, `deployed` and `released`.
*since deploying to your servers requires runner configuration it must be triggered manually, you can modify its behavior on `cd.yml` workflow.*
- on push to any branch **except for** `master` code will be `built` and `healthchecked`
- on pr the project will be `healthchecked` and `built`.
*double check the required variables and secrets to prevent any unexpected failures*
#### 🐳 Deploy with Docker
- clone and checkout to the repository using the following commands:
```bash
git clone https://github.com/Shayan-Ghani/Container-exporter.git
cd Container-Exporter
```
- Deploy the docker-compose file that suits you the best for instance :
```bash
# Make the file executable
chmod +x ./start.sh
# With docker compose v1
docker-compose -f container-exporter.yml up -d
# Or using v2
docker compose -f container-exporter.yml up -d
# build from base with Dockerfile
docker-compose -f container-exporter-local.yml up --build -d
```
#### 🐍 Can't use Docker? Ok then :
```bash
# No need if done already
chmod +x ./start.sh
# Set up virtualenv
python3 -m venv venv
source venv/bin/activate
pip install -U pip
# Install the required python packages
pip install -r requirements.txt
# start the initializer script.
./start.sh &
```
You can use nohup as well :
```
nohup ./start.sh -out ./nohup.out
# to stop cxp without docker use this command
kill -9
```
Replace `` with the pid of ./start.sh script.
#### 🚢 Run With A Custom Port:
```bash
./start.sh &
```
Change `` with a port of your choice.
### 🔥 Add CXP to Prometheus
- Edit your `prometheus.yml` file and add the address of container-exporter in scrape_configs:

- Reload or restart your Prometheus server and reach out to `http://127.0.0.1:8000/metrics`
### That is it you are good to go, Enjoy Using CXP! "}"
## 📊 Grafana Dashboards
Check out [dashboards](./dashboards) directory for Json files. including CPU & Memory usage + containers status (uptime).
**Change `Your Prometheus data source uid` with the uid of Prometheus data source uid. you can find it this way:**
- Reach out to Grafana then enter `Home > Administration > Data sources` then click on your Prometheus data source.
- the characters after `datasources/edit/` are your uid. (e.g datasources/edit/**c8e586ac-4262-4aad5-a103-1240ss826424**)
- alternatively, use `dashboard-gen.sh` script to change the dashboards' uid by providing the uid as the first argument of the script. do the following steps:
```
cd scripts && bash dashboard-gen.sh
```
- replace `` with your Prometheus datasource uid.
- now head to Grafana dashboards and hit `new > import` then copy the dashboard Json file and paste it into `Import via panel json`
- hit the `load` button and Done!
## TO-DO
- [x] Disk I/O usage
- [x] Network I/O Usage
- [x] Add metrics in units of byte
- [x] Check and Unregister *stat* metrics for containers that are not running
- [ ] Design grafana dashboards and share them on grafana cloud
- [ ] Design and develop a static website to showcase Documentation, new features, etc.
## Contributions
Welcome to CXP! This project is currently in an experimental yet stable version, and we encourage contributions to enhance its functionality, optimize code, and add new features
Feel free to contribute in any wacacy you can. If you come across a bug or have a suggestion, please don't hesitate to file an issue. Your input is valuable and helps us improve CXP for everyone; Therefore, add any desired function or feature to TO DO section. We appreciate your contribution to making CXP even better! If you have any questions or need assistance, feel free to reach out. Thank you!
- If you want to add metrics to cxp, make sure the naming convention is conformed to. (`cxp_metric_name`)