https://github.com/shians/glimma
Glimma R package
https://github.com/shians/glimma
interactive-visualizations plot r
Last synced: 10 months ago
JSON representation
Glimma R package
- Host: GitHub
- URL: https://github.com/shians/glimma
- Owner: Shians
- License: lgpl-3.0
- Created: 2015-12-22T05:49:22.000Z (over 10 years ago)
- Default Branch: master
- Last Pushed: 2020-04-22T01:11:28.000Z (about 6 years ago)
- Last Synced: 2023-10-20T23:06:20.827Z (over 2 years ago)
- Topics: interactive-visualizations, plot, r
- Language: R
- Size: 24.1 MB
- Stars: 48
- Watchers: 6
- Forks: 10
- Open Issues: 40
-
Metadata Files:
- Readme: README.md
- License: LICENSE
Awesome Lists containing this project
README
Master | Devel
--- | ---
[](https://travis-ci.org/Shians/Glimma) | [](https://travis-ci.org/Shians/Glimma)
[](https://codecov.io/gh/Shians/Glimma) | [](https://codecov.io/gh/Shians/Glimma)
# PROJECT HAS MOVED
Development of Glimma has been moved to https://github.com/hasaru-k/GlimmaV2
This repository has been archived.
# Glimma
Welcome to Glimma, a R package for creating interactive plots for differential expression analysis.
User suggestions are very welcome, please start an issue for usability improvements or features you'd like to see!
# Installation
### Using BioConductor
This is the recommended method for installing Glimma. The release version can be installed by running the code below:
```r
source("https://bioconductor.org/biocLite.R")
biocLite("Glimma")
```
If a more recent version is required the developmental version:
```r
source("https://bioconductor.org/biocLite.R")
useDevel()
biocLite("Glimma")
```
# Bug reports
If you find bugs please let me know by submitting an issue to this project. If possible please provide a small runnable example demonstrating the bug, operating system and R version.
# Features
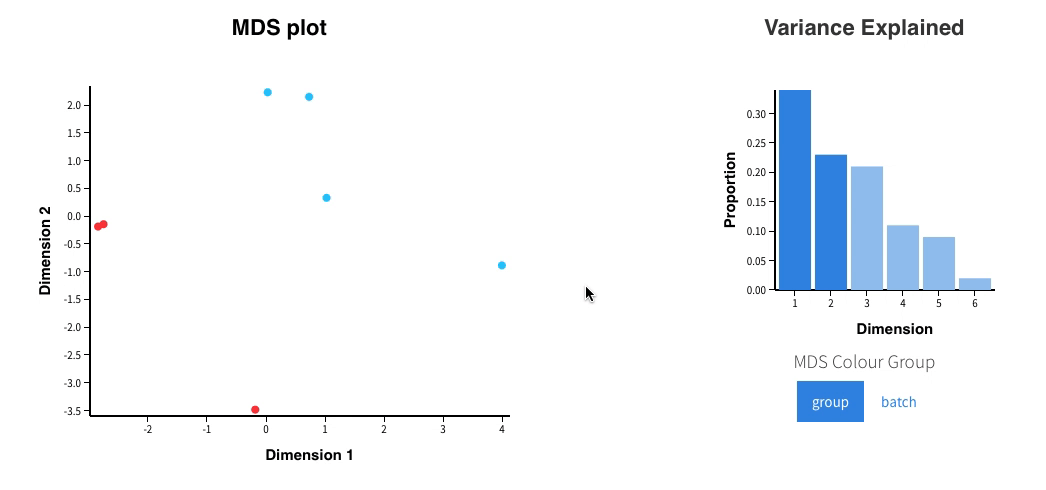
## MDS Plots
### Changing dimensions to plots
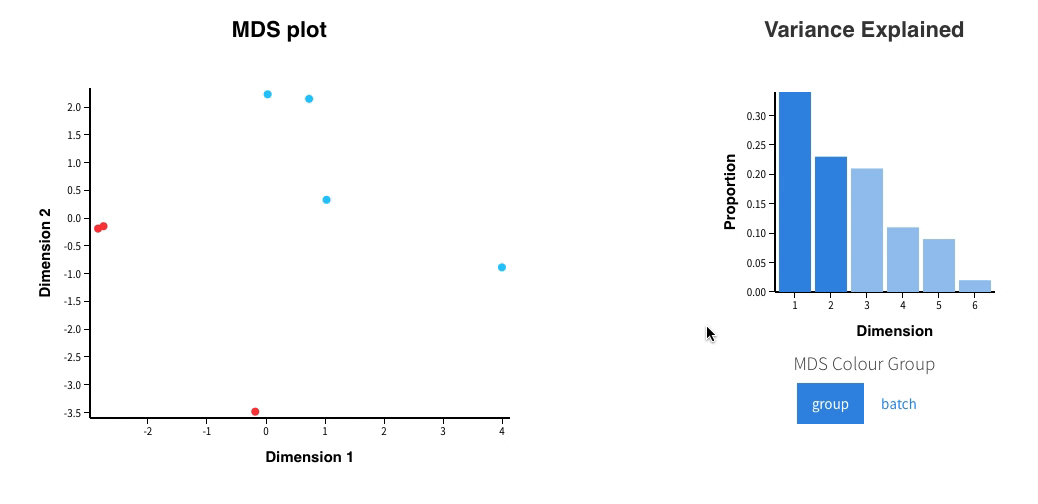
### Changing conditions to colour by
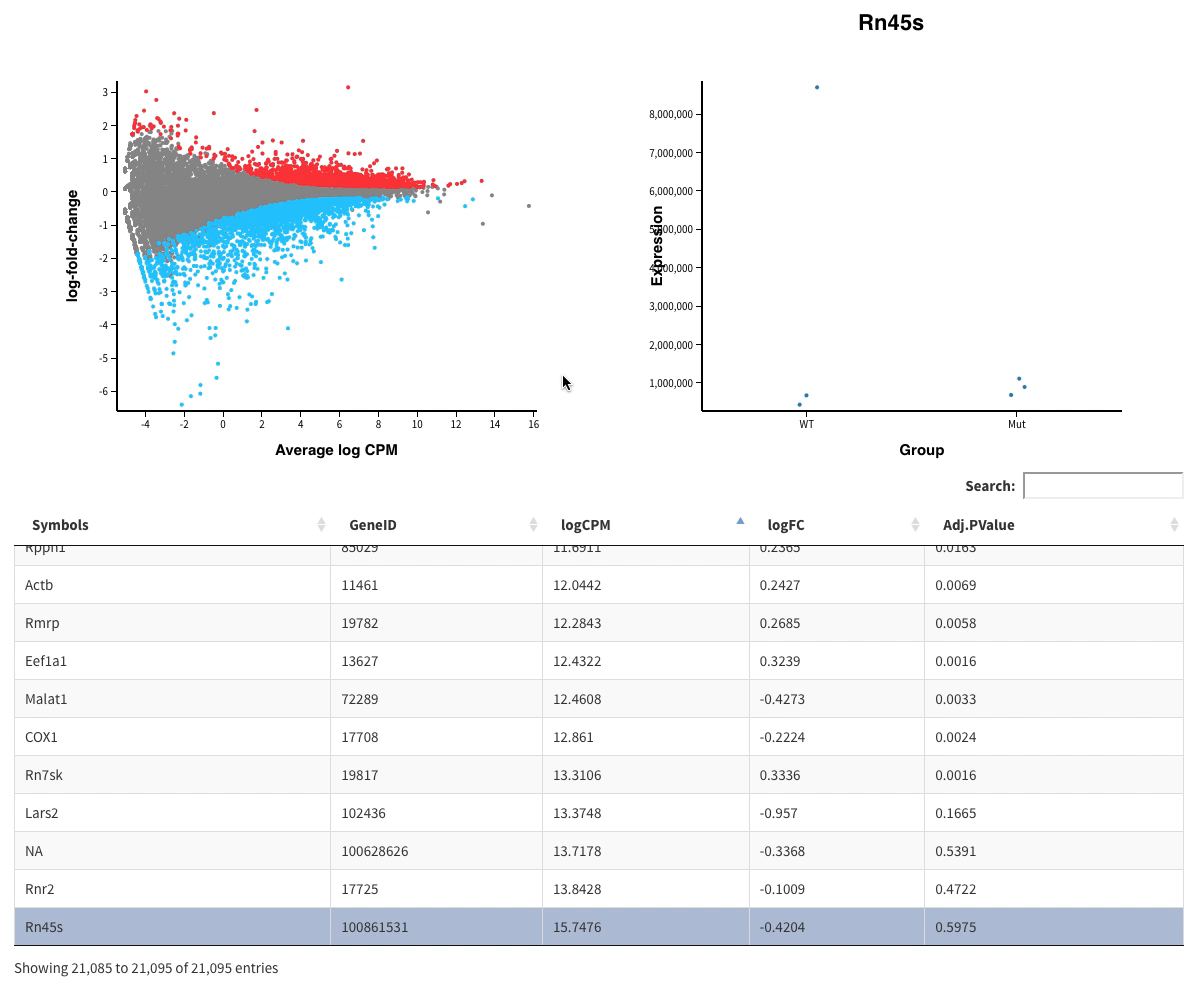
## MD Plot
### Hovering over points
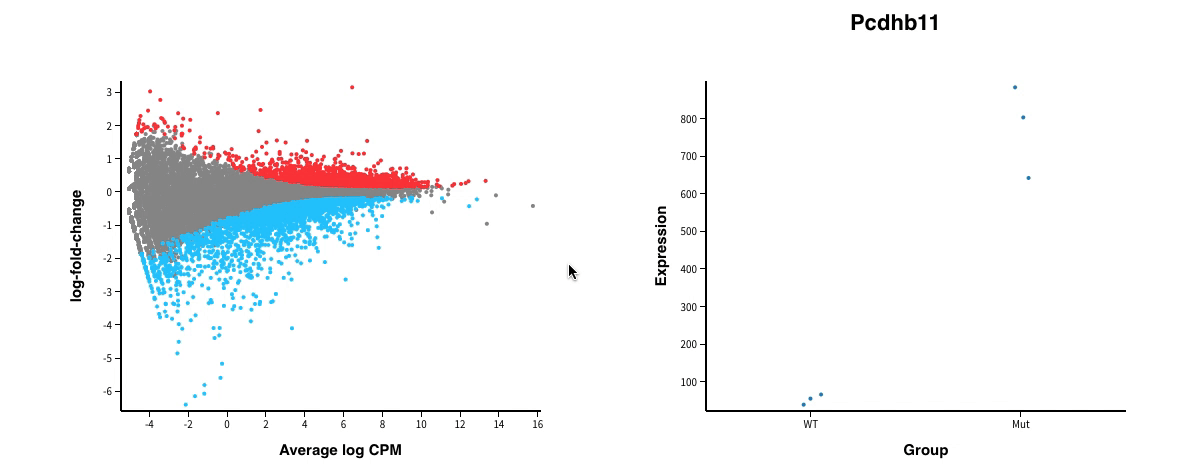
### Clicking points
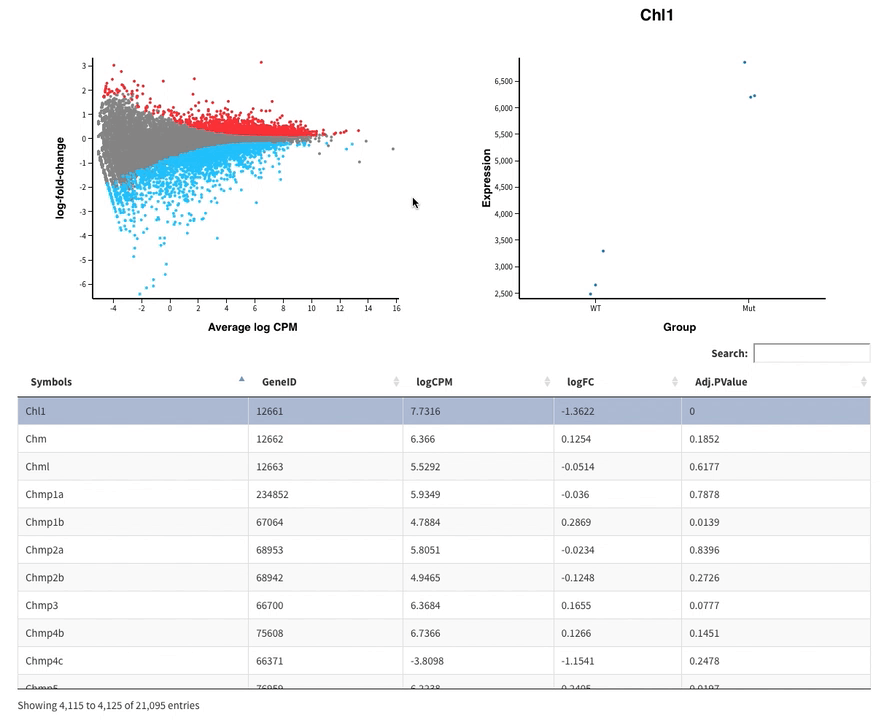
### Clicking on table entries