https://github.com/shiro46mt/plot-highlight
https://github.com/shiro46mt/plot-highlight
matplotlib python-package seaborn
Last synced: 18 days ago
JSON representation
- Host: GitHub
- URL: https://github.com/shiro46mt/plot-highlight
- Owner: shiro46mt
- License: mit
- Created: 2023-09-30T13:07:53.000Z (over 2 years ago)
- Default Branch: main
- Last Pushed: 2023-09-30T13:08:13.000Z (over 2 years ago)
- Last Synced: 2025-02-27T06:04:11.043Z (over 1 year ago)
- Topics: matplotlib, python-package, seaborn
- Language: Jupyter Notebook
- Homepage: https://pypi.org/project/plot-highlight/
- Size: 364 KB
- Stars: 0
- Watchers: 1
- Forks: 0
- Open Issues: 0
-
Metadata Files:
- Readme: README.md
- License: LICENSE
Awesome Lists containing this project
README
# Plot Highlight
plot_highlight is a Python visualization library based on [seaborn](https://seaborn.pydata.org).
This liblary is inspired by [gghighlight](https://yutannihilation.github.io/gghighlight/) package in R.
# Installation
Use pip
```
pip install plot-highlight
```
# Usage
Draw seaborn charts, highlighting the specific items.
The following seaborn functions are supported.
- `sns.scatterplot`
- `sns.lineplot`
- `sns.histplot`
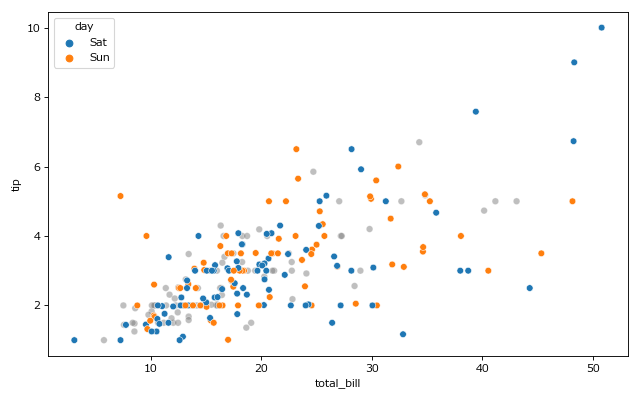
## 📊 Scatter plot with highlight
```python
import seaborn as sns
df = sns.load_dataset('tips')
import plot_highlight as phl
phl.scatterplot(data=df, x='total_bill', y='tip', hue='day', highlights=['Sat', 'Sun'])
```
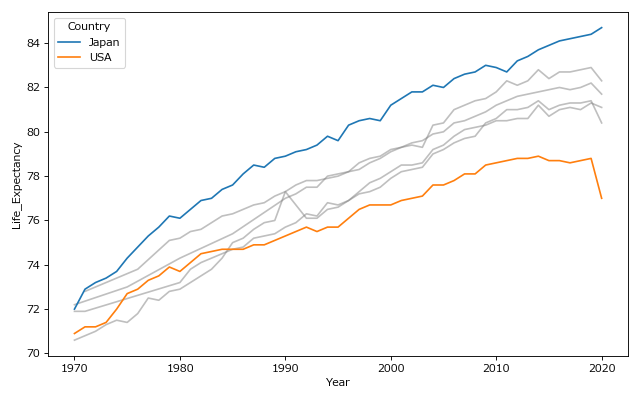
## 📊 Line plot with highlight
```python
import seaborn as sns
df = sns.load_dataset('healthexp')
import plot_highlight as phl
phl.lineplot(data=df, x='Year', y='Life_Expectancy', hue='Country', highlights=['Japan', 'USA'])
```
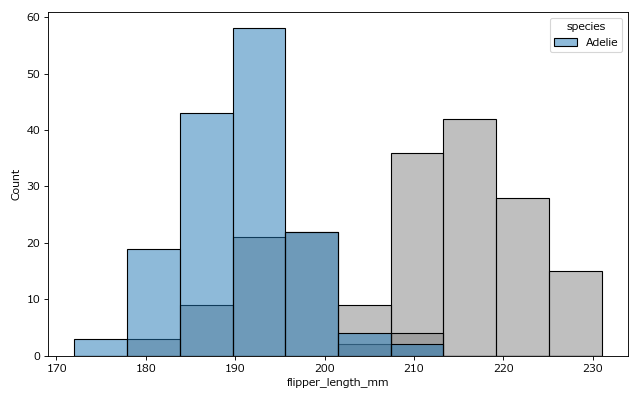
## 📊 Histgram with highlight
```python
import seaborn as sns
df = sns.load_dataset('penguins')
import plot_highlight as phl
phl.histplot(data=df, x='flipper_length_mm', hue='species', highlights='Adelie')
```
# License
This software is released under the MIT License, see LICENSE.