https://github.com/shuding/pingdash
A simple dashboard.
https://github.com/shuding/pingdash
dashboard monitoring-server
Last synced: 9 months ago
JSON representation
A simple dashboard.
- Host: GitHub
- URL: https://github.com/shuding/pingdash
- Owner: shuding
- License: mit
- Created: 2016-12-01T08:25:07.000Z (over 9 years ago)
- Default Branch: master
- Last Pushed: 2017-09-07T06:41:13.000Z (almost 9 years ago)
- Last Synced: 2025-07-08T18:21:33.872Z (12 months ago)
- Topics: dashboard, monitoring-server
- Language: JavaScript
- Homepage: https://quietshu.github.io/pingdash
- Size: 5.97 MB
- Stars: 5
- Watchers: 2
- Forks: 0
- Open Issues: 0
-
Metadata Files:
- Readme: README.md
- License: LICENSE
Awesome Lists containing this project
README
# Pingdash 
A simple Web status dashboard for all your services with periodic monitoring commands.
Demo: [t.shud.in](//t.shud.in) or [azure.shud.in](http://azure.shud.in).
## Usage
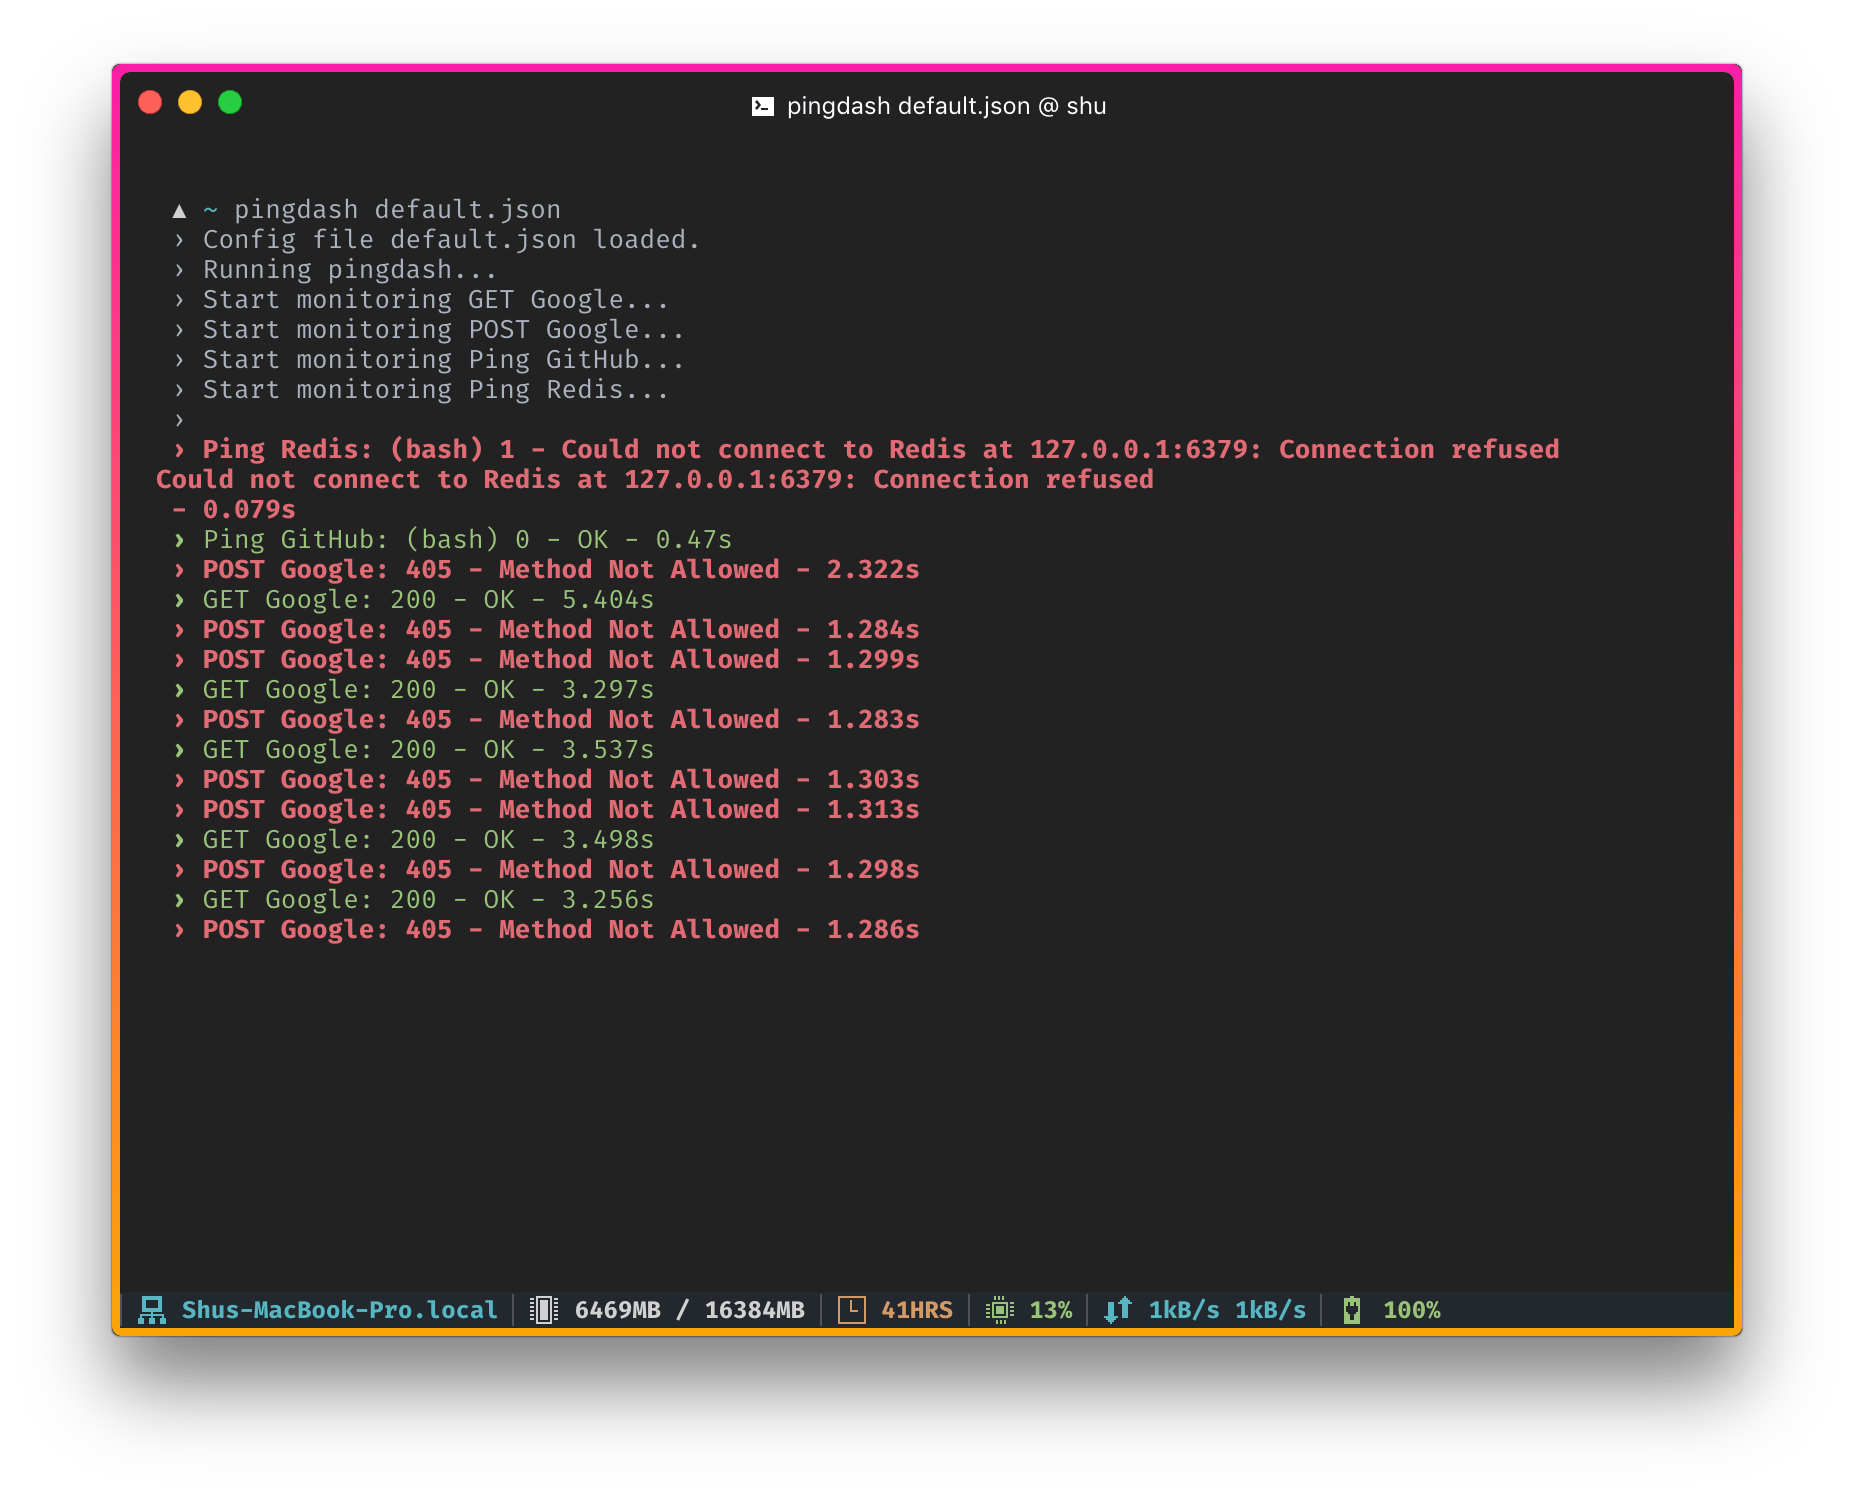
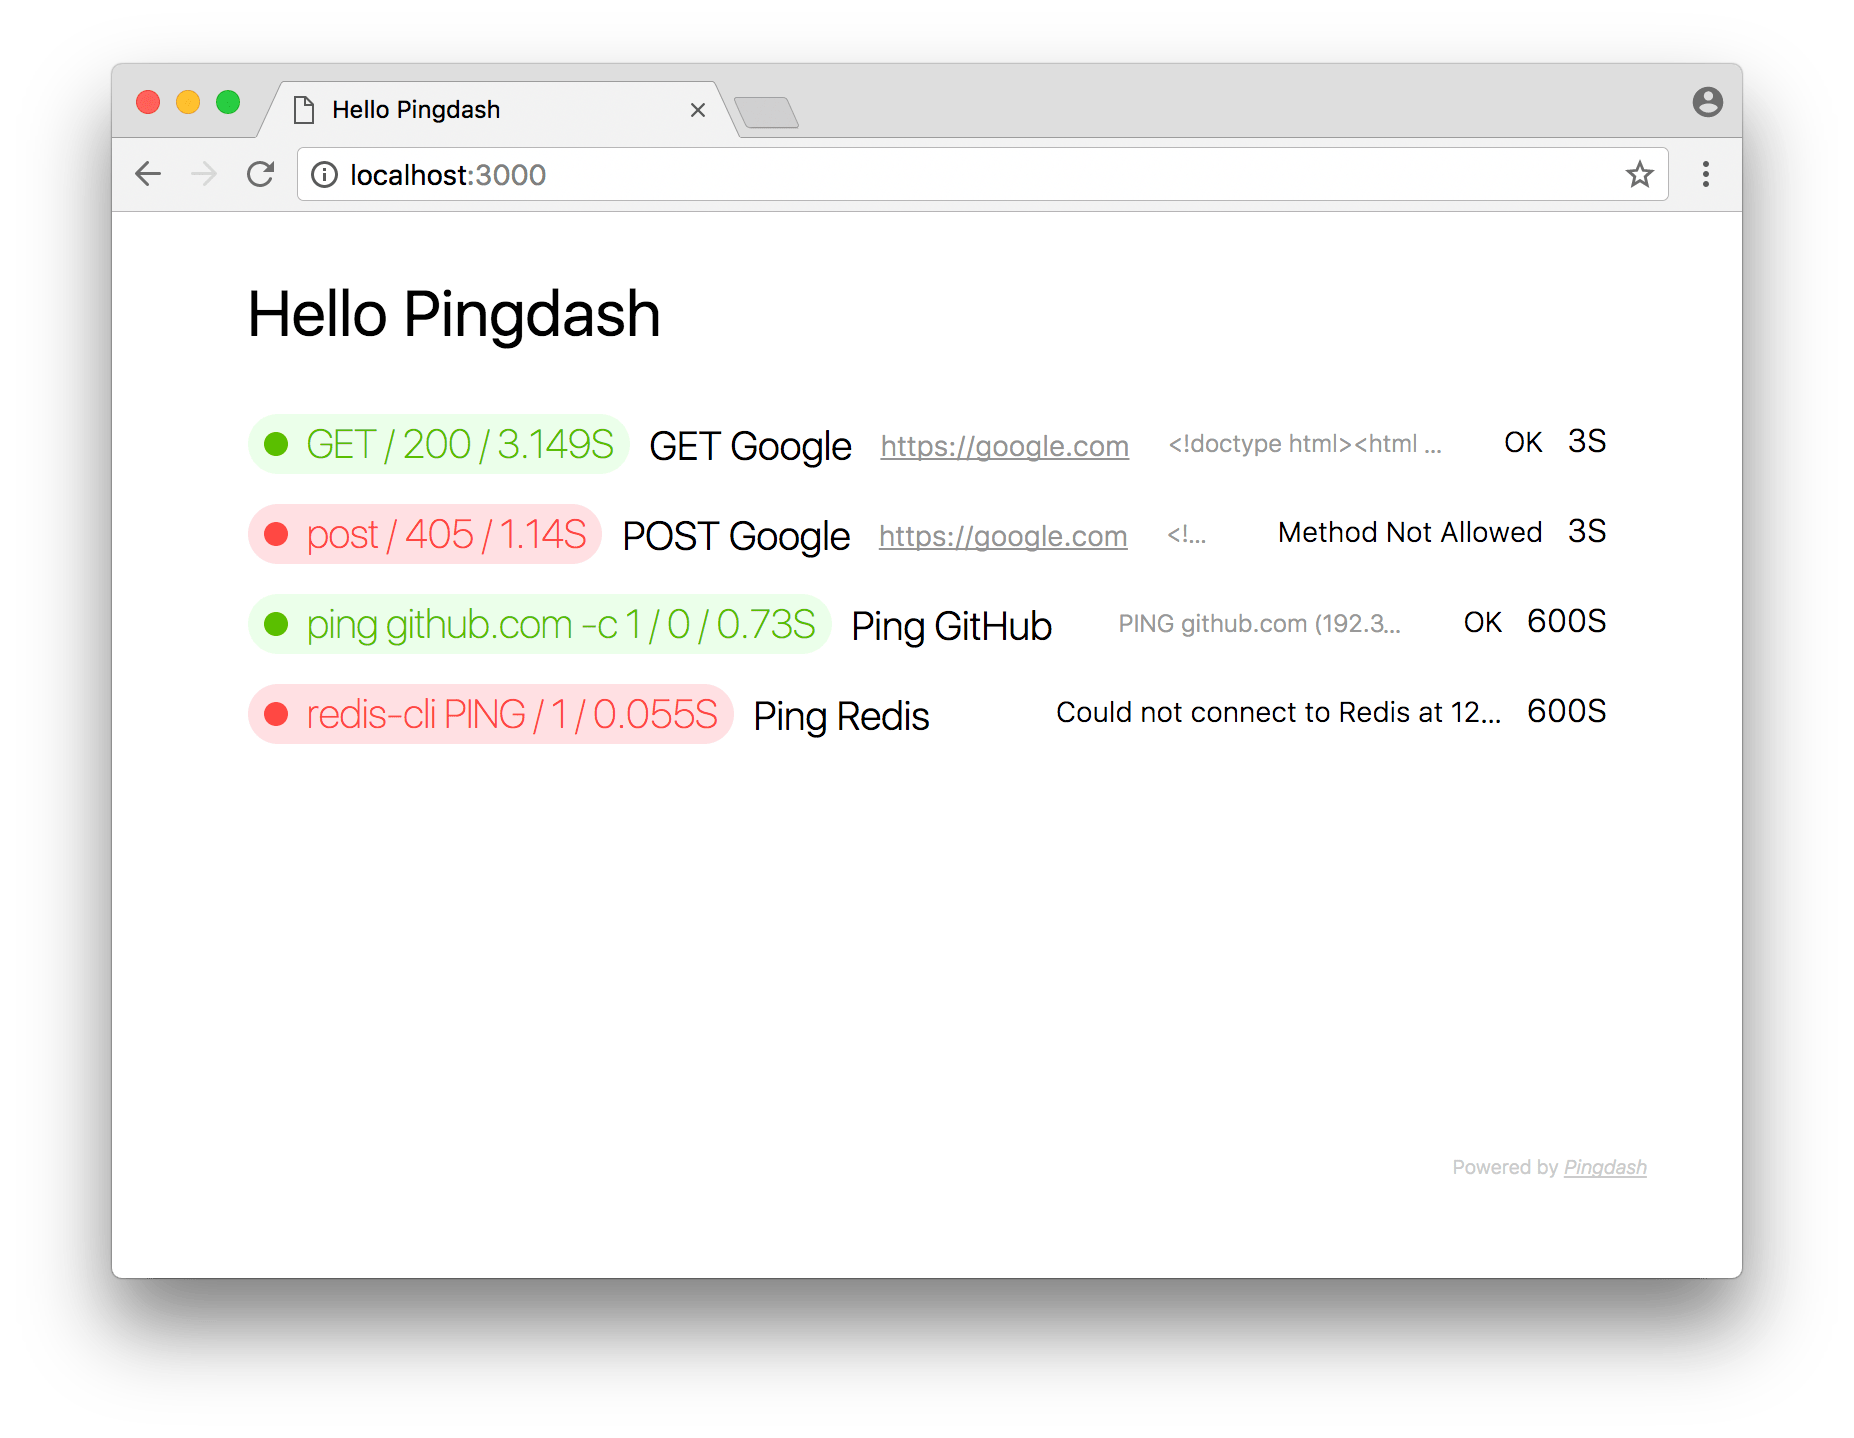
Create a config and run `pingdash config.json`, a beautiful realtime monitoring page will be instantly setup on http://localhost:3000.
The config file is defined as below:
## config.json sample
```javascript
{
"title": "Hello Pingdash",
"port": 3000,
"data": [
// send a GET request to Google every 3 seconds
{
"name": "Google",
"url": "https://google.com", // using GET by default
"interval": 3
},
// ping GitHub once every minute
{
"name": "GitHub",
"method": "ping github.com -c 1", // CLI commands
"interval": 60
},
// POST request
{
"name": "POST Google",
"method": "post", // POST
"url": "https://google.com",
"interval": 3
},
// ...
]
}
```
## Install
You could use npm or yarn to install it globally (recommand node.js version >= 6.0):
```bash
npm i pingdash -g
```
Or use yarn:
```bash
yarn global add pingdash
```
## Options
```bash
$ pingdash --help
Usage: pingdash [options]
Options:
-h, --help output usage information
-V, --version output the version number
-p, --port server's listen port, 3000 default
-s, --silent don't output any logs
```
## License
The MIT license.