https://github.com/simulieren/adonisjs-server-stats
Laravel Telescope-inspired dev toolbar and real-time server monitor for AdonisJS v6
https://github.com/simulieren/adonisjs-server-stats
adonisjs adonisjs-package debug dev-toolbar devtools metrics server-monitoring typescript
Last synced: 3 months ago
JSON representation
Laravel Telescope-inspired dev toolbar and real-time server monitor for AdonisJS v6
- Host: GitHub
- URL: https://github.com/simulieren/adonisjs-server-stats
- Owner: simulieren
- License: mit
- Created: 2026-02-13T17:54:18.000Z (5 months ago)
- Default Branch: main
- Last Pushed: 2026-02-20T07:25:14.000Z (4 months ago)
- Last Synced: 2026-02-20T10:14:59.101Z (4 months ago)
- Topics: adonisjs, adonisjs-package, debug, dev-toolbar, devtools, metrics, server-monitoring, typescript
- Language: TypeScript
- Homepage: https://www.npmjs.com/package/adonisjs-server-stats
- Size: 14 MB
- Stars: 14
- Watchers: 0
- Forks: 1
- Open Issues: 0
-
Metadata Files:
- Readme: README.md
- License: LICENSE
Awesome Lists containing this project
README
# adonisjs-server-stats
[](https://www.npmjs.com/package/adonisjs-server-stats)
[](https://www.npmjs.com/package/adonisjs-server-stats)
[](https://github.com/simulieren/adonisjs-server-stats/blob/main/LICENSE)
[](https://www.typescriptlang.org/)
[](https://adonisjs.com/)
[](https://adonisjs.com/)
A Laravel Telescope-inspired dev toolbar and real-time server monitor for **AdonisJS v6 & v7**.
Drop a single Edge tag into your layout and get a live stats bar showing CPU, memory, requests/sec, database pool, Redis, queues, and logs -- plus a full debug toolbar with SQL query inspection, event tracing, route listing, live log tailing, and custom panels.
Zero frontend dependencies. Zero build step. Just `@serverStats()` and go.
**New (alpha):** Native [React & Vue components](#react--vue-inertiajs--alpha) for Inertia.js apps — same features, framework-native.
## Screenshots
**Debug toolbar** -- expandable panels for deep inspection:
| Queries | Events |
| ------------------------------------------------------------------------------------------------------------------------------------------------------------------------ | ------------------------------------------------------------------------------------------------------------------------------------------------------------------ |
| 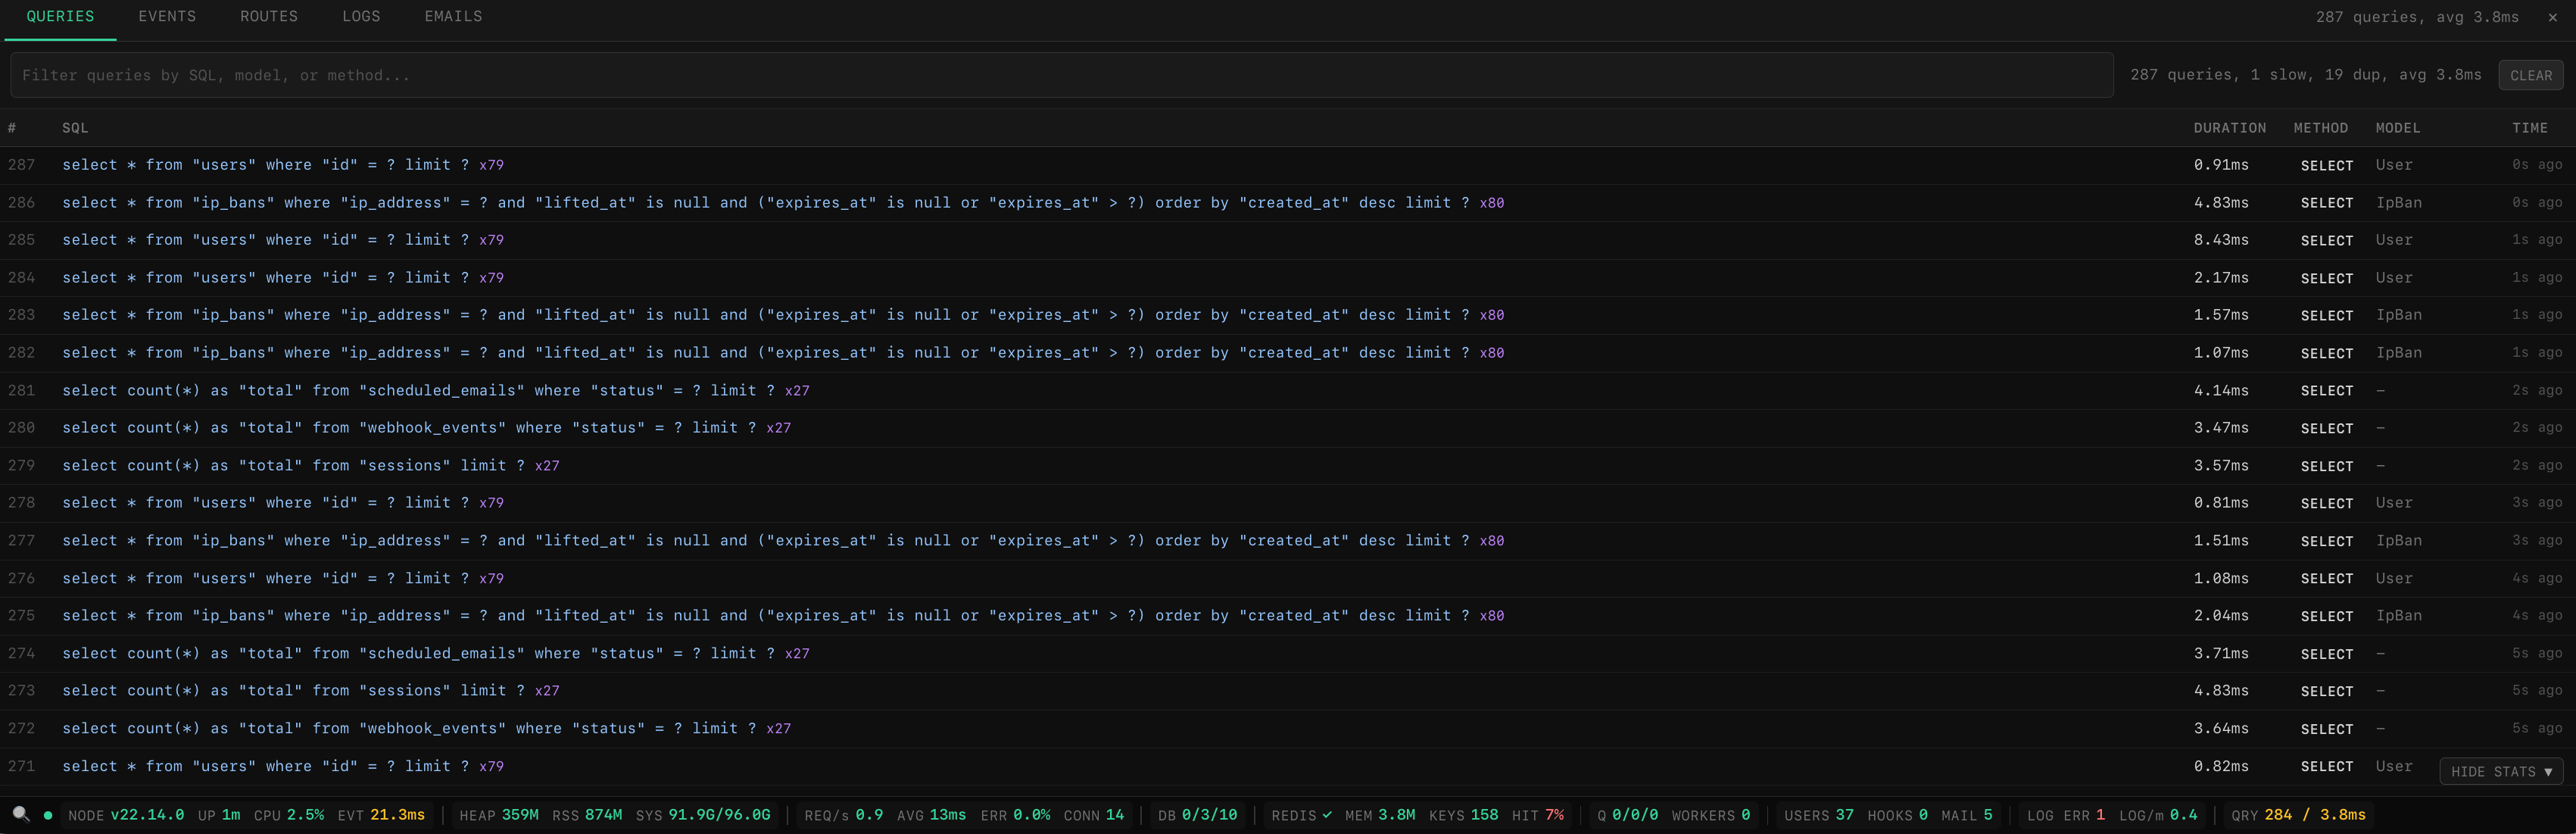 | 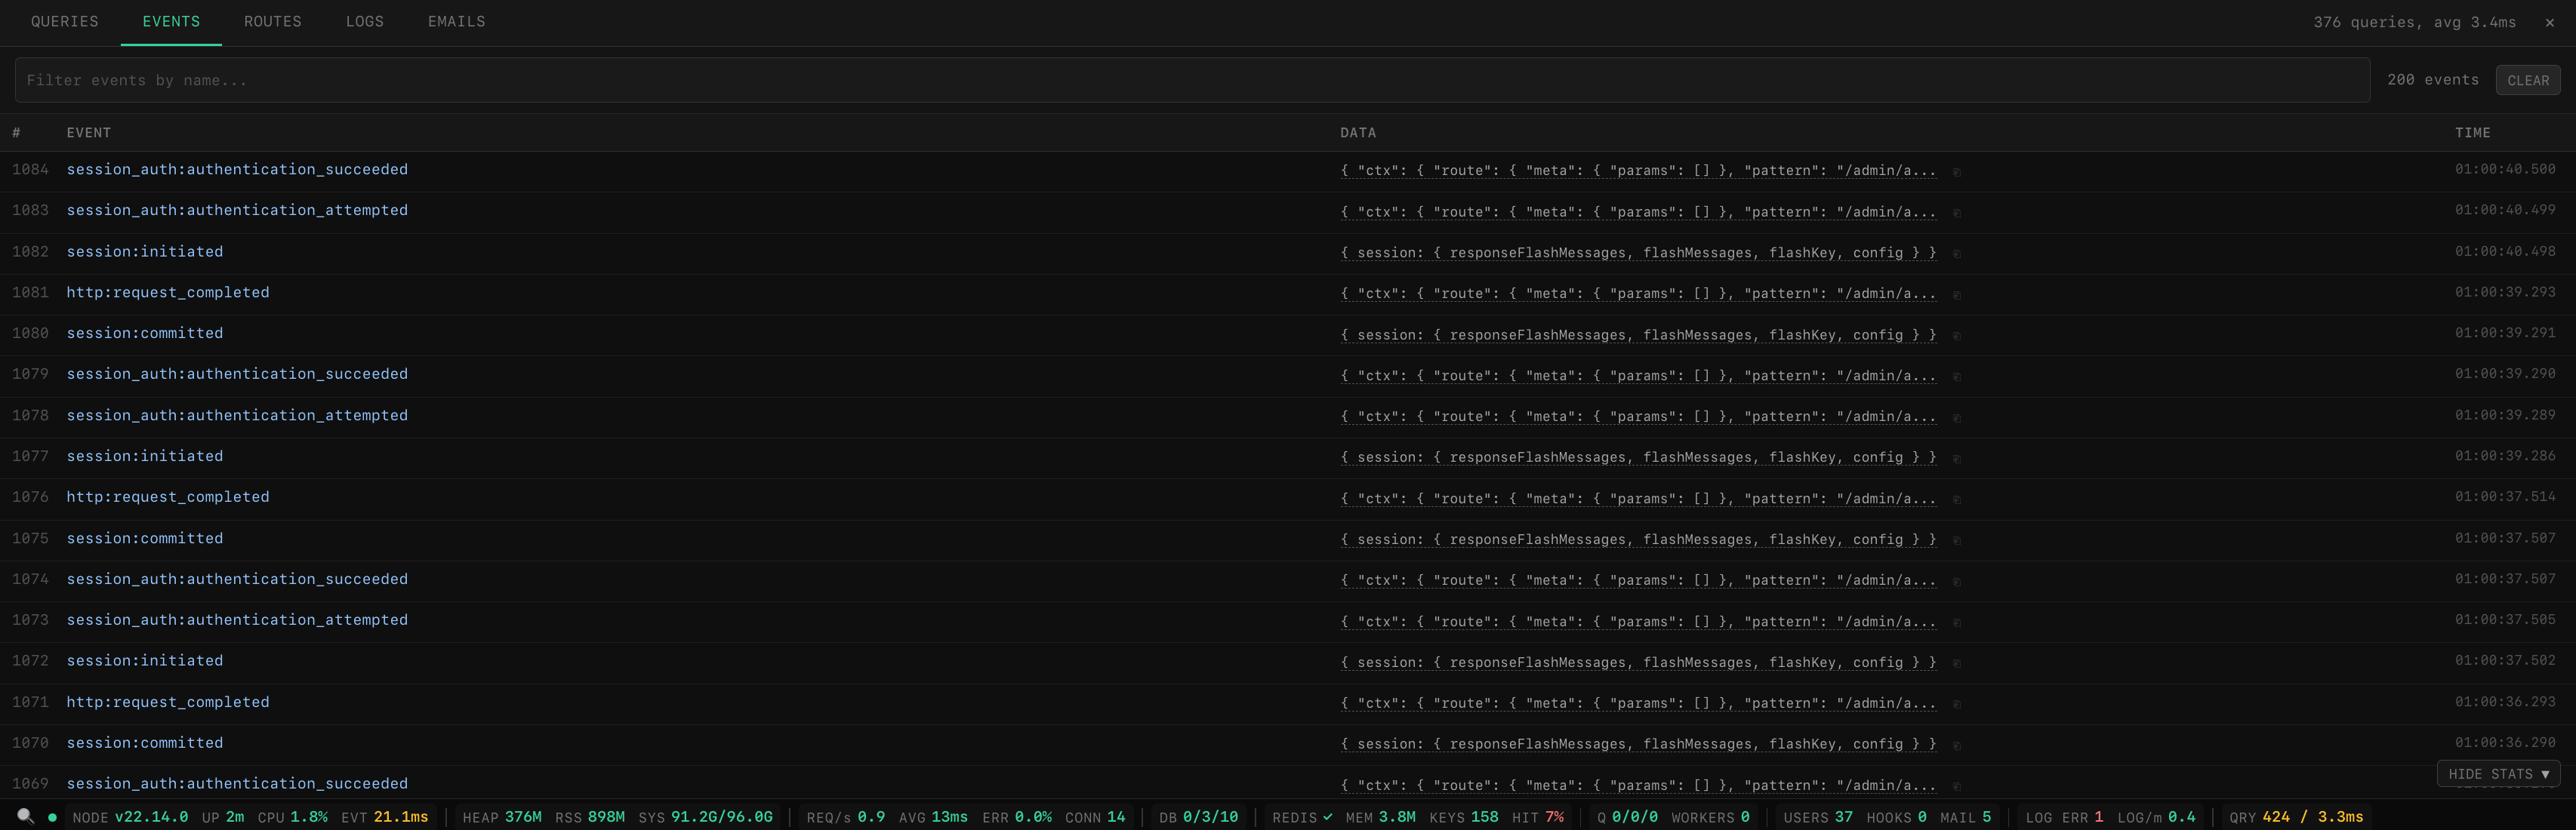 |
| Routes | Logs |
| ----------------------------------------------------------------------------------------------------------------------------------------------------------------- | ----------------------------------------------------------------------------------------------------------------------------------------------------------------- |
| 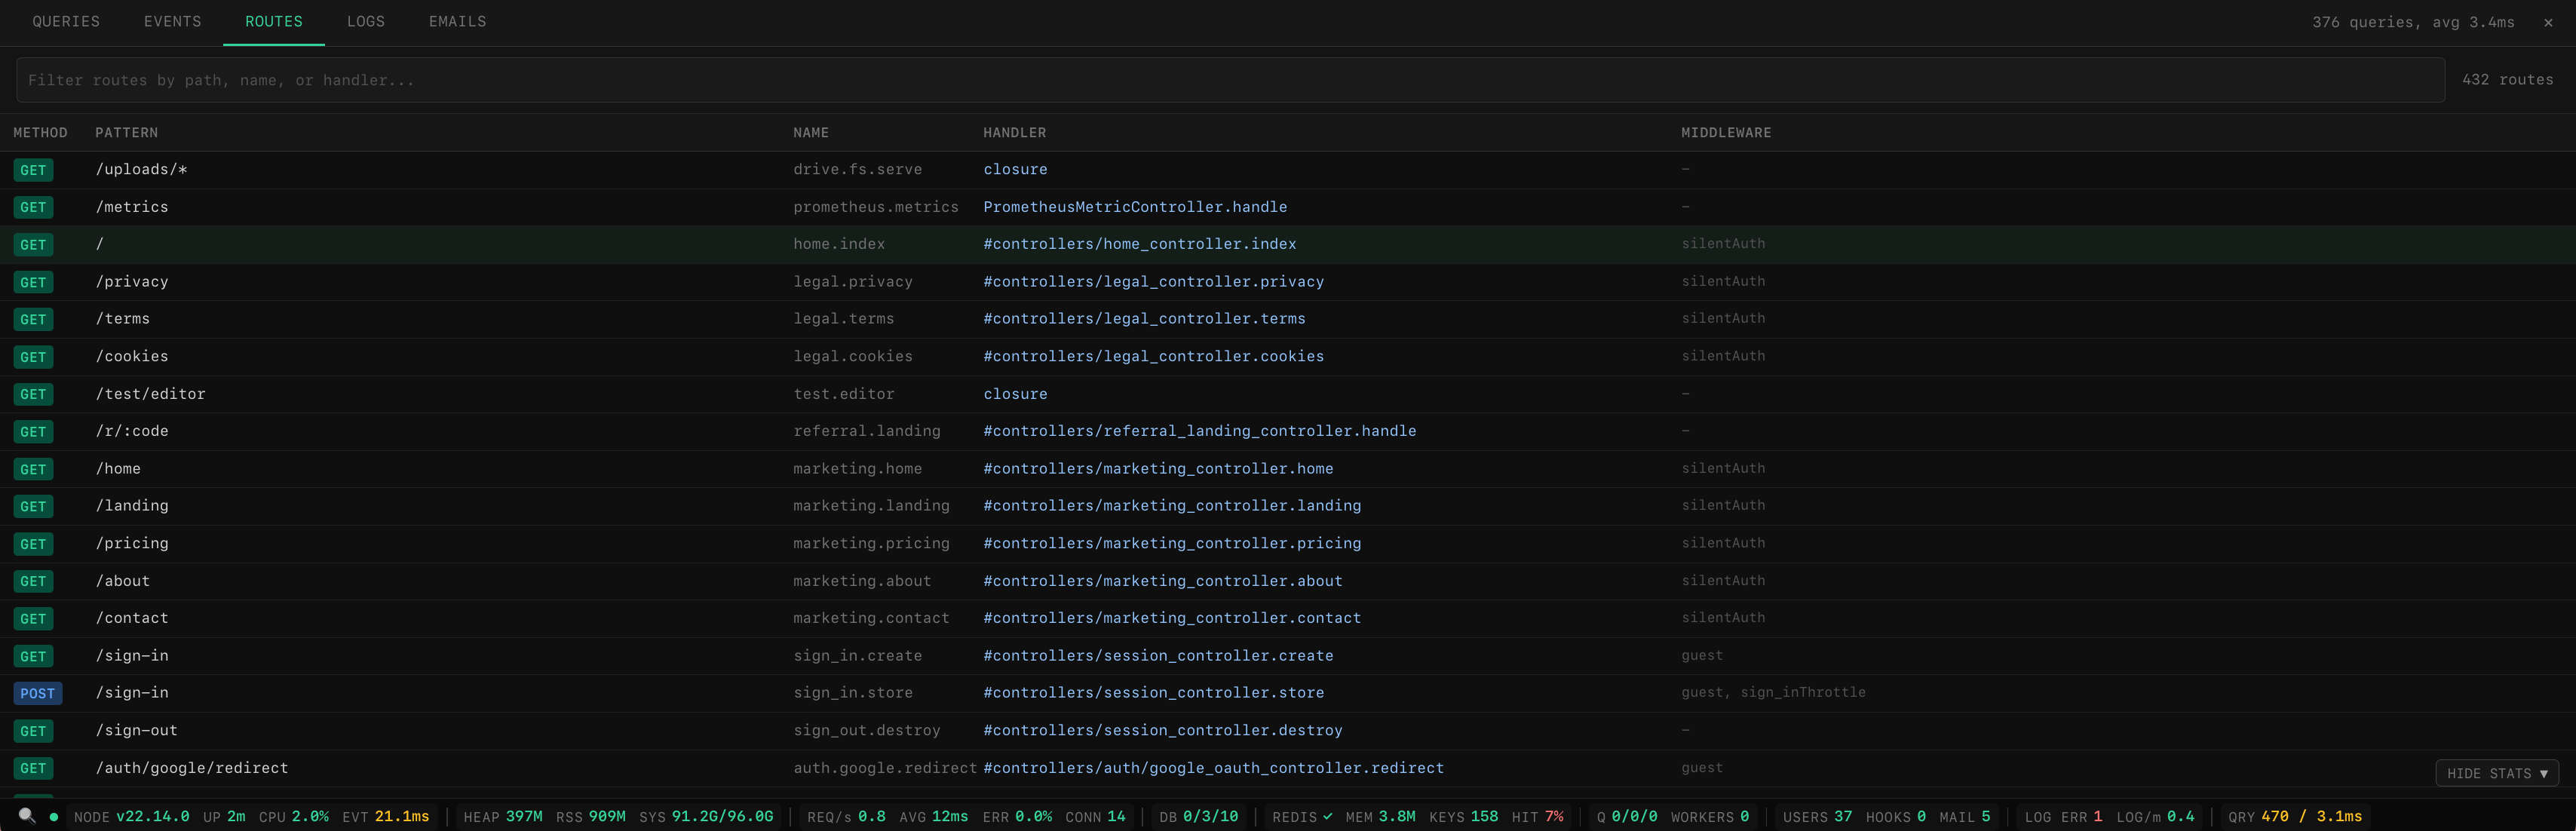 | 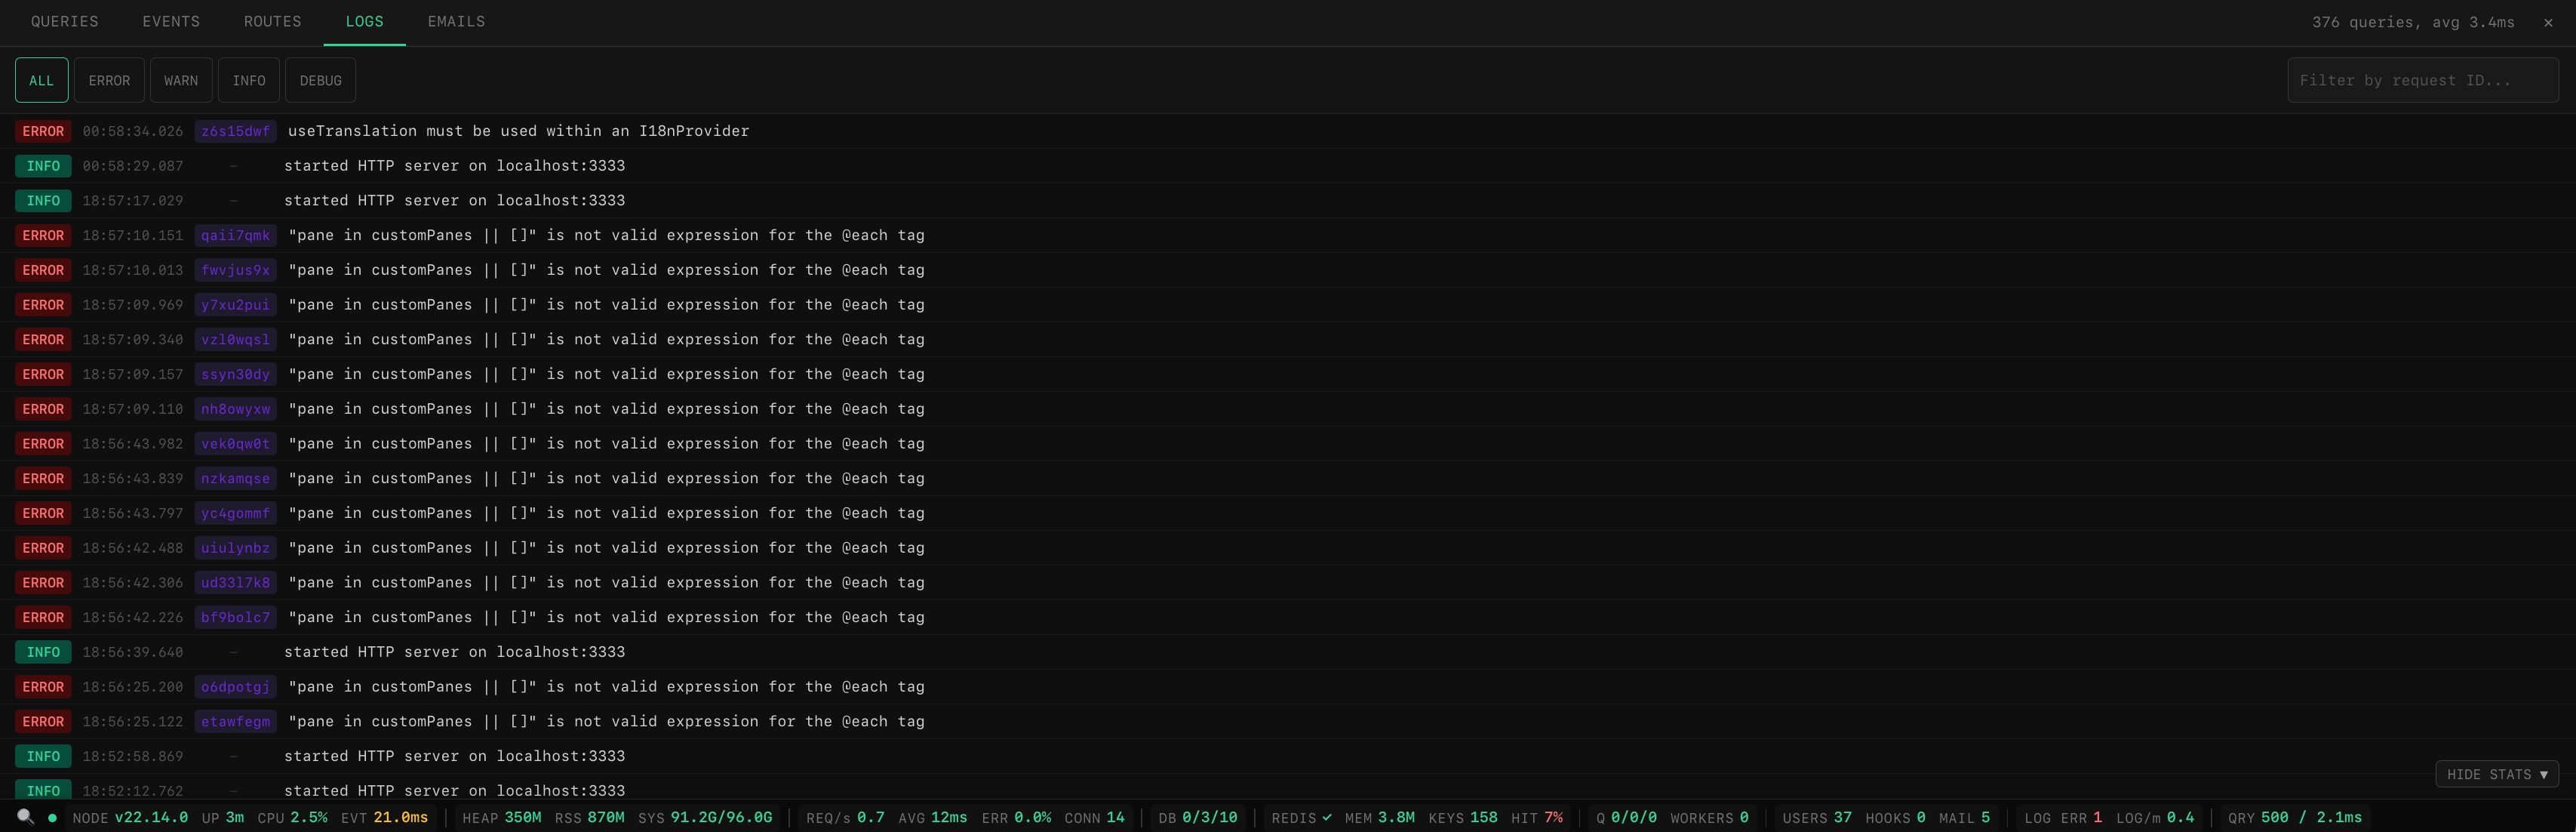 |
| Emails (custom pane) |
| -------------------------------------------------------------------------------------------------------------------------------------------------------------- |
| 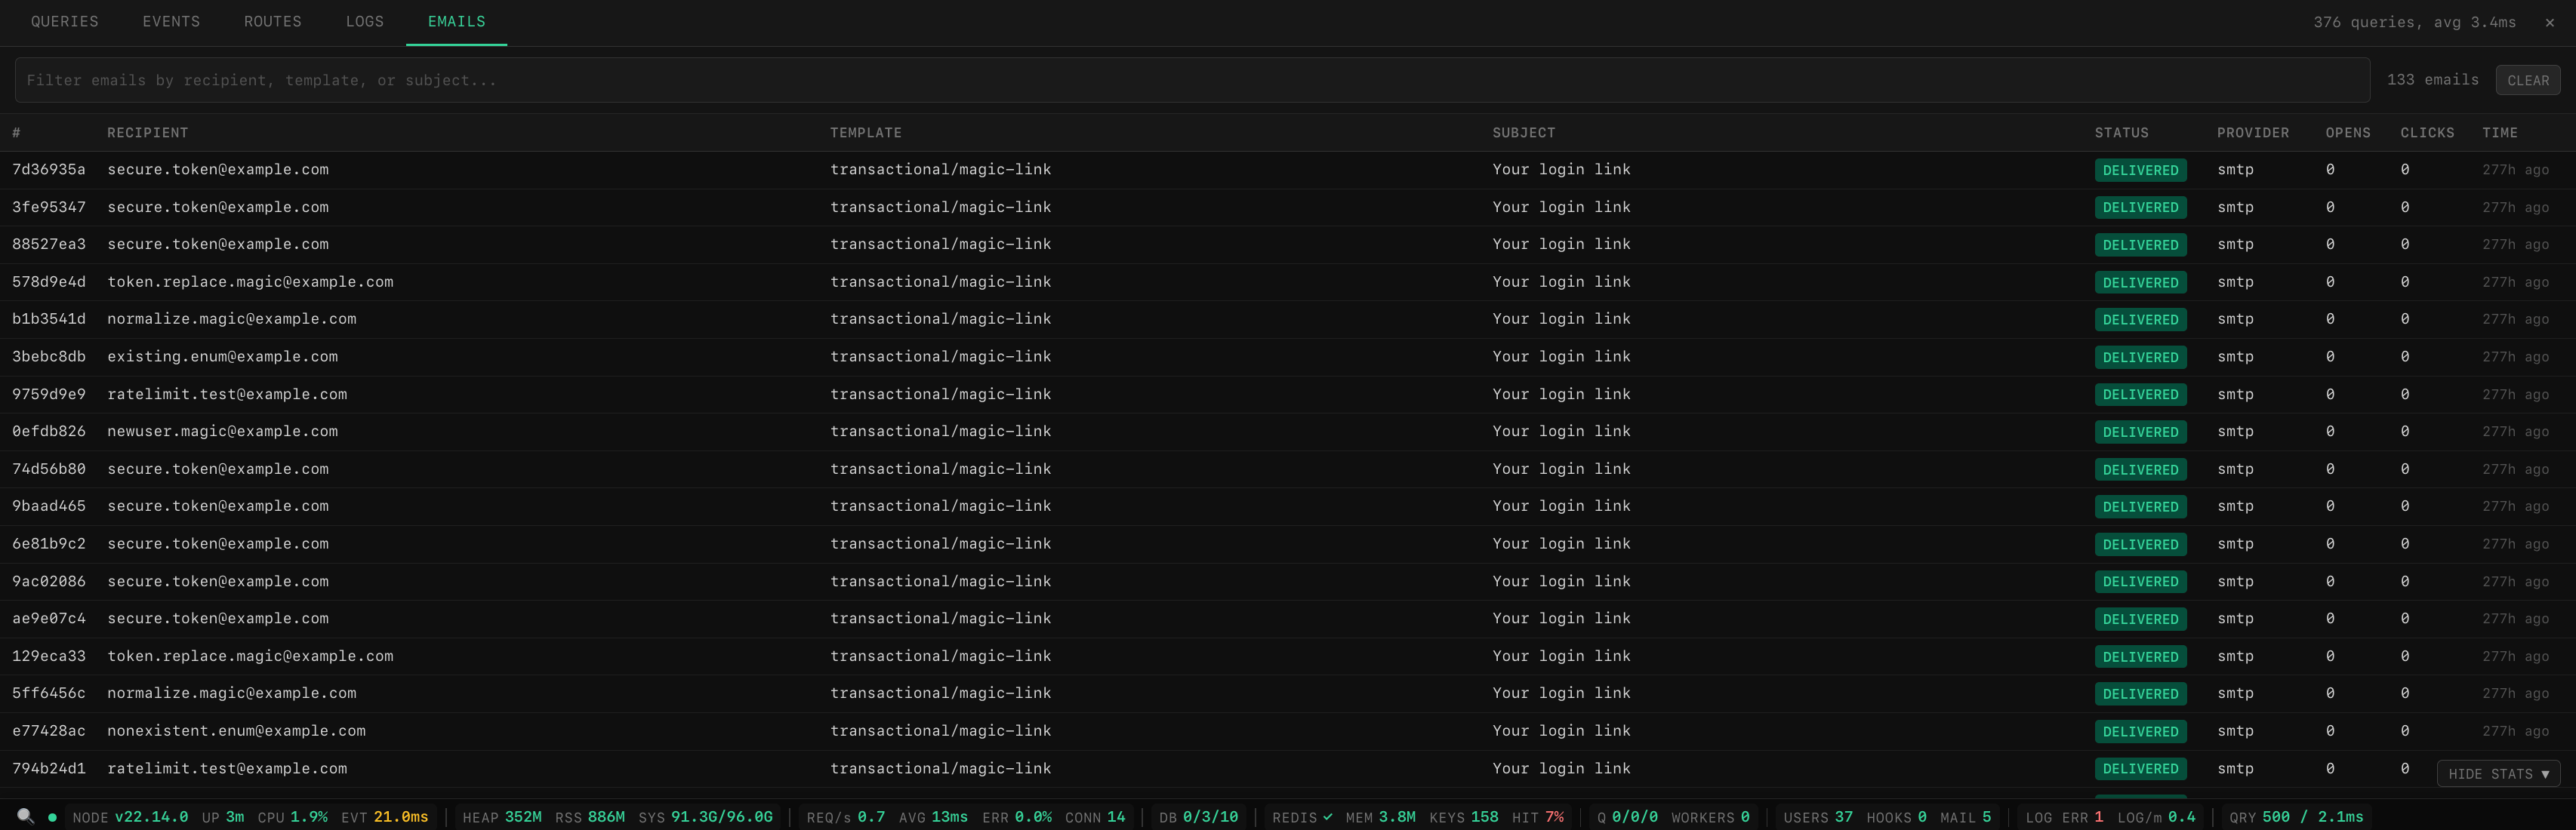 |
## Features
- **Live stats bar** -- CPU, memory, event loop lag, HTTP throughput, DB pool, Redis, queues, logs
- **Debug toolbar** -- SQL queries, events, emails, routes, logs with search and filtering
- **Request tracing** -- per-request waterfall timeline showing DB queries, events, and custom spans
- **Custom panes** -- add your own tabs (webhooks, emails, cache, anything) with a simple config
- **Full-page dashboard** -- dedicated page at `/__stats` with overview cards, charts, request history, query analysis, EXPLAIN plans, cache/queue/config inspection, and saved filters
- **Pluggable collectors** -- use built-in collectors or write your own
- **Visibility control** -- show only to admins, specific roles, or in dev mode
- **SSE broadcasting** -- real-time updates via AdonisJS Transmit
- **Prometheus export** -- expose all metrics as Prometheus gauges
- **Self-contained** -- inline HTML/CSS/JS Edge tag, no external assets
- **React & Vue support (alpha)** -- native Inertia.js components with the same features as Edge
- **Graceful degradation** -- missing optional dependencies are handled automatically
- **Theme support** -- dark and light themes across dashboard, debug panel, and stats bar with system preference detection and manual toggle
## Installation
```bash
npm install adonisjs-server-stats
```
## Quick Start
### 1. Register providers
```ts
// adonisrc.ts
providers: [
() => import('adonisjs-server-stats/provider'),
]
```
### 2. Register middleware
```ts
// start/kernel.ts
server.use([() => import('adonisjs-server-stats/middleware')])
```
### 3. Create config
```ts
// config/server_stats.ts
import { defineConfig } from 'adonisjs-server-stats'
export default defineConfig({})
```
That's it -- zero config required. Collectors are auto-detected from your installed packages (Lucid, Redis, BullMQ, etc.) and enabled automatically. All other options have sensible defaults.
**Common setup** -- add access control and enable the toolbar/dashboard:
```ts
// config/server_stats.ts
import { defineConfig } from 'adonisjs-server-stats'
export default defineConfig({
authorize: (ctx) => ctx.auth?.user?.role === 'admin',
toolbar: true,
dashboard: true,
})
```
> **Tip: Enable query capture** -- Lucid only emits `db:query` events when `debug: true` is set on the connection. Without it, the Queries panel will be empty.
>
> ```ts
> // config/database.ts
> connections: {
> postgres: {
> client: 'pg',
> debug: app.inDev, // ← enables query capture in development
> connection: { ... },
> },
> }
> ```
**Full control** -- override auto-detection with explicit collectors:
```ts
// config/server_stats.ts
import env from '#start/env'
import { defineConfig } from 'adonisjs-server-stats'
import {
processCollector,
systemCollector,
httpCollector,
dbPoolCollector,
redisCollector,
queueCollector,
logCollector,
appCollector,
} from 'adonisjs-server-stats/collectors'
export default defineConfig({
pollInterval: 3000,
collectors: [
processCollector(),
systemCollector(),
httpCollector({ maxRecords: 10_000 }),
dbPoolCollector({ connectionName: 'postgres' }),
redisCollector(),
queueCollector({
queueName: 'default',
connection: {
host: env.get('QUEUE_REDIS_HOST'),
port: env.get('QUEUE_REDIS_PORT'),
password: env.get('QUEUE_REDIS_PASSWORD'),
},
}),
logCollector(),
appCollector(),
],
})
```
### 4. Render the stats bar
That's it for setup -- **all API routes are auto-registered by the package**. No controllers or route definitions needed. On startup you'll see:
```
[server-stats] auto-registered routes: /admin/api/server-stats, /admin/api/debug/*, /__stats/*
```
All routes are gated by the `authorize` callback if configured (see [Visibility Control](#visibility-control-authorize)).
**Edge** (add before `