https://github.com/sivasamyk/graylog2-plugin-input-httpmonitor
HTTP Monitor plugin for graylog
https://github.com/sivasamyk/graylog2-plugin-input-httpmonitor
graylog http http-monitor monitoring-plugins website-monitor
Last synced: about 1 year ago
JSON representation
HTTP Monitor plugin for graylog
- Host: GitHub
- URL: https://github.com/sivasamyk/graylog2-plugin-input-httpmonitor
- Owner: sivasamyk
- License: mit
- Created: 2015-07-02T17:24:30.000Z (almost 11 years ago)
- Default Branch: master
- Last Pushed: 2023-12-30T06:39:34.000Z (over 2 years ago)
- Last Synced: 2025-04-14T04:11:51.080Z (about 1 year ago)
- Topics: graylog, http, http-monitor, monitoring-plugins, website-monitor
- Language: Java
- Size: 1.81 MB
- Stars: 42
- Watchers: 10
- Forks: 7
- Open Issues: 4
-
Metadata Files:
- Readme: README.md
- License: LICENSE
Awesome Lists containing this project
README
# Graylog HTTP Monitor Input Plugin (DEPRECATED)

An input monitor plugin for monitoring HTTP URLs (websites and REST APIs).
Works by periodically polling the URLs and recording the responses as messages.
This plugin provides support for monitoring following parameters
* Response time in milliseconds
* HTTP Status Code
* HTTP Status Text
* HTTP Response Body
* HTTP Response size in bytes
* Timeouts and connection failures
* Custom Response Headers
Getting started
---------------
For Graylog v2.0 and above download this [jar](https://github.com/sivasamyk/graylog2-plugin-input-httpmonitor/releases/download/v1.0.5/graylog2-plugin-input-httpmonitor-1.0.5.jar)
(Please note this version will break (due to changes in graylog field naming restrictions) HTTP monitor dashboard created in older versions)
For Graylog v1.2 and above download this [jar](https://github.com/sivasamyk/graylog2-plugin-input-httpmonitor/releases/download/v1.0.2/graylog2-plugin-input-httpmonitor-1.0.2.jar)
For Graylog v1.1 and below download this [jar](https://github.com/sivasamyk/graylog2-plugin-input-httpmonitor/releases/download/v1.0.0/graylog2-plugin-input-httpmonitor-1.0.0.jar)
* Shutdown the graylog server.
* Place the plugin jar in the Graylog plugins directory.
* Restart the server.
* In the graylog web UI, goto System->Inputs to launch new input of type 'HTTP Monitor'
Following parameters can be configured while launching the plugin
* URL to monitor ( supports HTTPS URLs with self-signed certificates also)
* Polling interval - Interval to execute the HTTP methods (poll the URL)
* Timeout - Time to wait before declaring the request as timed out.
* HTTP Method - GET/POST/PUT method to be executed
* Additional HTTP headers to send - Comma separated list of HTTP request headers to be sent as part of request. e.g. CAccept:application/json, X-Requester:Graylog2
* Additional HTTP headers to log - Command separated list of HTTP response headers to log as part of message. e.g. Expires,Date
* HTTP Basic Authentication username and password
* HTTP Proxy URI
The status code will be 999 on connection failures, 998 on connection timeouts and 997 for others errors.
Polling interval and timeout can be configured in milliseconds/seconds/minutes/hours/days
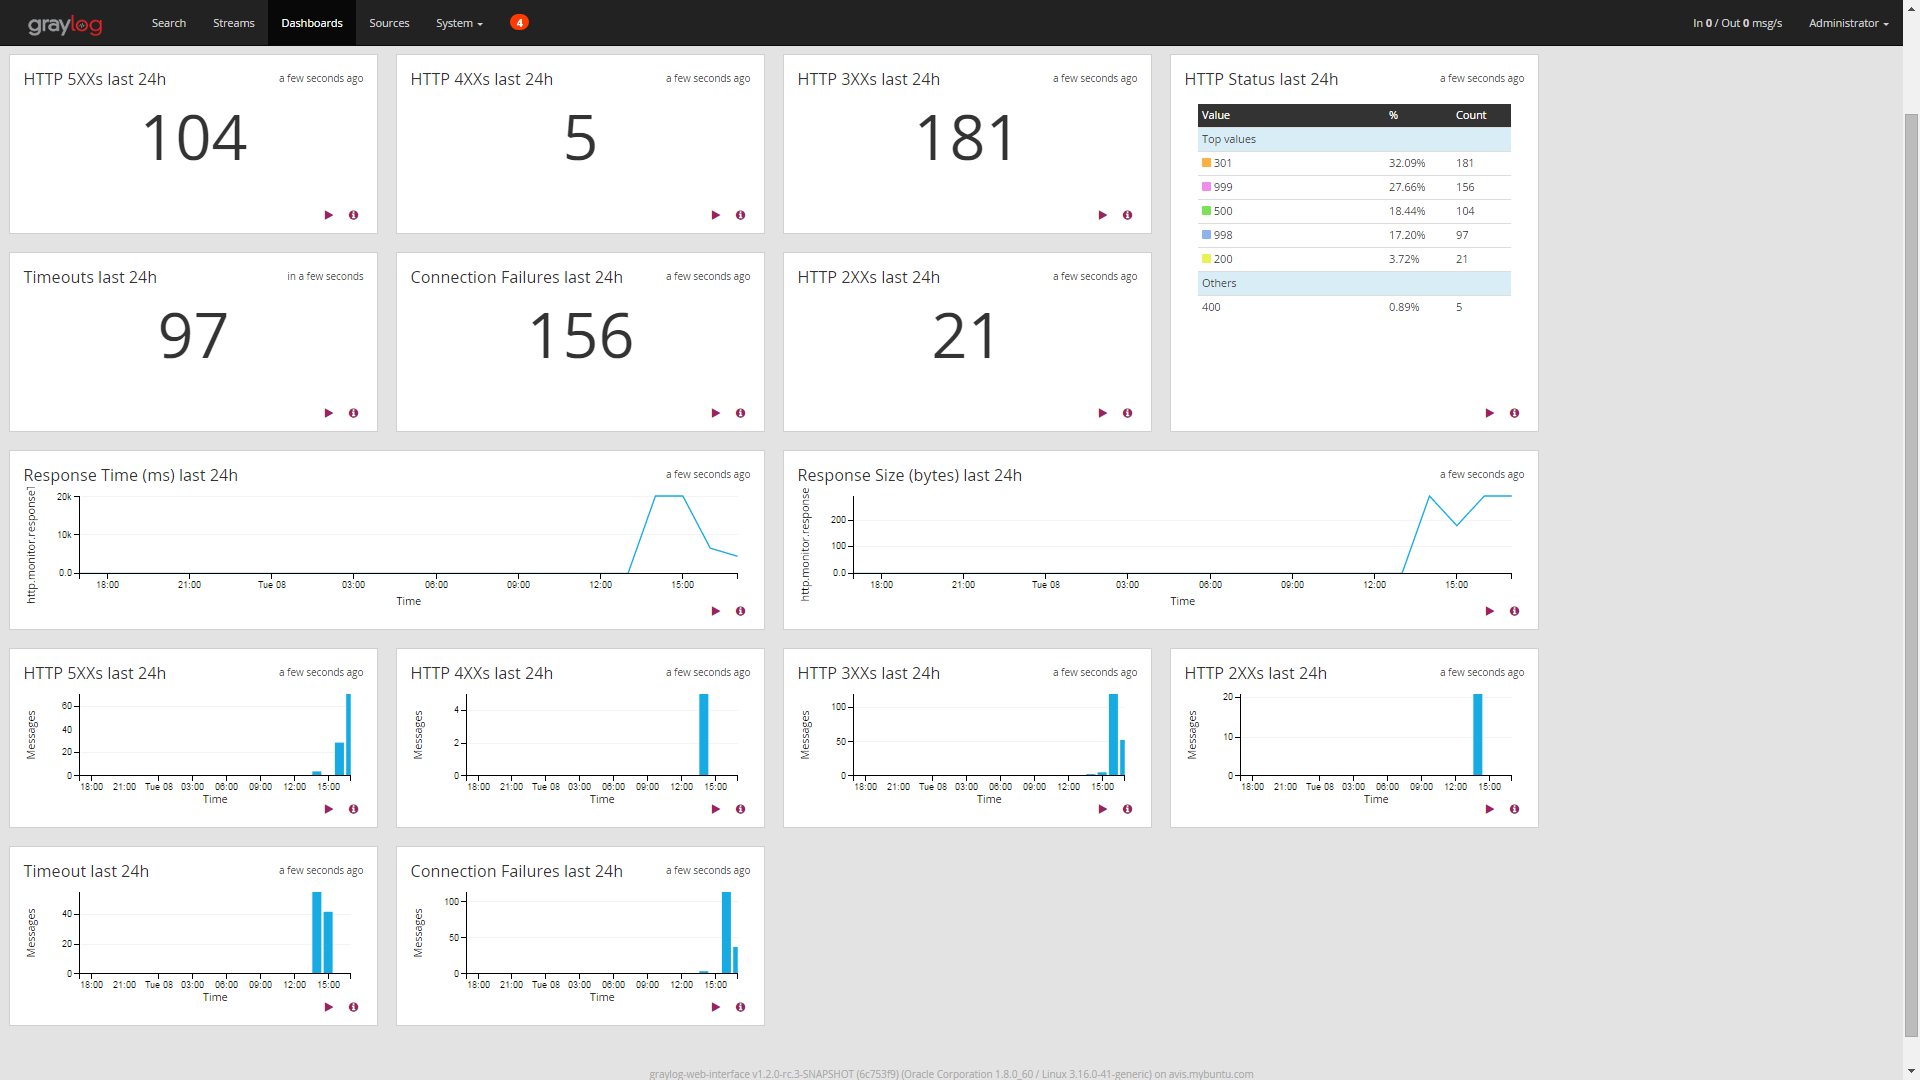
You can import the [content pack](https://github.com/sivasamyk/graylog-contentpack-httpmonitor) for HTTP Monitor for prebuilt dashboard and streams.
Sample Dashboard
----------------
