Ecosyste.ms: Awesome
An open API service indexing awesome lists of open source software.
https://github.com/sloev/metrace
Metrace - cpu/memory tracing for process trees
https://github.com/sloev/metrace
cpu memory metrics monitor python trace tracing tracking
Last synced: about 1 month ago
JSON representation
Metrace - cpu/memory tracing for process trees
- Host: GitHub
- URL: https://github.com/sloev/metrace
- Owner: sloev
- License: mit
- Created: 2019-09-17T09:43:31.000Z (over 5 years ago)
- Default Branch: master
- Last Pushed: 2020-09-02T21:39:24.000Z (over 4 years ago)
- Last Synced: 2024-11-01T19:52:32.654Z (about 2 months ago)
- Topics: cpu, memory, metrics, monitor, python, trace, tracing, tracking
- Language: Python
- Homepage: https://pypi.org/project/metrace/
- Size: 1.14 MB
- Stars: 10
- Watchers: 2
- Forks: 1
- Open Issues: 1
-
Metadata Files:
- Readme: README.md
- License: LICENSE
Awesome Lists containing this project
README
[](https://pypi.python.org/pypi/metrace) [](https://pypi.python.org/pypi/metrace)
# Metrace - cpu/memory tracing for process trees
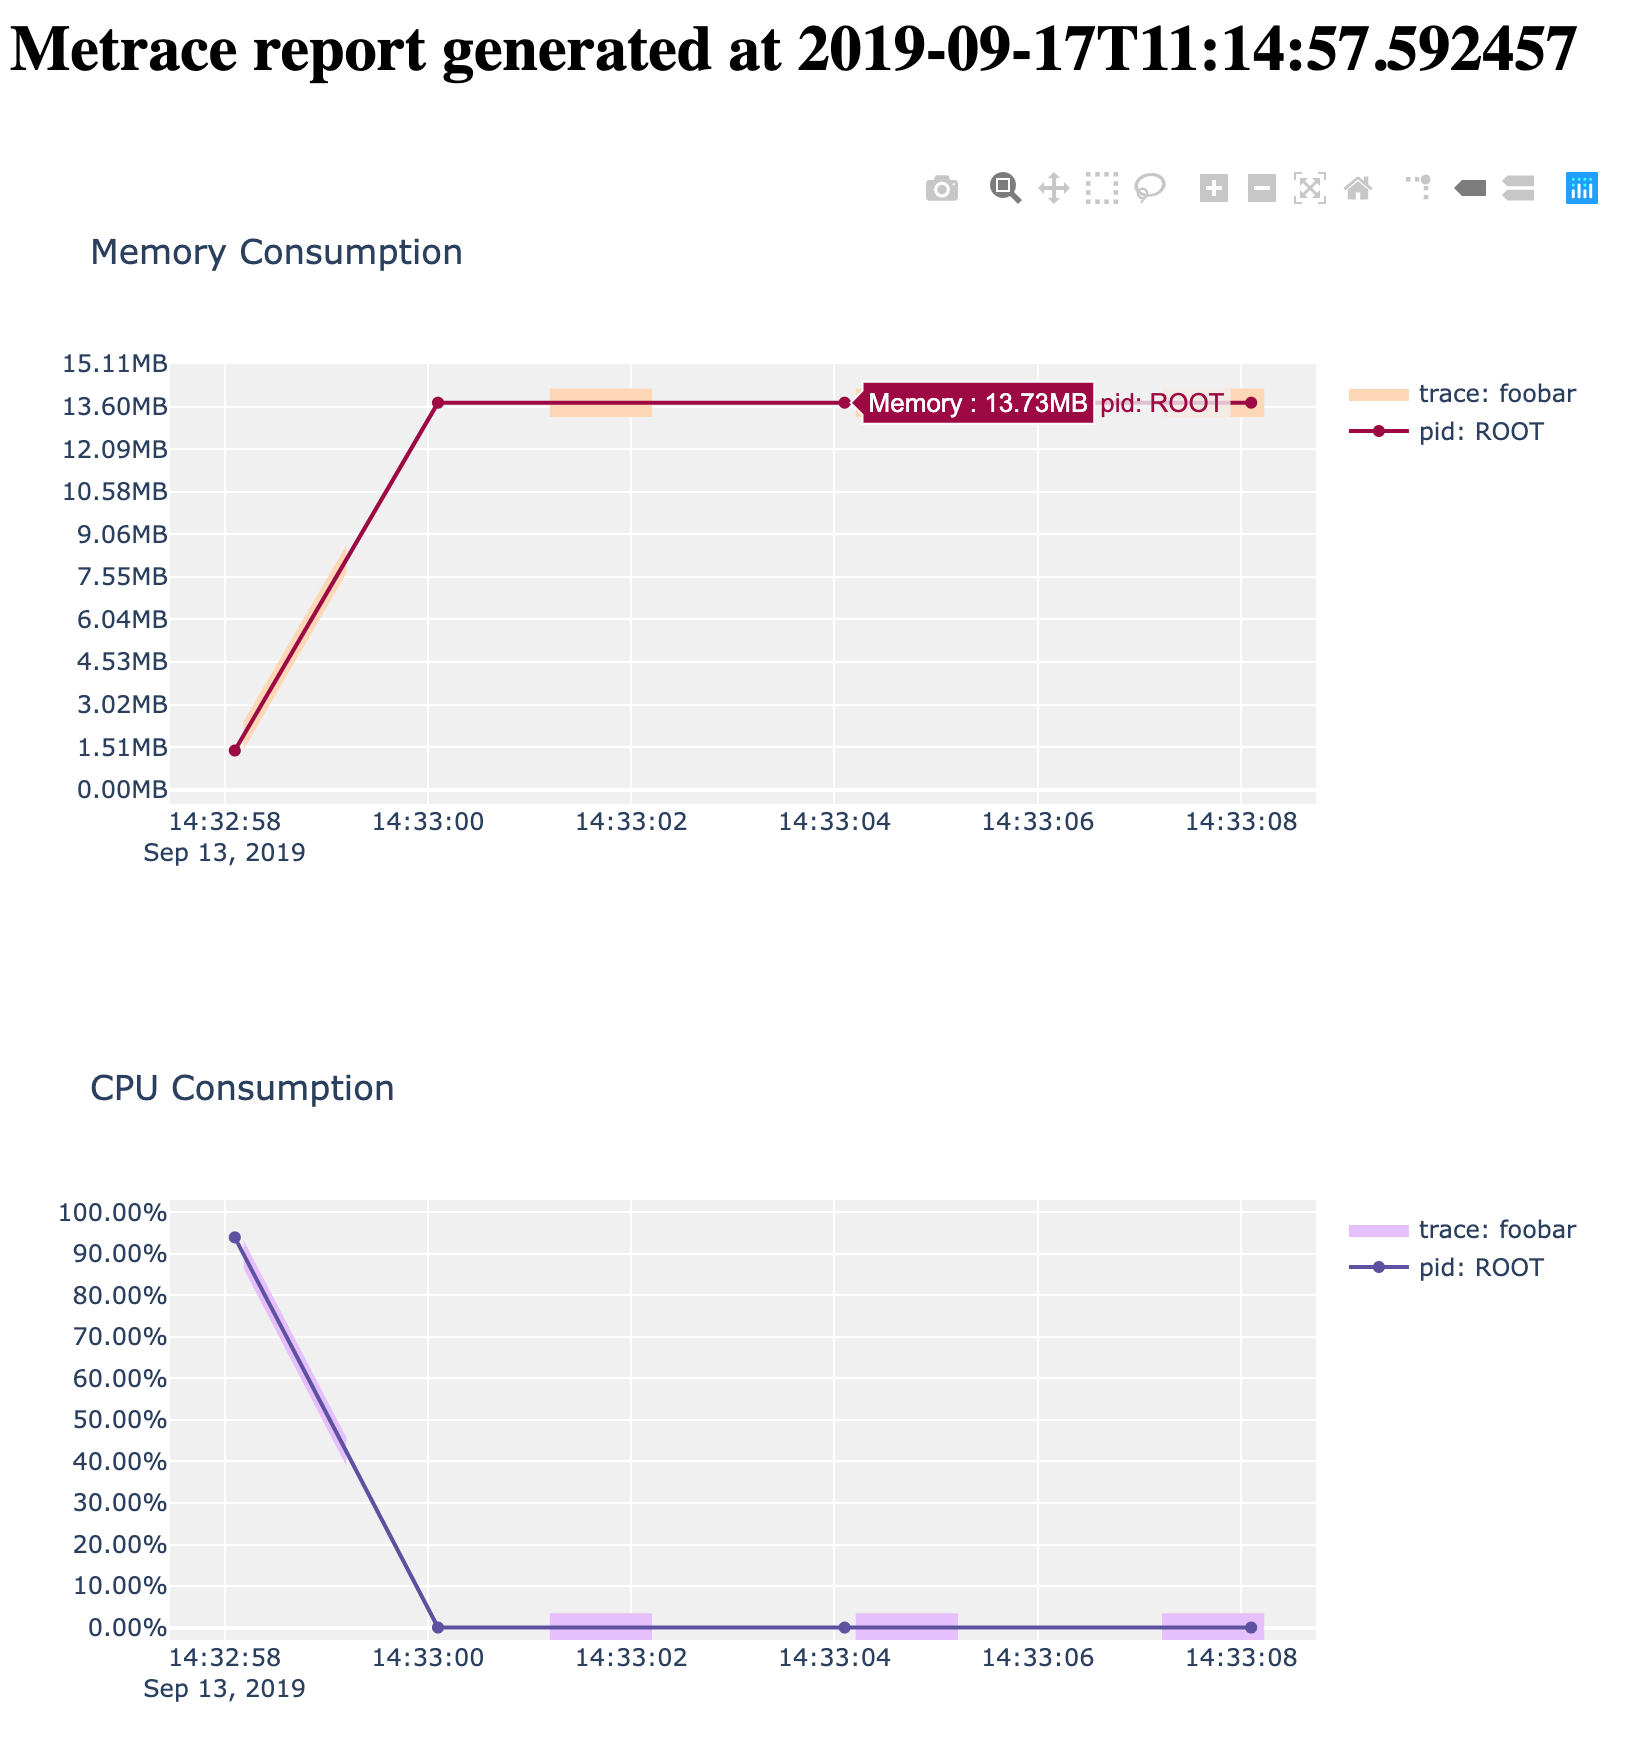
Metrace makes it easy to get a nice interactive html plot of the cpu/memory usage of a whole process tree.

## Install
Metrace depends on `Plotly` and `Psutil`, both will be installed with metrace using pip:
```
$ pip install metrace
```
## Client usage (optional)
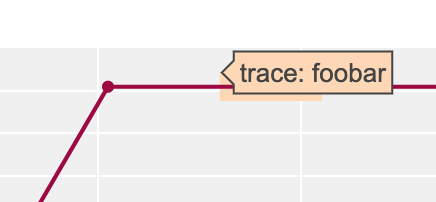
Metrace lets you annotate specific parts of your code with scopes and these will become part of your final plot output and end up look like this:

Metrace gives you a context manager `trace` you can wrap code blocks with:
```
$ cat foobar.py
from metrace import trace
with trace('creating 1000 objects'):
l = []
for i in range(1000):
l.append(object())
```
To collect these traces you run your script with metrace as usual:
```
$ metrace run python foobar.py
```
## Commandline Usage
After installation you will have the **metrace** command available.
```
$ metrace run python main.py && metrace plot
```
**It has two subcommands:**
### run
```
$ metrace run python foobar.py
```
Runs a process and collects cpu/memory metrics for both the process and its children seperately.
Metrace outputs the metrics in a json file in current working directory named like: `metrace_1568385178098218.json` with the number being milliseconds since epoch.
### plot
```
$ metrace plot
# or
# to not open the html report automatically:
$ metrace plot --autoopen=no
# or
# to specify input/output files
$ metrace plot -i metrace_1568385178098218.json -o metrace_report.html
```
Plots cpu/memory usage for a given, or latest found, `metrace json file`.
Output is a html file where you can download the images, zoom in and hover to inspect the different traces.
## Samples
Docs folder contains a sample of a [metrace json file](./docs/metrace_1568385178098218.json) and a [metrace html report](./docs/metrace_report.html)
# Attribution
[plotly.min.js](https://github.com/plotly/plotly.js) Licensed under MIT, has been included in this library here: [metrace/plotly_latest.min.js](./metrace/plotly_latest.min.js)
