https://github.com/smerth/polymer-visualize-tornado-data
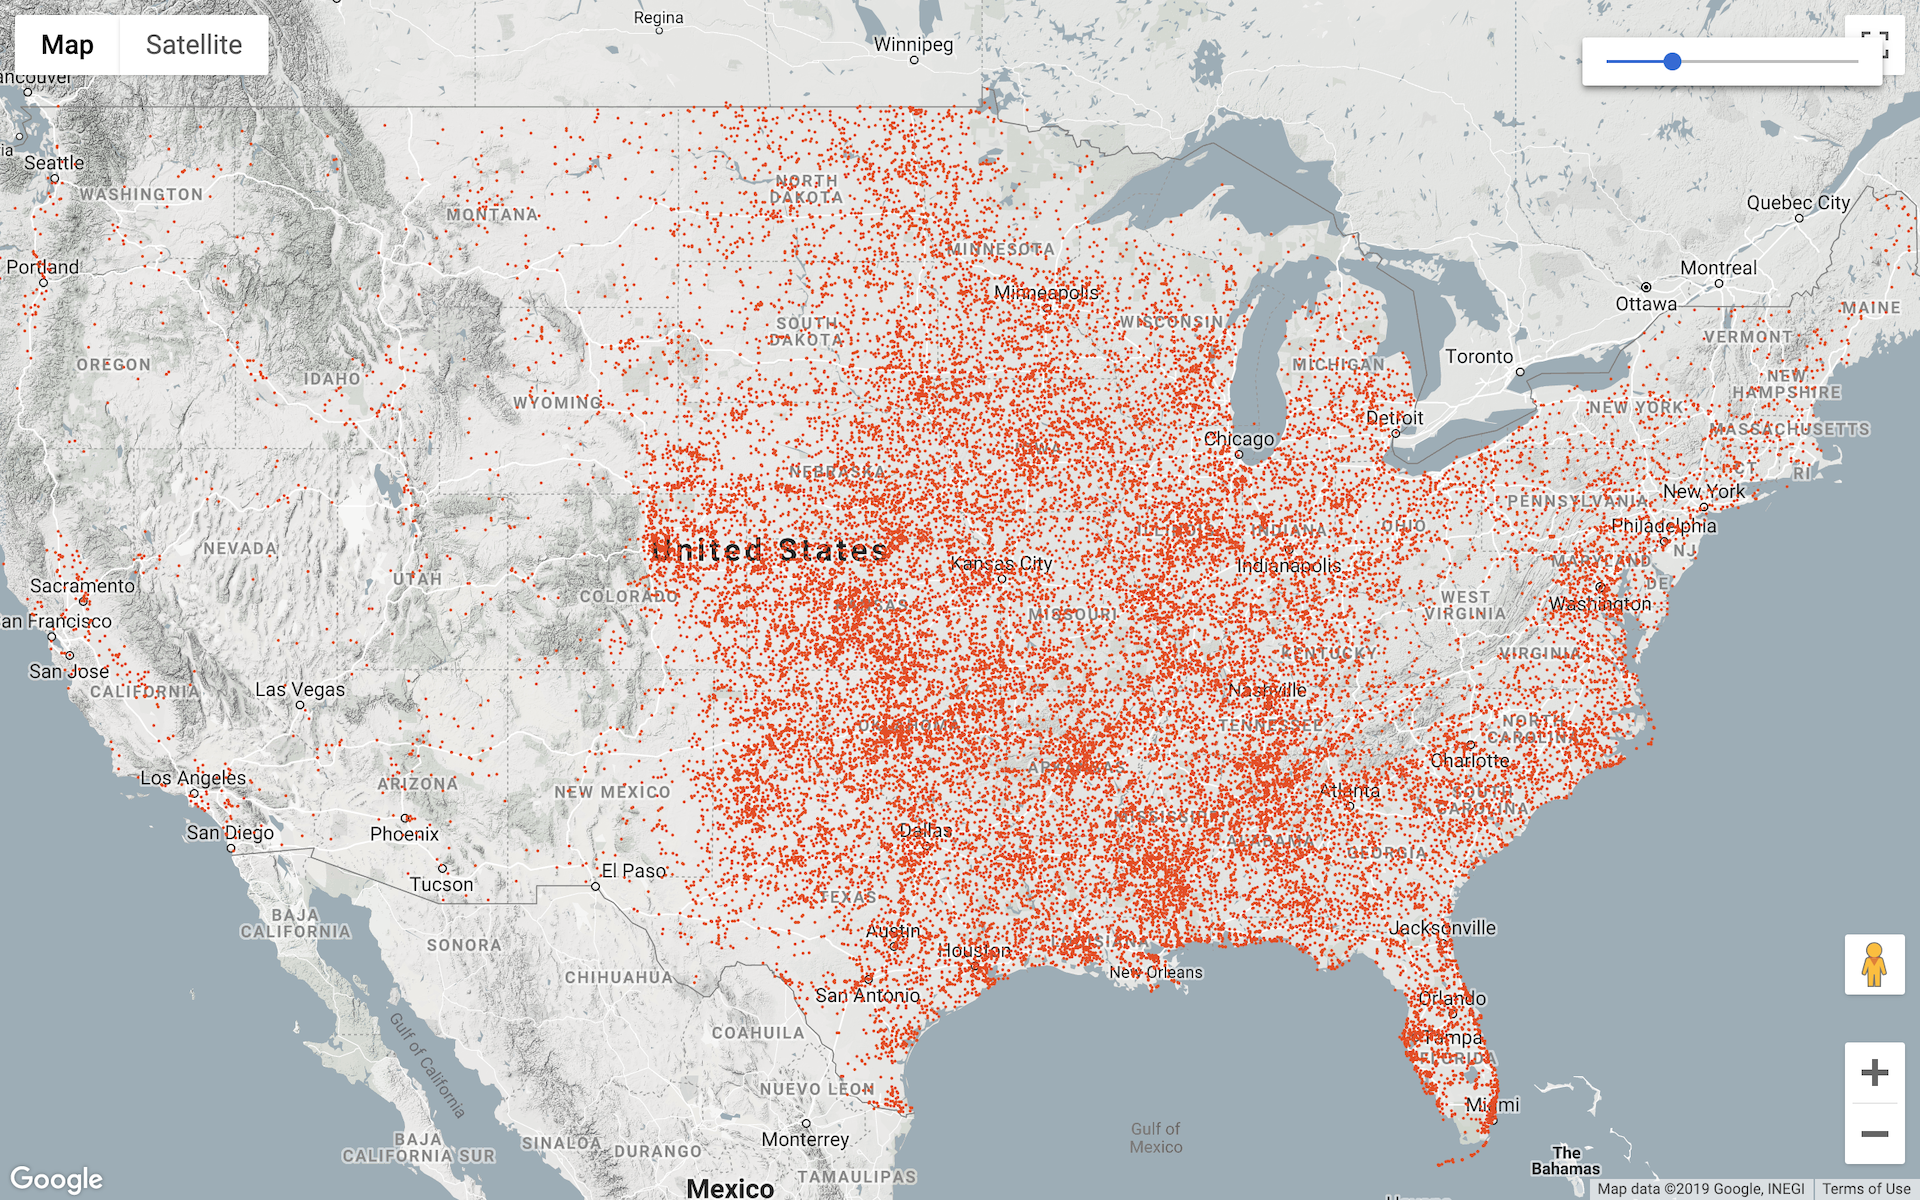
A Polymer and Google Web Components app to visualize thousands of data points over an interactive Google Map, the app loads data, passes it into WebGL, and then allows zooming in on the map.
https://github.com/smerth/polymer-visualize-tornado-data
codelab gh-pages gulp json polymer webgl
Last synced: 3 months ago
JSON representation
A Polymer and Google Web Components app to visualize thousands of data points over an interactive Google Map, the app loads data, passes it into WebGL, and then allows zooming in on the map.
- Host: GitHub
- URL: https://github.com/smerth/polymer-visualize-tornado-data
- Owner: smerth
- License: mit
- Created: 2016-12-21T20:52:27.000Z (over 9 years ago)
- Default Branch: master
- Last Pushed: 2023-03-04T04:01:46.000Z (over 3 years ago)
- Last Synced: 2025-10-05T11:42:41.578Z (9 months ago)
- Topics: codelab, gh-pages, gulp, json, polymer, webgl
- Language: HTML
- Homepage: https://smerth.github.io/polymer-visualize-tornado-data/
- Size: 6.45 MB
- Stars: 0
- Watchers: 1
- Forks: 0
- Open Issues: 2
-
Metadata Files:
- Readme: README.md
- Contributing: CONTRIBUTING.md
- License: LICENSE
Awesome Lists containing this project
README
# Welcome to polymer-visualize-tornado-data 👋


[](https://github.com/smerth/polymer-visualize-tornado#readme)
[](https://github.com/smerth/polymer-visualize-tornado/graphs/commit-activity)
[](https://github.com/smerth/polymer-visualize-tornado/blob/master/LICENSE)
[](https://twitter.com/StephenMerth)
> A Polymer and Google Web Components app to visualize thousands of data points overlayed on an interactive Google Map. The app loads data, passes it into WebGL, and then allows zooming in on the map.
### 🏠 [Homepage](https://github.com/smerth/polymer-visualize-tornado#readme)
## Prerequisites
- npm >=7.0.14
- node >=15.3.0
## Screenshot
## Install
You'll need to have node.js, bower, polymer-cli and yarn installed to begin
Install bower dependancies
```bash
bower install
```
Install polymer dependancies
```bash
polymer install
```
Install gulp to deploy to gh-pages
```bash
yarn install
```
## Add API Key
Go to the maps component in index.html and add a key to use Google Maps.
## Develop
```bash
polymer serve
```
## Build
to build the compiled app
```bash
polymer build
```
to serve the built app
```bash
polymer serve build/default
```
## Deploy to gh-pages
Set up your codebase on github and then run
```bash
gulp deploy
```
## References
[Data Visualization Using Polymer and WebGL](https://codelabs.developers.google.com/codelabs/polymer-webgl/index.html?index=..%2F..%2Findex#0)
## Author
👤 **Stephen Merth**
* Website: http://smerth.github.io
* Twitter: [@StephenMerth](https://twitter.com/StephenMerth)
* Github: [@smerth](https://github.com/smerth)
* LinkedIn: [@stephen-merth](https://linkedin.com/in/stephen-merth)
## 🤝 Contributing
Contributions, issues and feature requests are welcome!
Feel free to check [issues page](https://github.com/smerth/polymer-visualize-tornado/issues). You can also take a look at the [contributing guide](https://github.com/smerth/polymer-visualize-tornado/blob/master/CONTRIBUTING.md).
## Show your support
Give a ⭐️ if this project helped you!
## 📝 License
Copyright © 2021 [Stephen Merth](https://github.com/smerth).
This project is [MIT](https://github.com/smerth/polymer-visualize-tornado/blob/master/LICENSE) licensed.
***
_This README was generated with ❤️ by [readme-md-generator](https://github.com/kefranabg/readme-md-generator)_