https://github.com/smijsm/perforator
Continuous profiling integration for JetBrains IDEs.
https://github.com/smijsm/perforator
ai-agents claude-code googlecloud intellij-plugin jetbrains-plugin junie kotlin observability performance performance-analysis performance-optimization profiler profiling pyroscope
Last synced: 2 months ago
JSON representation
Continuous profiling integration for JetBrains IDEs.
- Host: GitHub
- URL: https://github.com/smijsm/perforator
- Owner: smijsm
- License: mit
- Created: 2025-09-14T13:01:05.000Z (10 months ago)
- Default Branch: main
- Last Pushed: 2025-10-04T09:58:09.000Z (10 months ago)
- Last Synced: 2025-10-04T11:36:49.759Z (10 months ago)
- Topics: ai-agents, claude-code, googlecloud, intellij-plugin, jetbrains-plugin, junie, kotlin, observability, performance, performance-analysis, performance-optimization, profiler, profiling, pyroscope
- Language: Kotlin
- Homepage: https://plugins.jetbrains.com/plugin/28478-perforator
- Size: 126 KB
- Stars: 0
- Watchers: 0
- Forks: 0
- Open Issues: 0
-
Metadata Files:
- Readme: README.md
- Changelog: CHANGELOG.md
- License: LICENSE
Awesome Lists containing this project
README
# Perf🕳️rat🕳️r – Continuous Profiling Integration for JetBrains IDE
[](LICENSE)
[](https://plugins.jetbrains.com/)
[](#)
Bring continuous profiling data from Grafana Pyroscope or Google Cloud Profiler into the editor, highlight hot spots inline, and generate MCP-ready AI optimization prompts for Junie, Claude Code or other AI agents.
---
## 🎯 Why Perforator
Performance work is most effective when grounded in production behavior. Perforator fetches real continuous profiling data and overlays it next to the code being profiled, so optimization decisions are made with context.
---
## ✨ Features
- 🔥 Inline gutter badges with CPU time or memory usage per method
- 🧭 Editor toolbar to switch CPU/Memory, select time windows, and set hot thresholds
- 🧭 API integration with Grafana Pyroscope or Google Cloud Profiler file upload (.pb.gz files)
- 🔒 Optional Basic Auth for secured Grafana Pyroscope instances
- ⚡ One-click fetch via Tools menu
- 🧠 Right-click a badge to copy an AI optimization prompt
- Pyroscope: prompts are tailored for Grafana MCP server (https://github.com/grafana/mcp-grafana) which can be used with JetBrains Junie, Claude Code, or any other AI agent which supports MCP servers.
- Google Profiler: can be used with JetBrains Junie, Claude Code, or any other AI agent.
- 🧩 Language support: Java and Kotlin
---
## 🚀 Quick Start
### Prerequisites
- IntelliJ IDEA 2025.1.2+ / Android Studio 2025.1.2+
- API access to a Grafana Pyroscope instance or web access to the Google Cloud Profiler
### Installation
1. Download the plugin from the JetBrains Plugin Repository
2. Install via: File → Settings → Plugins → Install Plugin from Disk
3. Restart IntelliJ IDEA
### Configuration (Pyroscope-only, not required for Google Profiler)
Open Settings → Tools → Perforator and configure:
- Base URL: e.g. `http://localhost:4040`
- Optional Basic Auth: username/password
- Service Name: matches your Pyroscope label (e.g. `service_name`)
- Profile Type: `CPU` or `Memory`
- Time Window: `now-15m`, `now-30m`, `now-1h`, `now-1d`, `now-3d`, `now-1w`
---
## 🎯 How to Use
### Option 1: Fetch from Grafana Pyroscope via API
[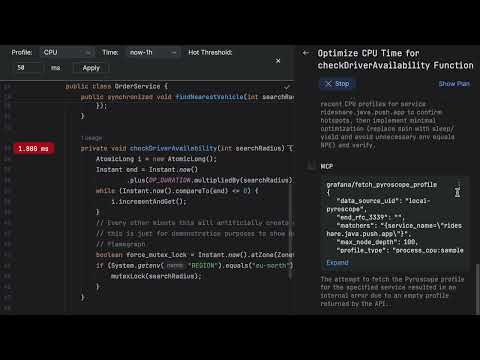](https://www.youtube.com/watch?v=QTJ3MyH7Ydw)
1. Open a source file that belongs to the profiled service.
2. Use Tools → Fetch Profiling Data.
3. Gutter badges show inline metrics next to relevant lines.
4. The Perforator toolbar appears at the top of the editor.
5. Switch between CPU/Memory profiles and pick a time window.
6. Adjust hot thresholds (ms for CPU, MB for Memory).
7. Right-click a badge to copy an AI prompt.
8. Paste prompt into your AI agent (Junie, Claude Code, etc.) which has integration with the Grafana MCP.
9. Let your AI agent refactor your code to improve performance.
### Option 2: Load Google Cloud Profiler File
[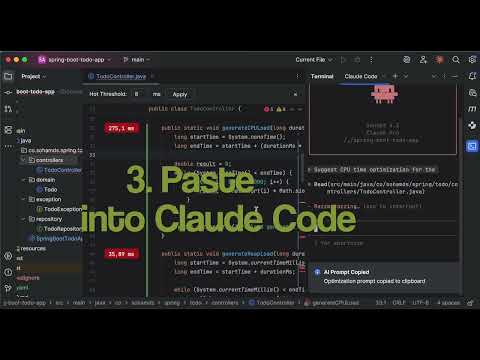](https://www.youtube.com/watch?v=2wLag5WnM30)
1. Download a .pb.gz file from Google Cloud Profiler (CPU time / Wall time / Heap)
2. Use Tools → Load Profile File (.pb.gz).
3. Select your downloaded profile file.
4. Gutter badges show inline metrics next to relevant lines.
5. The Perforator toolbar appears at the top of the editor.
6. Adjust hot thresholds (ms for CPU, MB for Memory).
7. Right-click a badge to copy an AI prompt.
8. Paste prompt into your AI agent (Junie, Claude Code, etc.).
9. Let your AI agent refactor your code to improve performance.
---
## 🏗️ Supported Inputs
- Data Sources
- Grafana Pyroscope (via API)
- Google Cloud Profiler (.pb.gz files)
- Profile Types
- CPU: displays execution time
- Memory: displays allocation
- Wall Time: displays execution time (only for Google Profiler)
- Time Windows
- `now-15m`, `now-30m`, `now-1h`, `now-1d`, `now-3d`, `now-1w`
- Languages
- Java, Kotlin
---
## 🗺️ Roadmap
- Additional continuous profiling backends beyond Grafana Pyroscope and Google Profiler
- More languages (e.g., Scala)
- Integrated flamegraph navigation
---
## 🧩 Development
- Java 17+
- Gradle IntelliJ plugin
- Run locally: `./gradlew runIde`
### IDE Integration Points
- Tools → Fetch Profiling Data (Grafana Pyroscope)
- Tools → Load Profile File (.pb.gz) (Google Cloud Profiler)
- Settings → Tools → Perforator
---
## 📄 License
MIT License — see `LICENSE`.
---
## 👨💻 Author
**Michael Solovev** — [smijsm@gmail.com](mailto:smijsm@gmail.com)
---
Optimize where it matters — with real, continuous profiling data in your editor.