https://github.com/soil-dev/dope-plot
Radar, quadrant and comparison charts for TICK four-bird personality profiles — CLI and MCP server
https://github.com/soil-dev/dope-plot
personality-profiling tick
Last synced: about 24 hours ago
JSON representation
Radar, quadrant and comparison charts for TICK four-bird personality profiles — CLI and MCP server
- Host: GitHub
- URL: https://github.com/soil-dev/dope-plot
- Owner: soil-dev
- License: apache-2.0
- Created: 2025-01-13T09:24:29.000Z (over 1 year ago)
- Default Branch: master
- Last Pushed: 2026-06-02T08:20:19.000Z (23 days ago)
- Last Synced: 2026-06-02T10:17:25.786Z (23 days ago)
- Topics: personality-profiling, tick
- Language: Python
- Homepage: https://github.com/soil-dev/bird-plot
- Size: 109 MB
- Stars: 0
- Watchers: 1
- Forks: 0
- Open Issues: 0
-
Metadata Files:
- Readme: README.md
- License: LICENSE
Awesome Lists containing this project
README
# Dope-Plot
**Dope-Plot** is a Python-based visualization tool for generating quadrant-style plots of [tick.com.au](https://tick.com.au)’s four-bird personality styles (Eagle, Dove, Owl, and Peacock). It takes as input a data file (e.g., CSV) of individual or group personality scores and produces informative charts that help users quickly see:
- **Individual** personality radar plots
- **Team** or **group** distributions in a quadrant layout
- **Pairwise** comparisons (overlap of two individuals’ personalities)
…either from the command line or straight from an AI assistant via the bundled
[MCP server](#use-from-ai-assistants-mcp).
These plots are especially useful for workshops, coaching sessions, and team-building exercises, as they visualize how individuals align or differ on the four “bird” dimensions.
### The four birds
Each person scores on four traits, and the scatter plot places them on a
quadrant defined by two axes: **assertive ↔ reserved** (horizontal) and
**people-oriented ↔ task-oriented** (vertical).
| Bird | Quadrant | Style | Tends to be |
| --- | --- | --- | --- |
| **Dove** | top-right | Supportive & Caring | warm, people-oriented, reserved |
| **Peacock** | top-left | Talkative & Dramatic | warm, people-oriented, assertive |
| **Eagle** | bottom-left | Controlling & Forceful | task-oriented, assertive |
| **Owl** | bottom-right | Analytical & Logical | task-oriented, reserved |
Most people lead with one bird (their *primary*) and lean on a second
(*secondary*); the charts show that blend rather than forcing a single label.
[The Tick personality profiling system](https://tick.com.au) has been appreciated by many in the fields of sales training, leadership coaching, and personal development for its simplicity and ease of communication. Dope-Plot leverages this established framework to provide clear, accessible visualizations that help users understand and compare personality traits quickly. While the tool provides valuable insights and serves as a catalyst for discussion and reflection, users are encouraged to complement these insights with additional information and professional judgment.
---
## Table of Contents
1. [Features](#features)
2. [Installation](#installation)
3. [Usage](#usage)
4. [Input Data Format](#input-data-format)
5. [Use from AI assistants (MCP)](#use-from-ai-assistants-mcp)
6. [Testing](#testing)
7. [Example Outputs](#example-outputs)
8. [Design Notes](#design-notes)
---
## Features
- **Radar Plot** for individuals:
- Shows how a single person’s personality scores map onto the four quadrants.
- A polygon connecting each dimension’s score.
- **Team/Group Distribution**:
- Plots multiple people on a quadrant-based chart, illustrating the distribution of personalities in a single view.
- Useful for quickly identifying group strengths, diversity, and potential gaps.
- **Pairwise Comparison**:
- Overlays two individuals’ radar polygons on the same chart to highlight similarities and differences.
- Displays a percentage overlap for a quick gauge of alignment.
---
## Installation
1. **Clone or Download the Repository**
```bash
git clone https://github.com/soil-dev/dope-plot.git
cd dope-plot
```
2. **Install Dependencies with Poetry**
This project uses [Poetry](https://python-poetry.org/) for dependency management.
```bash
poetry install
```
3. **(Optional) Activate the Virtual Environment**
```bash
poetry env activate
```
(On Poetry 2.x `poetry shell` moved to a plugin; `poetry env activate` prints the
activation command.) Or you can use `poetry run ...` without activating the shell.
4. **Verify Installation**
```bash
poetry run dope-plot --help
```
This should display a help message with usage instructions.
## Usage
1. **Prepare Your Data**
Ensure you have a CSV or similar data file that includes each person’s scores. (See [Input Data Format](#input-data-format) below.)
2. **Run Dope-Plot**
```bash
poetry run dope-plot --data data.csv --graph radar scatter
```
- --data Path to the CSV data file (default: data.csv)
- --graph Type of graph to generate (radar or scatter)
- --config Optional path to a TOML config file. If omitted, Dope-Plot uses
`./config.toml` when present, otherwise its bundled defaults.
3. **Check Generated Plots**
The script will create .png files in the charts folder.
_Note: Run `poetry run dope-plot --help` for detailed usage._
## Input Data Format
| Name | Dove | Eagle | Owl | Peacock | Note |
| ----- | ---- | ----- | --- | ------- | ---- |
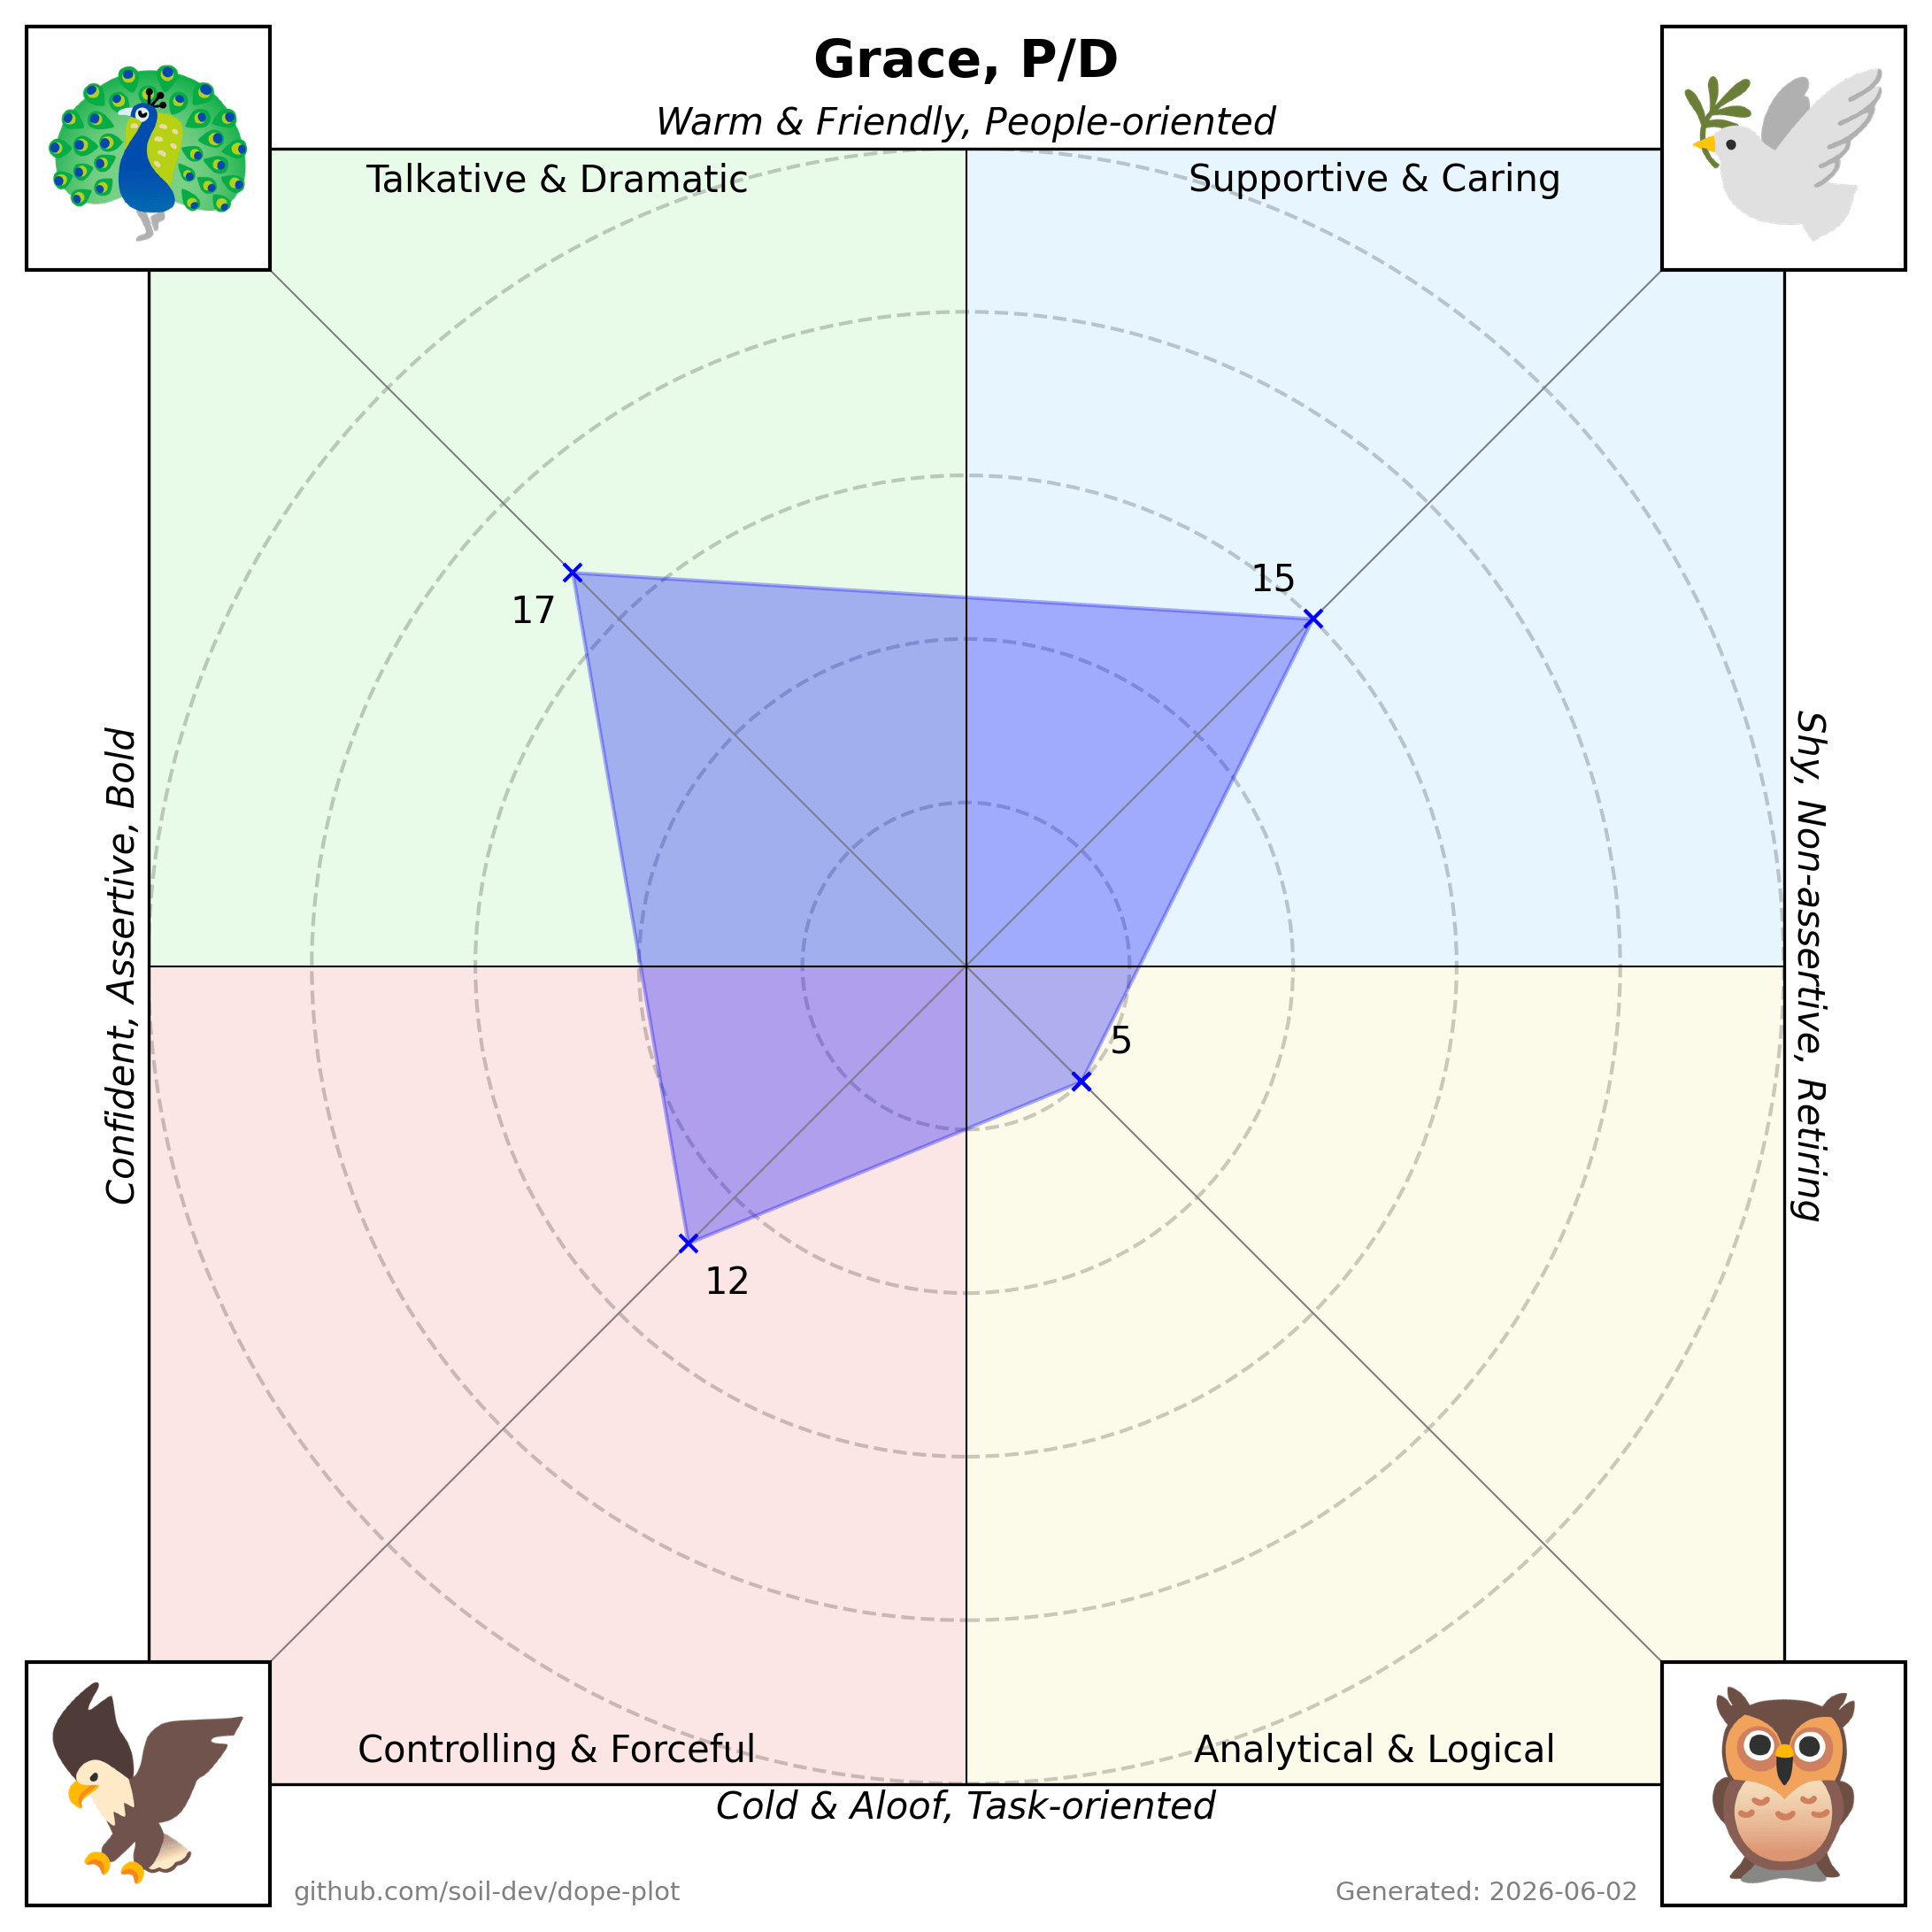
| Grace | 15 | 12 | 5 | 17 | P/D |
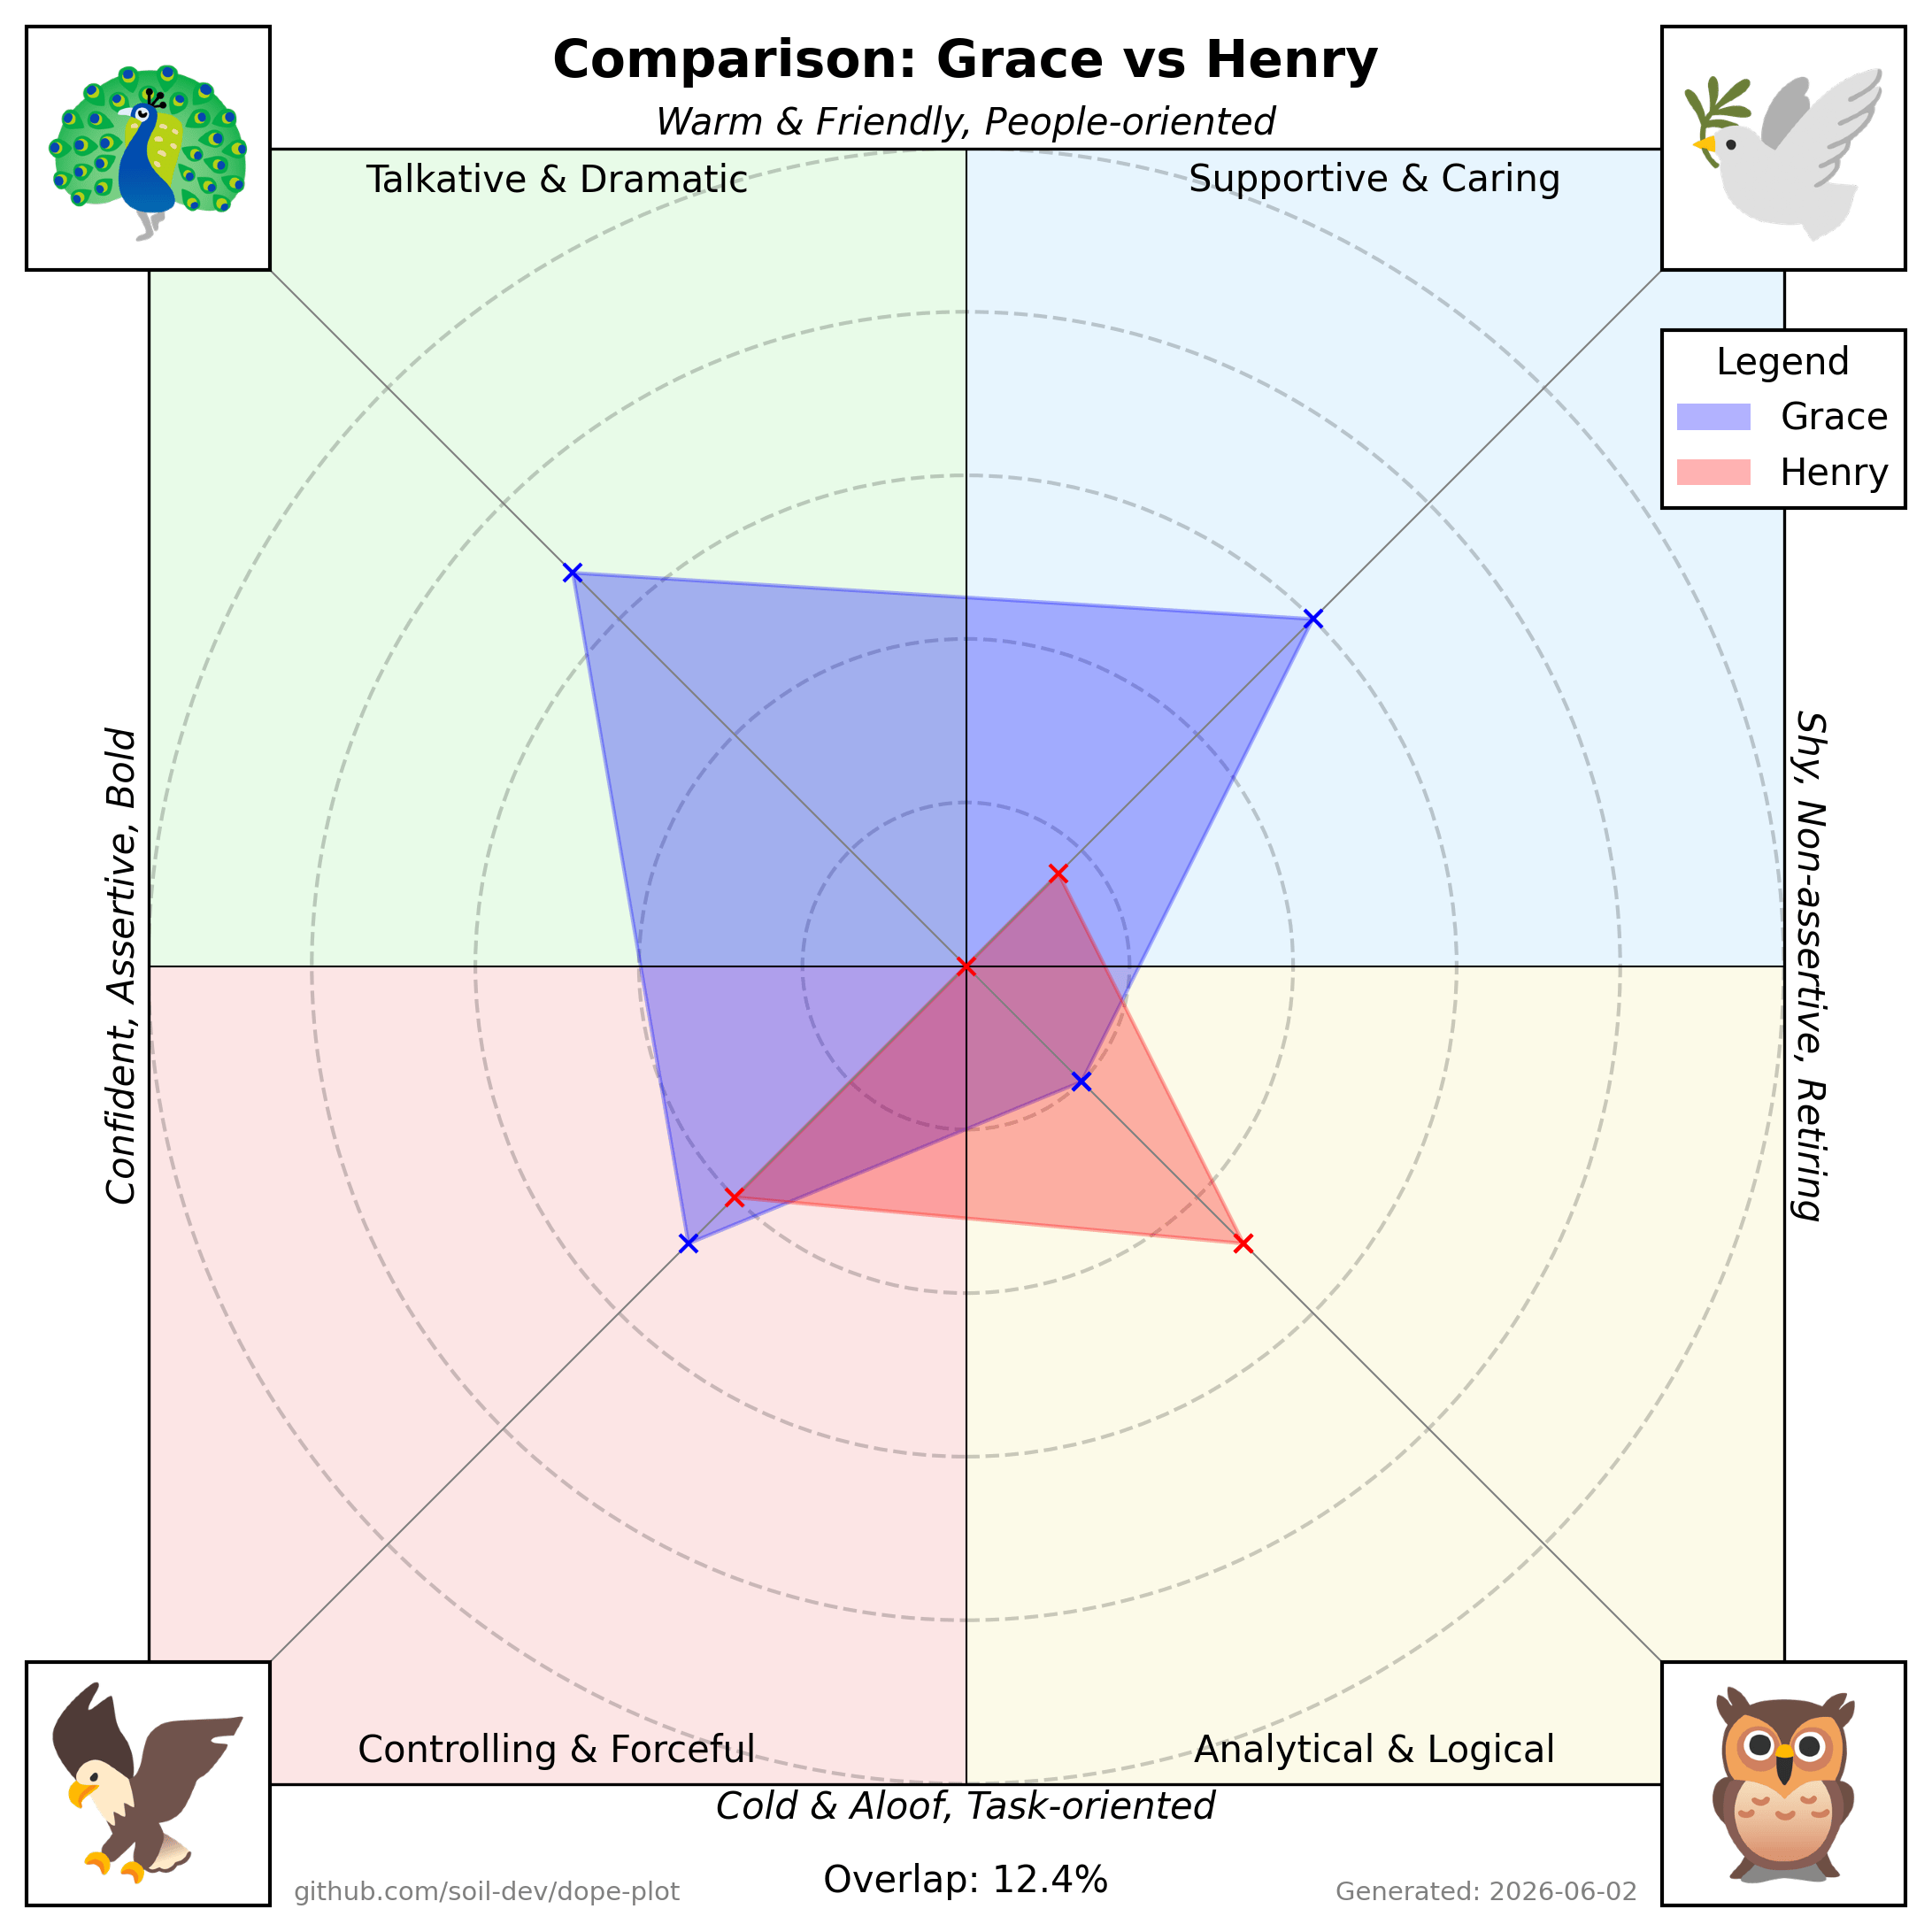
| Henry | 4 | 10 | 12 | 0 | O/E |
| ... | ... | ... | ... | ... | ... |
- **Name**: The individual’s name or identifier.
- **Dove, Eagle, Owl, Peacock**: Numeric scores representing each “bird” trait.
- **Note**: Individual's primary and secondary dominant "bird" traits, separated by a forward slash.
## Use from AI assistants (MCP)
Dope-Plot ships a [Model Context Protocol](https://modelcontextprotocol.io)
server so AI assistants can generate charts directly, getting the rendered PNG
back inline. It works with any MCP-capable client (Claude Desktop/Code, n8n's
MCP node, OpenAI agents, …).
Install with the optional `mcp` extra and run the server (it speaks MCP over
stdio):
```bash
pip install 'dope-plot[mcp]'
dope-plot-mcp
```
Then register it in your client. For example, Claude Desktop
(`claude_desktop_config.json`) or Claude Code (`.mcp.json`):
```json
{
"mcpServers": {
"dope-plot": { "command": "dope-plot-mcp" }
}
}
```
Tools exposed (each returns a PNG):
- **`scatter_chart(csv)`** — the group quadrant plot from CSV text
(`Name,Dove,Eagle,Owl,Peacock[,Note]`).
- **`radar_chart(name, dove, eagle, owl, peacock, note="")`** — one person's radar.
- **`comparison_chart(...two people's scores...)`** — overlay two radars with an
overlap percentage.
No `config.toml` is required — the server uses the bundled defaults and assets.
## Testing
Run the test suite with:
```bash
poetry run pytest
```
## Example Outputs
1. **Individual Radar Plot**
- Plots one person’s scores around four axes (Eagle, Dove, Owl, Peacock).
- The polygon edges connect each axis’s numeric value, visually representing personality strengths.
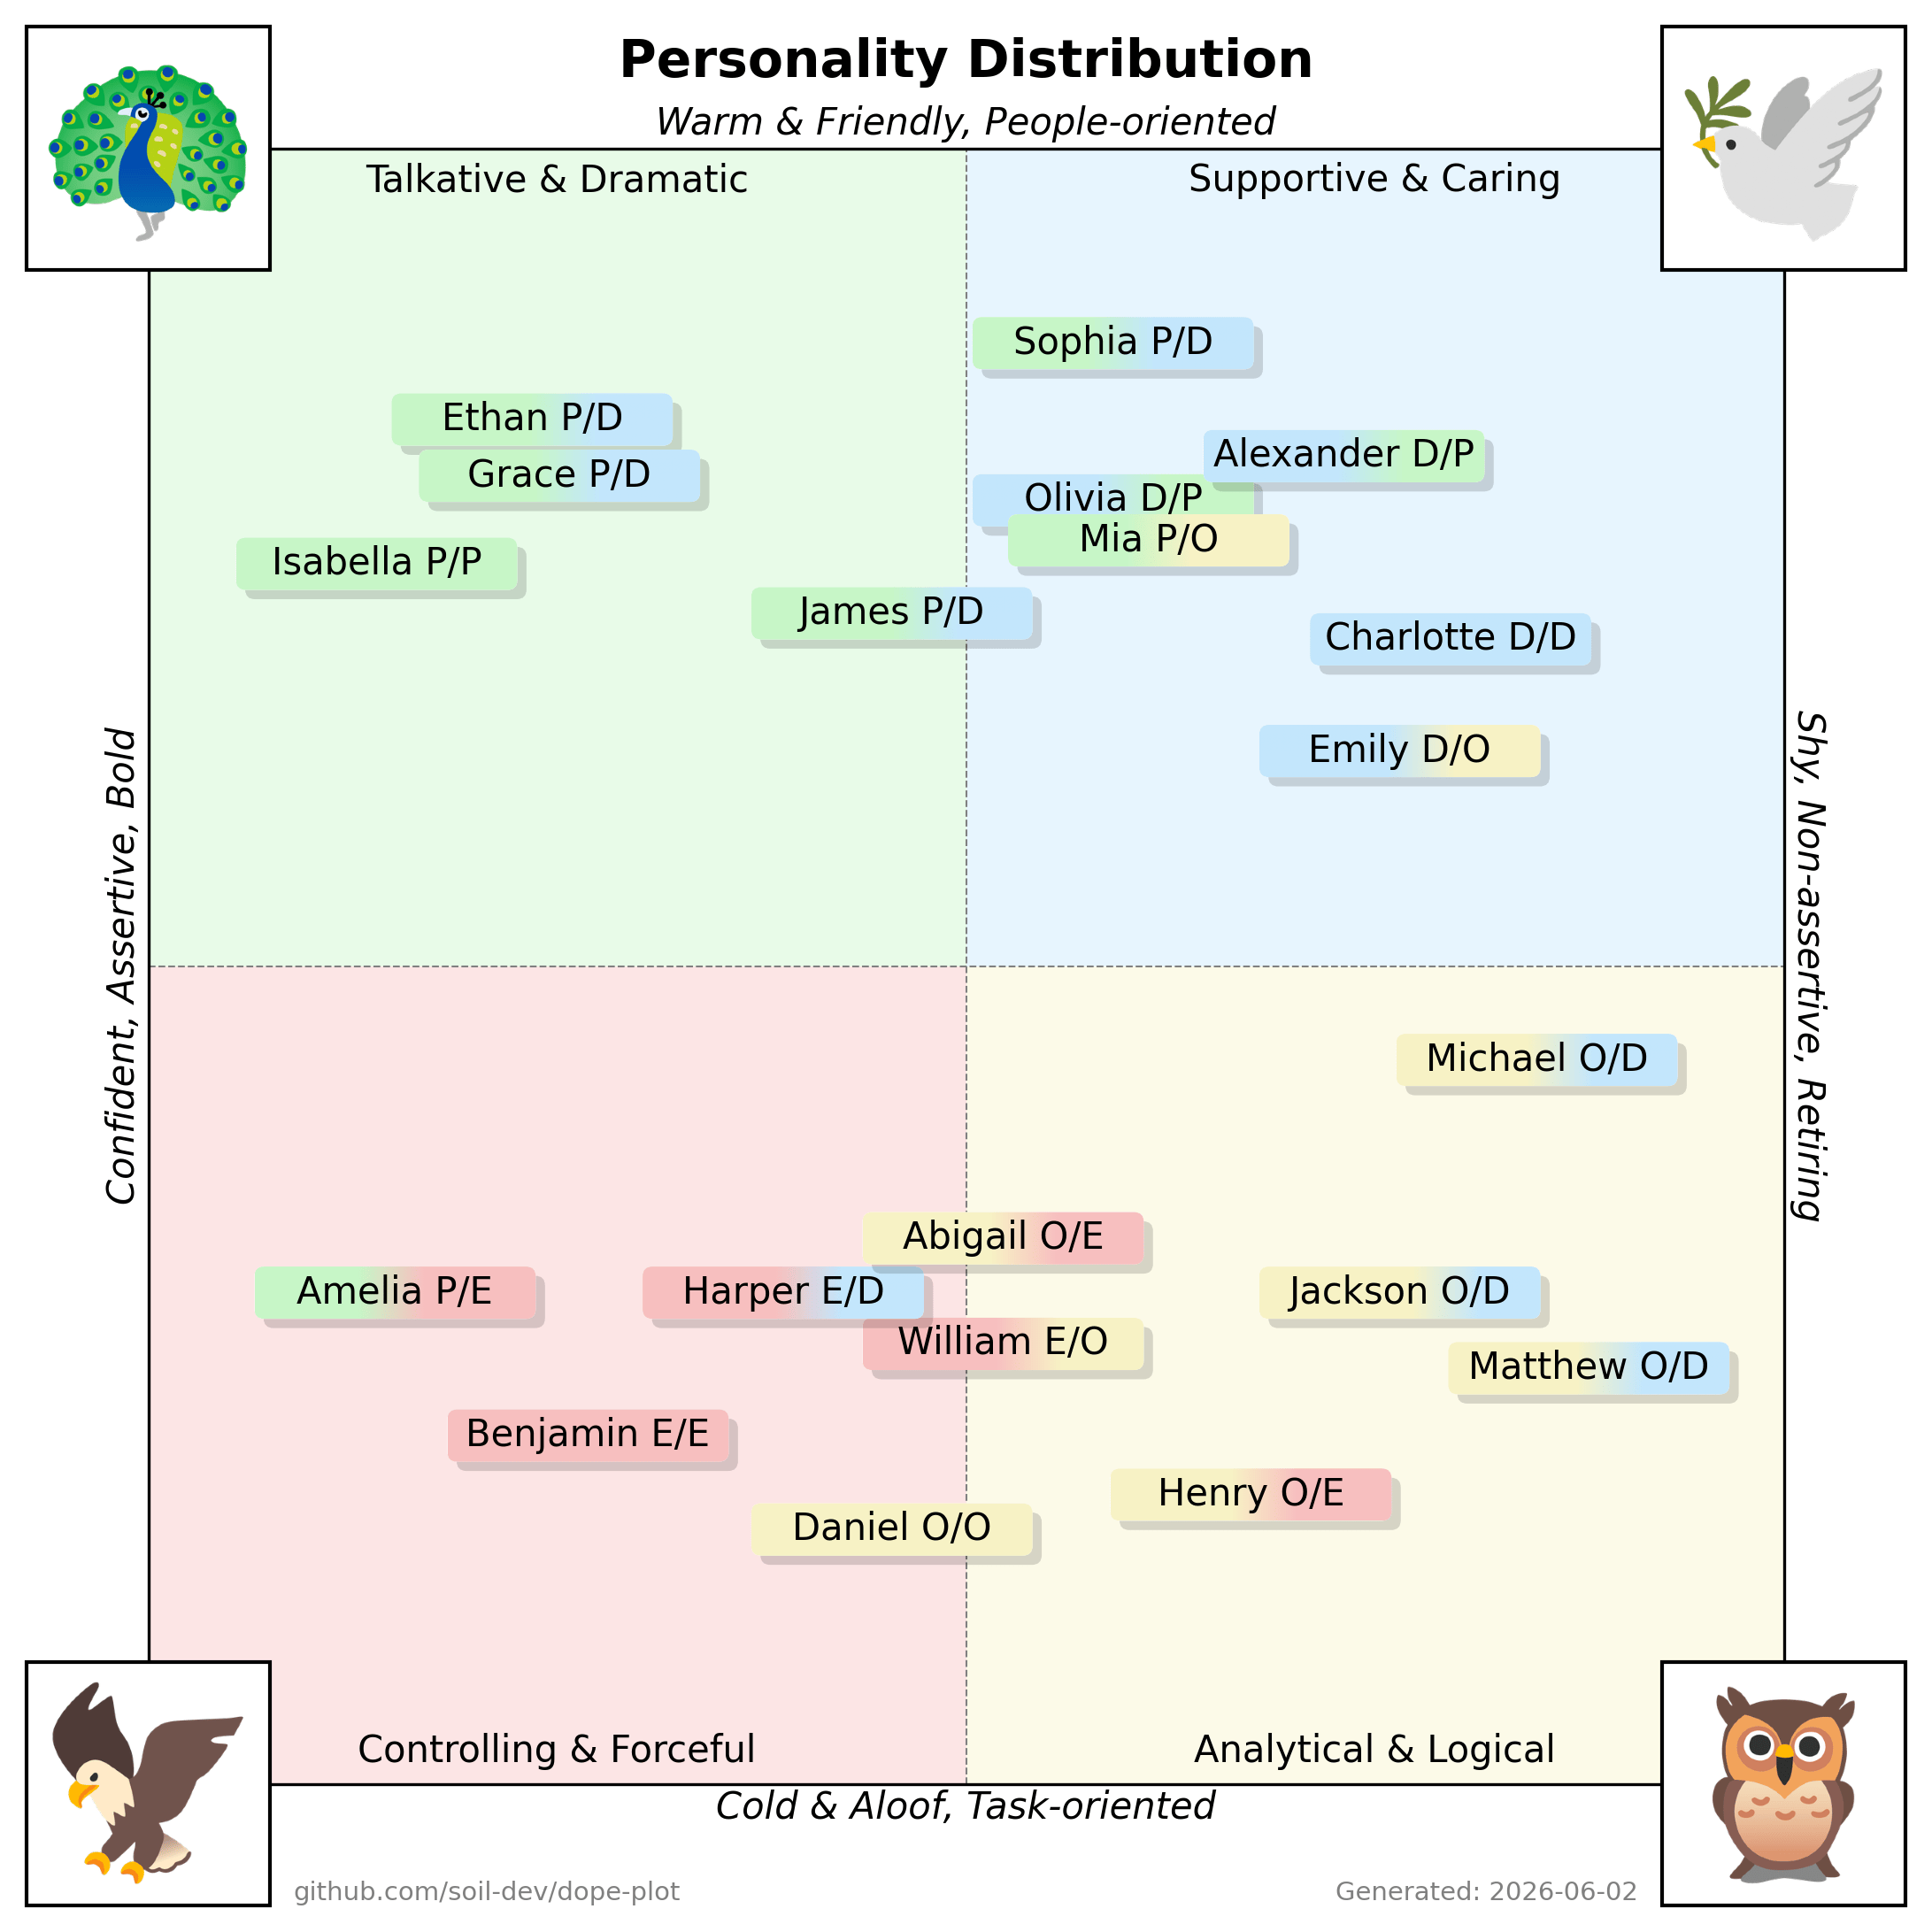
2. **Group/Team Distribution - Scatter Plot**
- Displays multiple names on a quadrant chart.
- Each quadrant corresponds to a “bird” style, with positions indicating how strongly each person aligns to one or more dimensions.
3. **Comparison/Overlap Plot**
- Overlays two radar plots for a side-by-side comparison.
- Shows an “Overlap” percentage as a measure of similarity.
_(Note: The above images are illustrative examples.)_
## Design Notes
The scatter plot scales each cohort to fill the quadrants so that name boxes
spread out instead of colliding. This is a deliberate trade-off (positions are
relative to the loaded group, not absolute). See
[docs/DESIGN.md](docs/DESIGN.md) for the rationale and before/after examples.
## License
This project is licensed under the [Apache 2.0 License](LICENSE). You are free to use, modify, and distribute this software in accordance with the license terms.