https://github.com/soloplugins-pocketmine/pmmp-prometheus-exporter
A Time-Series DB, Prometheus Exporter for PocketMine-MP
https://github.com/soloplugins-pocketmine/pmmp-prometheus-exporter
grafana plugin pmmp pmmp-plugin pmmp-servers pocketmine-mp pocketmine-mp-plugin prometheus prometheus-exporter tsdb
Last synced: 3 months ago
JSON representation
A Time-Series DB, Prometheus Exporter for PocketMine-MP
- Host: GitHub
- URL: https://github.com/soloplugins-pocketmine/pmmp-prometheus-exporter
- Owner: SOLOPlugins-PocketMine
- Created: 2020-05-30T18:15:12.000Z (almost 5 years ago)
- Default Branch: master
- Last Pushed: 2023-04-19T19:38:07.000Z (about 2 years ago)
- Last Synced: 2025-01-30T21:04:09.905Z (4 months ago)
- Topics: grafana, plugin, pmmp, pmmp-plugin, pmmp-servers, pocketmine-mp, pocketmine-mp-plugin, prometheus, prometheus-exporter, tsdb
- Language: PHP
- Size: 1.12 MB
- Stars: 10
- Watchers: 2
- Forks: 0
- Open Issues: 2
-
Metadata Files:
- Readme: README.md
Awesome Lists containing this project
README
# pmmp-prometheus-exporter
A data exporter for monitoring PocketMine-MP server.
## Download
* [**Latest Phar**](https://github.com/solo5star/pmmp-prometheus-exporter/releases/latest/download/pmmp-prometheus-exporter.phar)
* [**Grafana Dashboard(JSON)**](https://raw.githubusercontent.com/solo5star/pmmp-prometheus-exporter/master/grafana-dashboard.json)
## How it works?
Create a thread and run HTTP server. By default, server bind to address `0.0.0.0:9655`.
Prometheus request to each node(In this case pmmp-prometheus-exporter) for gathering metrics data.
Thread will request metrics data to plugin (in Main Thread) and return data which gathered by plugin.
Finally, data is send to Prometheus.
---
Reference: Prometheus architecture

## So what should I do to setup monitoring system?
First, you have to install [**Prometheus**](https://prometheus.io/docs/prometheus/latest/getting_started/) + [**Grafana**](https://grafana.com/docs/grafana/latest/getting-started/getting-started/)
After finished installation, add this plugin to plugins folder.
When server started, plugin will open prometheus exporter on 9655 port.
Second, register the exporter on `prometheus.yml`.
```yml
scrape_configs:
- job_name: 'pmmp'
static_configs:
- targets: [':9655']
```
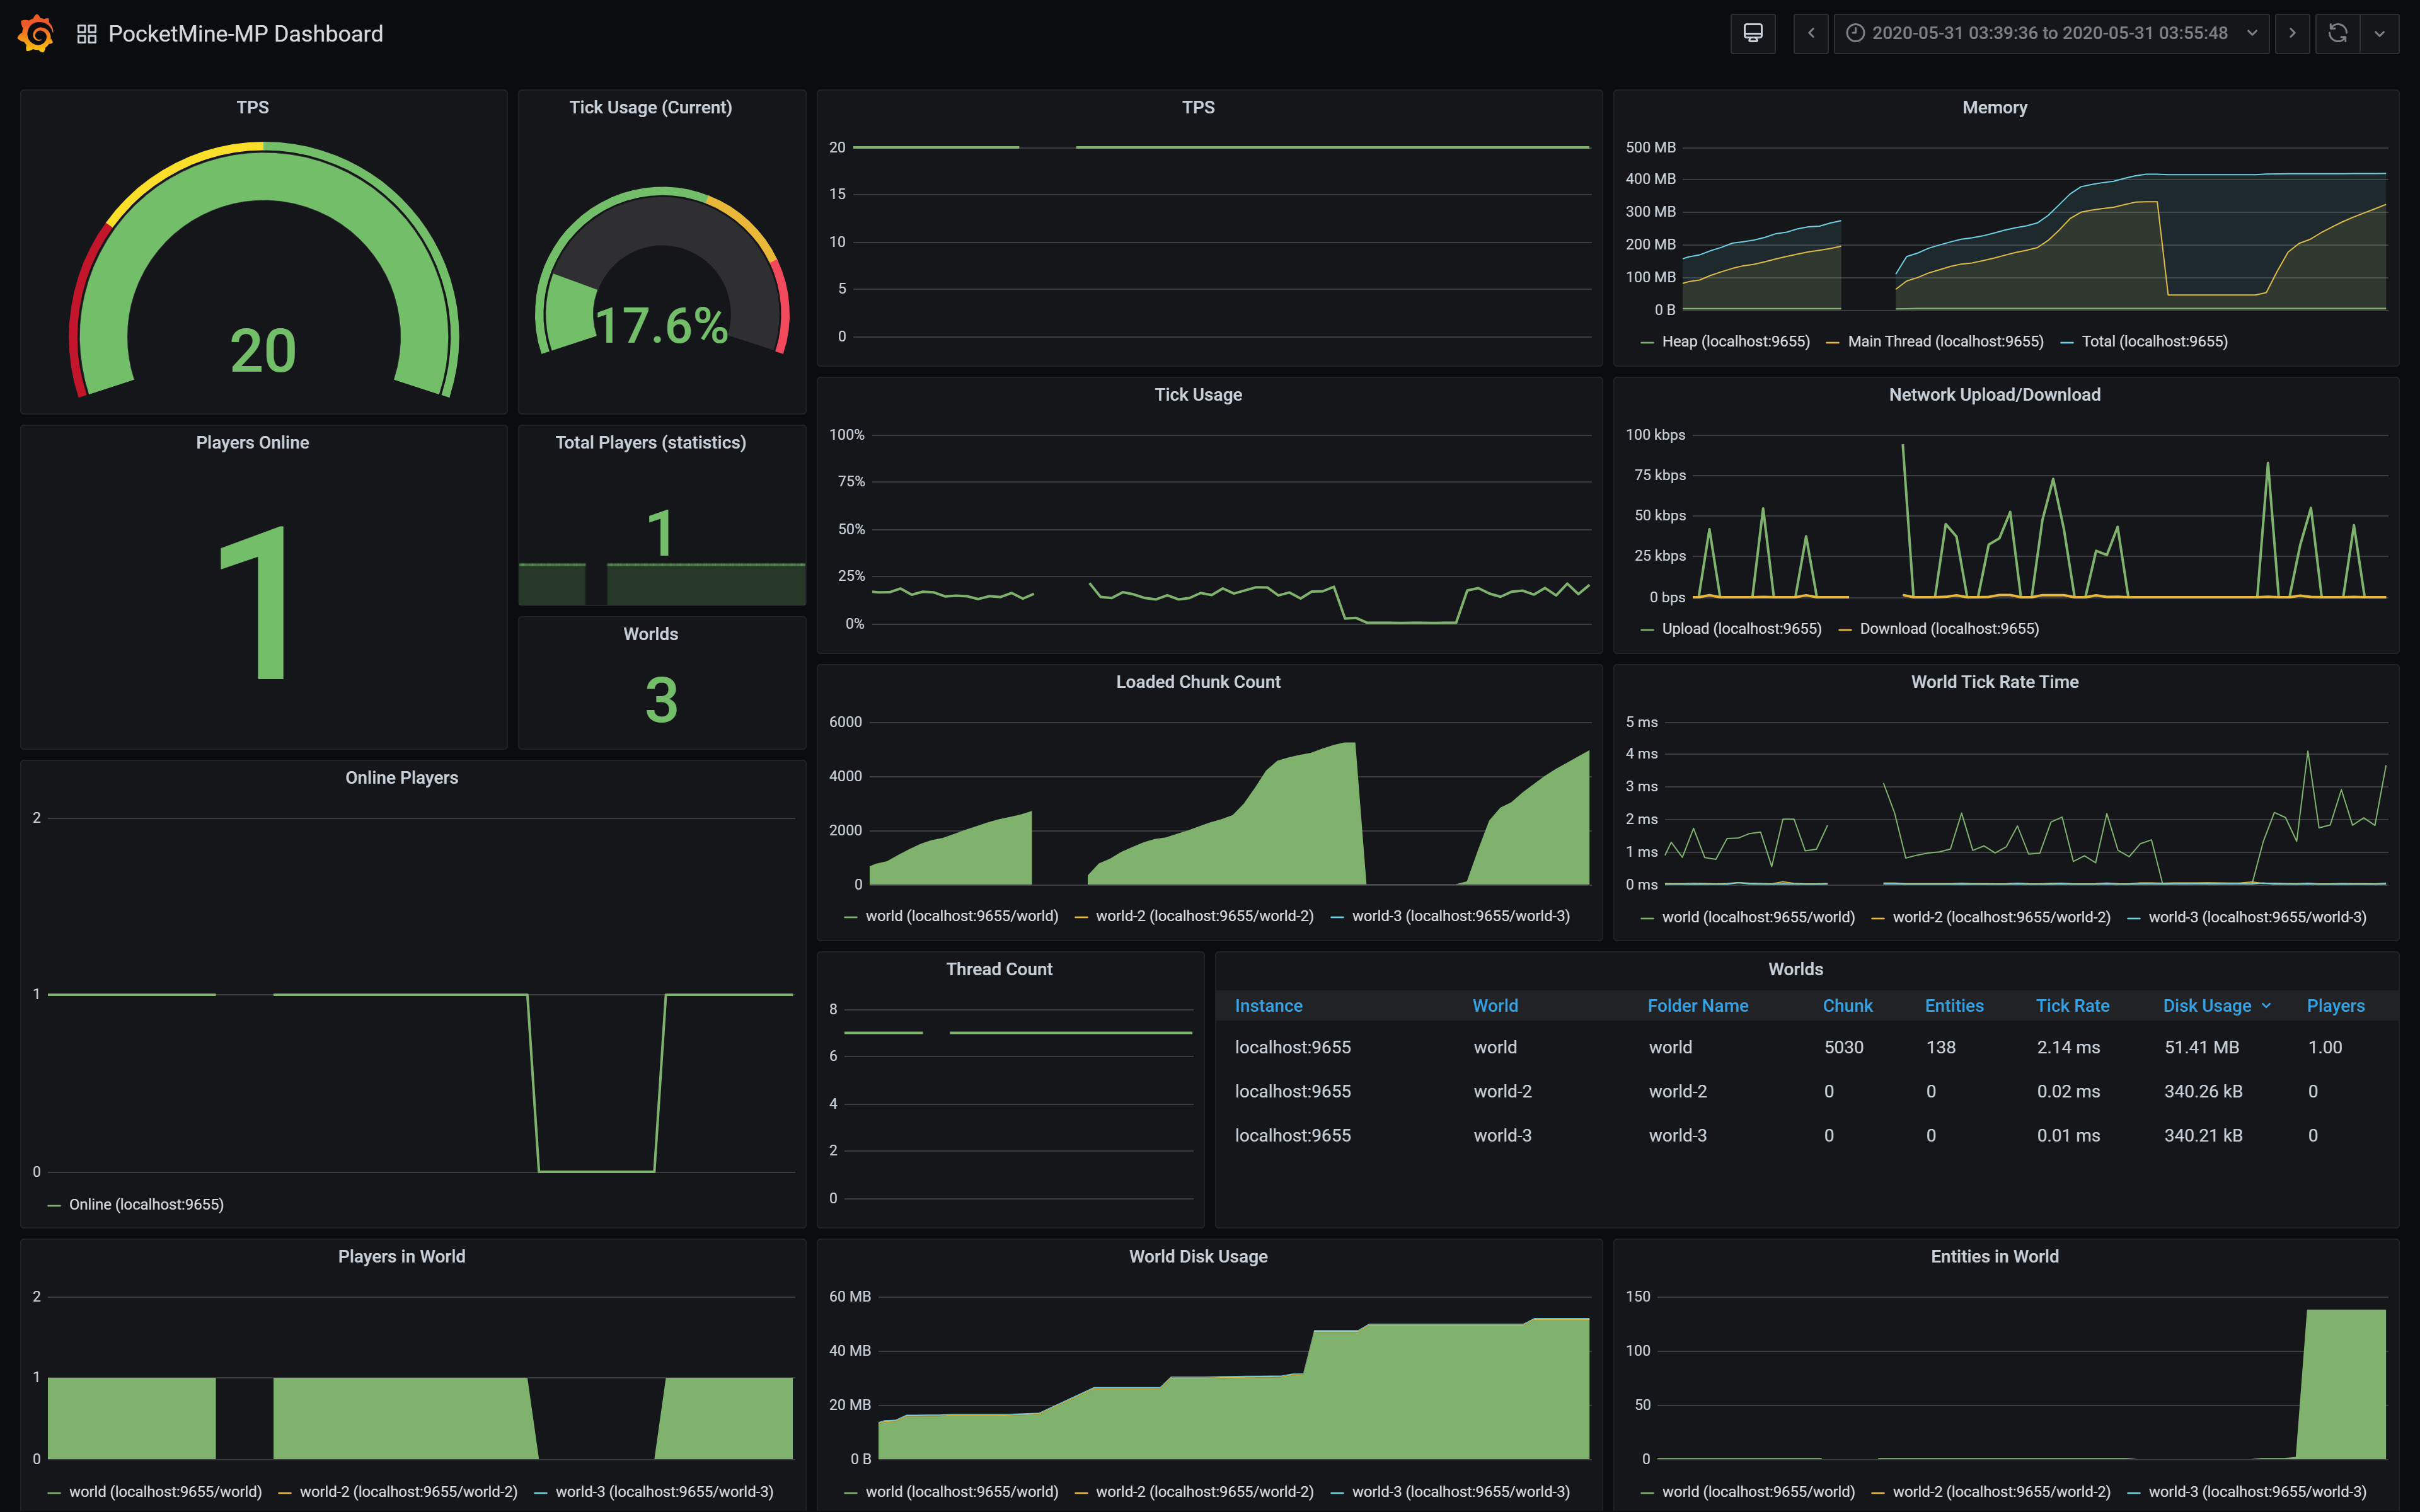
This is an example using [**Prometheus**](https://prometheus.io/docs/prometheus/latest/getting_started/) + [**Grafana**](https://grafana.com/docs/grafana/latest/getting-started/getting-started/).
## Metrics List
|Metric|Description|Enabled(default)|
|-|-|-|
|pmmp_memory_heap_bytes|Memory usage of heap|true|
|pmmp_memory_main_thread_bytes|Memory usage of main thread|true|
|pmmp_memory_maximum_bytes|Maximum size of system memory|true|
|pmmp_memory_total_bytes|Total size of memory|true|
|pmmp_network_download_bytes|Network download traffic usage|true|
|pmmp_network_upload_bytes|Network upload traffic usage|true|
|pmmp_player_online_count|Count of online players|true|
|pmmp_player_total_count|Total count of players (Online+Offline)|true|
|pmmp_thread_count|PocketMine Thread count|true|
|pmmp_ticks_per_second|Indicates how much server lag spikes. (TPS)|true|
|pmmp_tick_usage|How much tick using|true|
|pmmp_world_chunk_loaded|Loaded chunk count|true|
|pmmp_world_disk_usage_bytes|Disk usage of world|true|
|pmmp_world_entity_count|Count of entity|true|
|pmmp_world_loaded|Currently loaded world|true|
|pmmp_world_player_count|How many players in world|true|
|pmmp_world_tick_rate|Tick rate time(millisecond) of world|true|