https://github.com/sonsongithub/f2-210
Scripts, documents and config files for F2-210.
https://github.com/sonsongithub/f2-210
Last synced: 10 months ago
JSON representation
Scripts, documents and config files for F2-210.
- Host: GitHub
- URL: https://github.com/sonsongithub/f2-210
- Owner: sonsongithub
- License: mit
- Created: 2021-06-04T16:43:22.000Z (about 5 years ago)
- Default Branch: main
- Last Pushed: 2021-06-13T08:52:56.000Z (almost 5 years ago)
- Last Synced: 2025-03-29T05:11:19.023Z (about 1 year ago)
- Language: Shell
- Size: 13.7 KB
- Stars: 1
- Watchers: 2
- Forks: 0
- Open Issues: 0
-
Metadata Files:
- Readme: README.md
- License: LICENSE
Awesome Lists containing this project
README
## F2-210
I bought this NAS, F2-210, for Time machine, that is macOS backup system, but since I don't use Time machine much anymore, I've started using it as a regular file server. Its main use has become a place to store Scratch and captured game videos made by my sons. As a result, As a result, there is a surplus of capacity of the NAS. The F2-210 runs on ARM and on Linux distributed by a company called Terramaster called TOS. TOS has a browser-based GUI, and users can also install Docker to it with the GUI tool.
## Monitoring
I tried to use EdgerouterX to setup VPN. I wanted to have a monitoring system to check for anomaly accesses. So I decided to create a monitoring system for this NAS. Typicall, one can choise nagios and SNMP for monitoring. I don't want to use nagios because of its representaion is very poor.
I have some options.
1. nagios
2. icinga
3. zabbix
4. others
I could find only icinga and nagios docker files on ARM CPU. So, I choose icinga2 for my SNMP agent.
## How to install, icinga2 and graphite
One has to setup two containers, graphite and icinga2. graphite is needed for visualizing the performace data in a graph on icinga2.
1. [graphite at docker hub](https://hub.docker.com/r/graphiteapp/graphite-statsd/)
2. [icinga2 at docker hub](https://hub.docker.com/r/jordan/icinga2/)
### command example
icinga2 containrer is made communicate with graphite container via docker network.
```
NAS> docker pull jordan/icinga2
NAS> docker pull graphiteapp/graphite-statsd
NAS> docker run -d --name graphite graphiteapp/graphite-statsd
NAS> docker run -d -p 8008:80 \
-h icinga2 -t \
--link graphite \
-e ICINGA2_FEATURE_GRAPHITE=true \
-e ICINGA2_FEATURE_GRAPHITE_HOST=graphite \
-e ICINGA2_FEATURE_GRAPHITE_PORT=2003 \
jordan/icinga2:latest
```
## Check VPN session on EdgeRouterX
Ideally, it would be possible to check the status of the VPN via SNMP, but I could not locate the OID of the VPN. You can check the VPN status of EdgeRouterX with the following command directly.
```
ERX> show vpn ipsec status
IPSec Process Running PID: XXXX
0 Active IPsec Tunnels
IPsec Interfaces :....
```
But, this command can not execute via ssh directy. So, you have to do it with the following codes.
```
ERX> vbash -ic 'show vpn ipsec status'
```
Finally, you can check how many VPN sessions are established [the following commands](./check_vpn_by_ssh.sh). This script got text from ERX and converts them into a SNMP format.
```
#!/bin/bash
result=$(ssh -q ubnt@192.168.10.1 'vbash -ic "show vpn ipsec status"')
count=$(echo "${result}" | awk '/([0-9]+) Active IPsec Tunnels/{print $1}')
echo "OK - ${count} users | users=${count}"
```
## How to register a public key to ERX
[Link](https://community.ui.com/questions/ssh-authorizedkeys/df244c69-9b9c-4662-93d6-820a5f07b53f)
You can not edit `~/.ssh/authorized_keys` directly on ERX. You have to use configure command to do it.
```
ERX> configure
load id_rsa.pub
save
exit
```
icinga2 accesses the server as `nagios`. So, you have to copy `id_rsa` into `/var/lib/nagios/.ssh`. And you can send/receive files to/from docker containers using the following command.
```
NAS> docker cp :
```
## Set up icinga2 for monitoring VPN sessions
I installed `router.conf` into `/etc/icinga2/conf.d/`, as following,
```
object Host "Router" {
import "generic-host"
address = ""
vars.category = "Router"
vars.snmp_community = "public"
vars.snmp_version = "2c"
}
object CheckCommand "VPNSession" {
command = ["/bin/bash", "/var/lib/icinga2/check_vpn_by_ssh.sh"]
}
apply Service "VPNSession" {
import "generic-service"
check_command = "VPNSession"
assign where host.vars.category == "Router"
}
```
And, you have to restart icinga2.
```
icinga2> service icinga2 restart
```
If you took some mistakes editing configure files, some error messages are displayed after this command.
## Monitor other status
You have to intall MIB files into the icinga2 container before setting up it. You can locate it on ERX at `/usr/share/snmp/mibs`, so copy them into icinga2's container.
After copying them, you have to add a search path to snmp.conf. I copied them into `/usr/share/snmp/private-mibs`. So I edited `/usr/share/snmp/snmp.conf` as follows,
```
# As the snmp packages come without MIB files due to license reasons, loading
# of MIBs is disabled by default. If you added the MIBs you can reenable
# loading them by commenting out the following line.
MIBDIRS /usr/share/snmp/mibs:/usr/share/snmp/private-mibs
MIBS all
```
I added to `router.conf` a following configuration in order to monitor bandwidth of each ethernet port.
```
apply Service "eth0_rx" {
import "generic-service"
check_command = "snmp"
vars.snmp_oid = "1.3.6.1.2.1.31.1.1.1.6.4"
vars.snmp_label = "eth0_rx"
vars.snmp_rate = true
name = "eth0_rx"
assign where host.vars.category == "Router"
}
apply Service "eth1_rx" {
import "generic-service"
check_command = "snmp"
vars.snmp_oid = "1.3.6.1.2.1.31.1.1.1.6.5"
vars.snmp_label = "eth0_rx"
vars.snmp_rate = true
name = "eth1_rx"
assign where host.vars.category == "Router"
}
apply Service "eth0_tx" {
import "generic-service"
check_command = "snmp"
vars.snmp_oid = "1.3.6.1.2.1.31.1.1.1.10.4"
vars.snmp_label = "eth0_tx"
vars.snmp_rate = true
name = "eth0_tx"
assign where host.vars.category == "Router"
}
apply Service "eth1_tx" {
import "generic-service"
check_command = "snmp"
vars.snmp_oid = "1.3.6.1.2.1.31.1.1.1.10.5"
vars.snmp_label = "eth1_tx"
vars.snmp_rate = true
name = "eth1_tx"
assign where host.vars.category == "Router"
}
```
I search OID using [this script](https://gist.github.com/nbrownus/dfd8ab05728bbf8ff5993ac0d34eaeb6).
## Customize graphs by graphite
You can customize graphs in graphite. Like as the following picture,
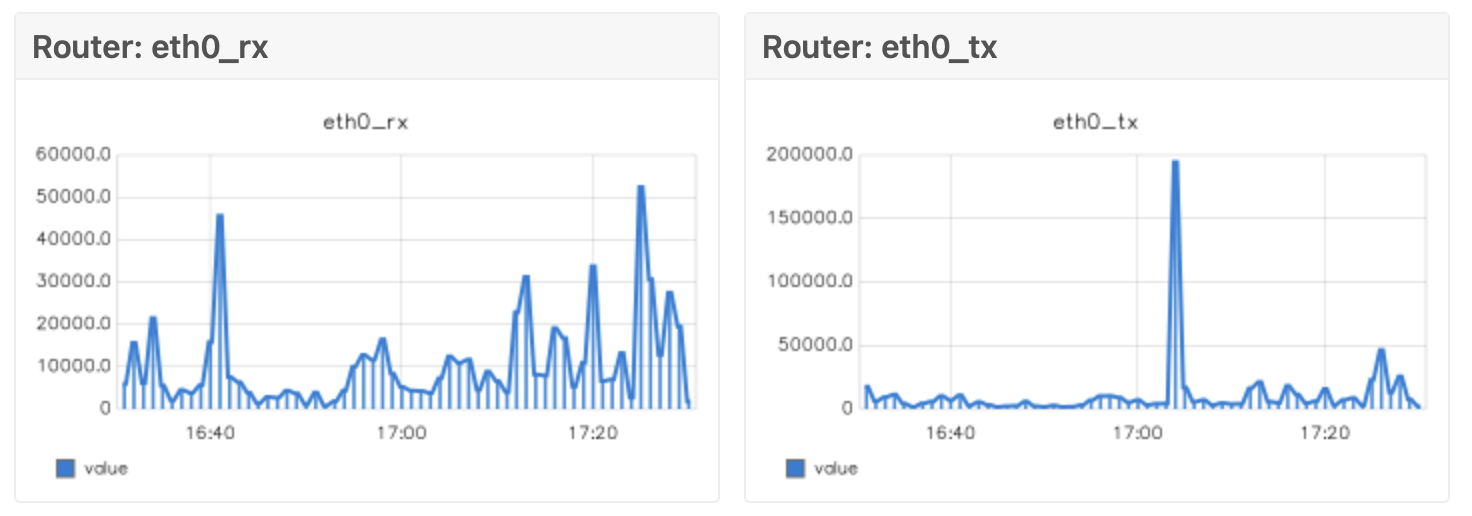
You can edit properties of a graph by editing `/etc/icingaweb2/modules/graphite/templates/default.ini`. And, editing configure files, `/usr/local/share/icingaweb2/modules/graphite/templates`, you change appearance of graphs.
## References
1. https://community.ui.com/questions/ssh-authorizedkeys/df244c69-9b9c-4662-93d6-820a5f07b53f
2. https://community.ui.com/questions/Deleting-a-previously-loaded-SSH-auth-key-from-the-config/13fa1c42-a84f-4c9a-b602-d46a294c7c1f
3. https://community.ui.com/questions/Problem-running-SSH-Putty-script-towards-EdgeRouter/730d2baa-41f1-4a49-89df-b10fa70856d5
4. https://community.icinga.com/t/how-to-adjust-the-graphite-background-color/3172/4
5. https://github.com/mlutfy/nagios-plugins/blob/master/check_max_open_files.sh
6. https://qiita.com/papillon/items/abbb210fa927911f7e33
7. https://qiita.com/papillon/items/5bb8c4b19382cd8838de
8. https://techexpert.tips/ja/アイシングア2/icinga2-icmp-モニタリング/
9. https://techexpert.tips/ja/アイシングア2/icinga2-ウェブサイトのモニタリング/
10.