https://github.com/splware/esproc_analytics
The most Excel-user-friendly and the most interactive programming language for data analytics.
https://github.com/splware/esproc_analytics
Last synced: 5 months ago
JSON representation
The most Excel-user-friendly and the most interactive programming language for data analytics.
- Host: GitHub
- URL: https://github.com/splware/esproc_analytics
- Owner: SPLWare
- Created: 2024-12-23T10:01:07.000Z (over 1 year ago)
- Default Branch: master
- Last Pushed: 2025-02-18T09:10:14.000Z (over 1 year ago)
- Last Synced: 2025-02-18T10:24:53.695Z (over 1 year ago)
- Homepage: https://www.esproc.com/langding-page-spl-data-analysis/
- Size: 10.7 KB
- Stars: 3
- Watchers: 1
- Forks: 1
- Open Issues: 0
-
Metadata Files:
- Readme: README.md
Awesome Lists containing this project
README


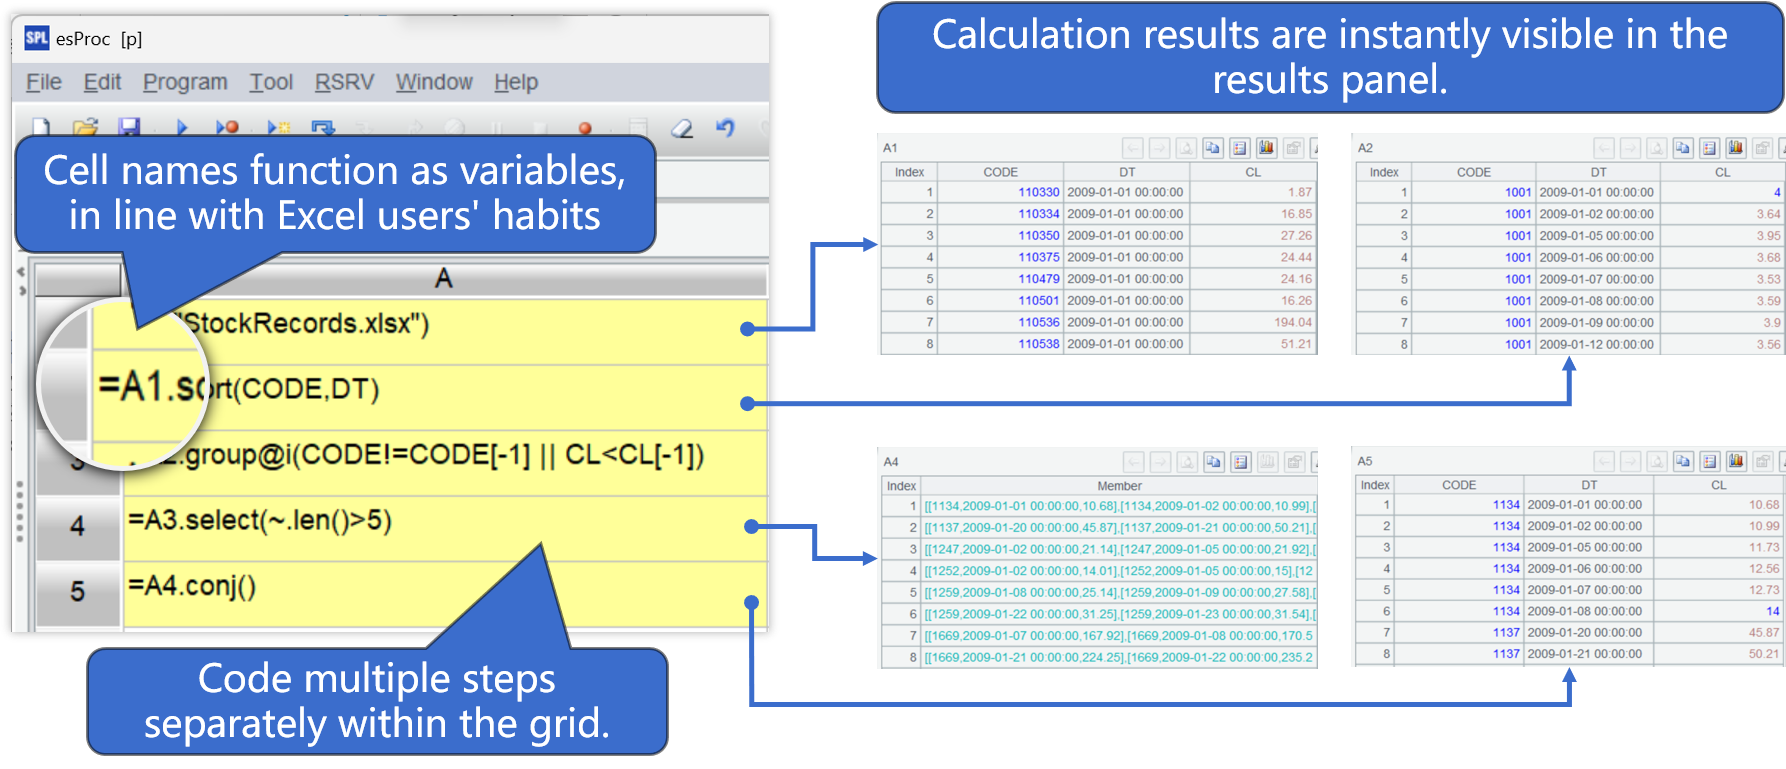
Novel grid-style programming
Excel-like Grid-style programming
---

---
High Interactivity for Exploratory Analysis

---
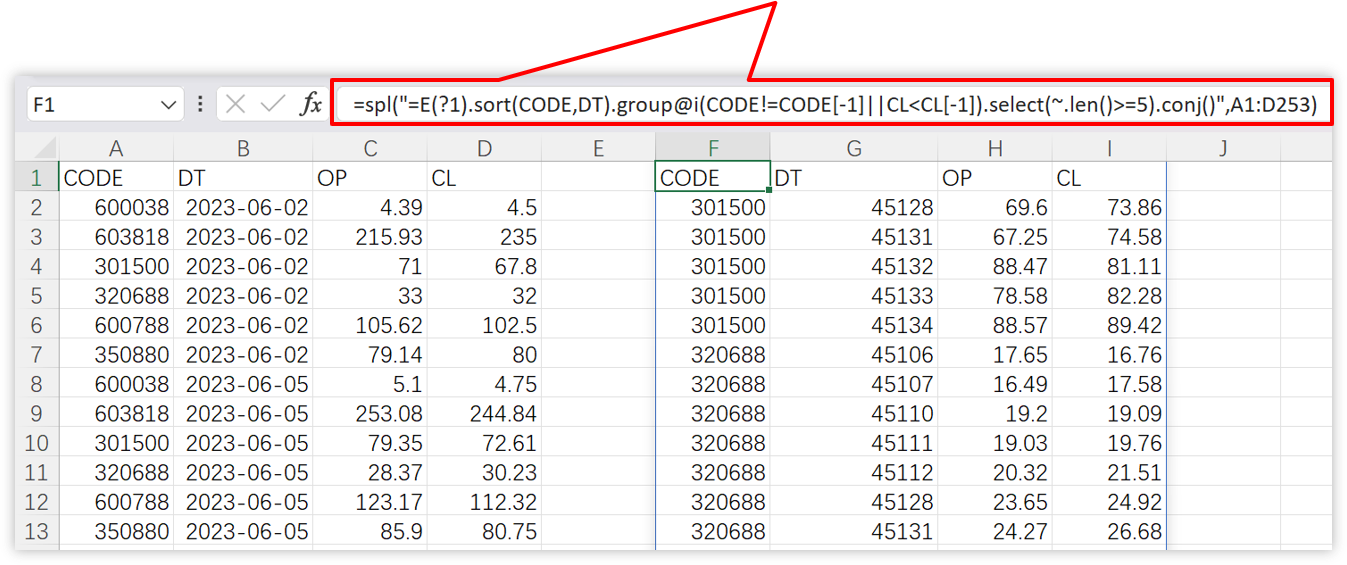
XLL Plugin Helps Excel
Write SPL code in Excel directly
> **Finding periods during which stocks have risen consecutively for more than 5 days**
```
=spl("=E(?1).sort(CODE,DT).group@i(CODE!=CODE[-1]||CL=5).conj()",A1:D253)
```
---
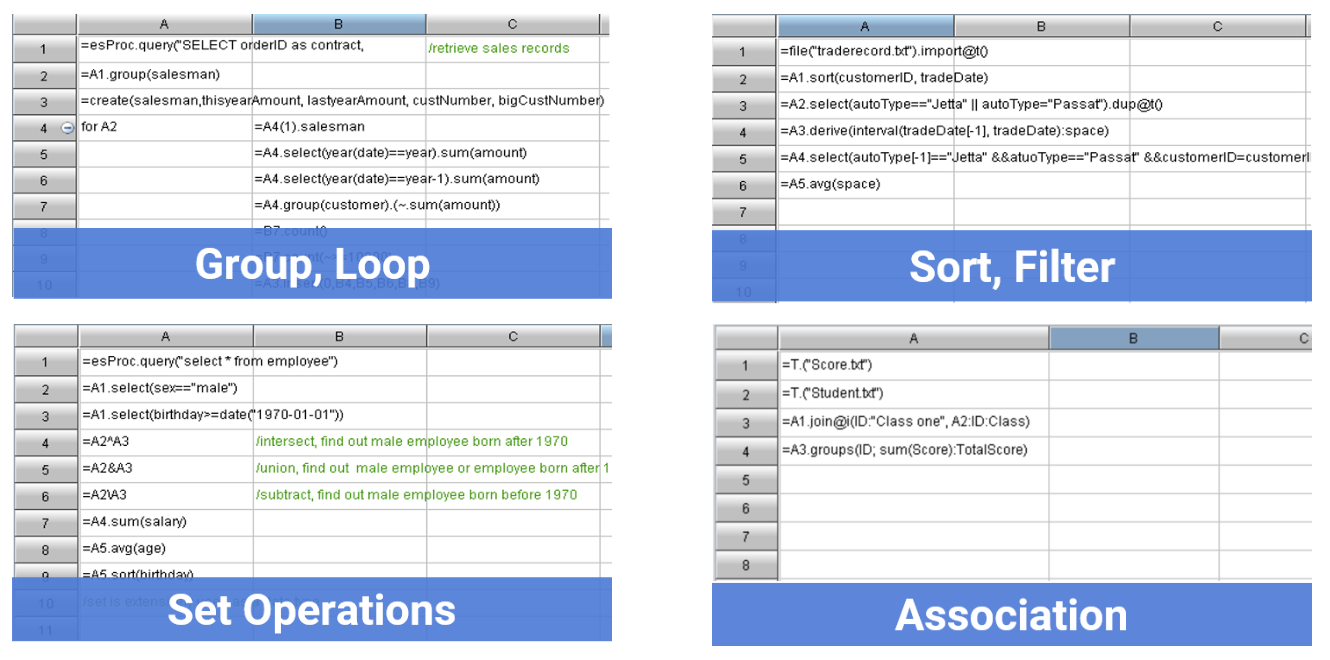
Concise and Powerful Code
Comprehensive and Simple Operations
---
Unique Set and Ordered Operations
> **calculate the longest consecutive rising days for each stock**
#### SQL
```sql
SELECT CODE, MAX(con_rise) AS longest_up_days
FROM (
SELECT CODE, COUNT(*) AS con_rise
FROM (
SELECT CODE, DT, SUM(updown_flag) OVER (PARTITION BY CODE ORDER BY CODE, DT) AS no_up_days
FROM (
SELECT CODE, DT,
CASE WHEN CL > LAG(CL) OVER (PARTITION BY CODE ORDER BY CODE, DT) THEN 0
ELSE 1 END AS updown_flag
FROM stock
)
)
GROUP BY CODE, no_up_days
)
GROUP BY CODE
```
#### Python
```Python
import pandas as pd
stock_file = "StockRecords.txt"
stock_info = pd.read_csv(stock_file,sep="\t")
stock_info.sort_values(by=['CODE','DT'],inplace=True)
stock_group = stock_info.groupby(by='CODE')
stock_info['label'] = stock_info.groupby('CODE')['CL'].diff().fillna(0).le(0).astype(int).cumsum()
max_increase_days = {}
for code, group in stock_info.groupby('CODE'):
max_increase_days[code] = group.groupby('label').size().max() – 1
max_rise_df = pd.DataFrame(list(max_increase_days.items()), columns=['CODE', 'max_increase_days'])
```
#### SPL
| | A |
| --- | --- |
| 1 | StockRecords.xlsx |
| 2 | =T(A1).sort(DT) |
| 3 | =A2.group(CODE;\~.group@i(CL< CL[-1]).max(~.len()):max_increase_days) |
**Especially skilled at complex scenarios such as order-related operations, sliding windows, and cross-row computations, much simpler than SQL or Python**
[What to use for data analysis programming: SPL,Python or SPL?](https://www.esproc.com/langding-page-scientist/)
---
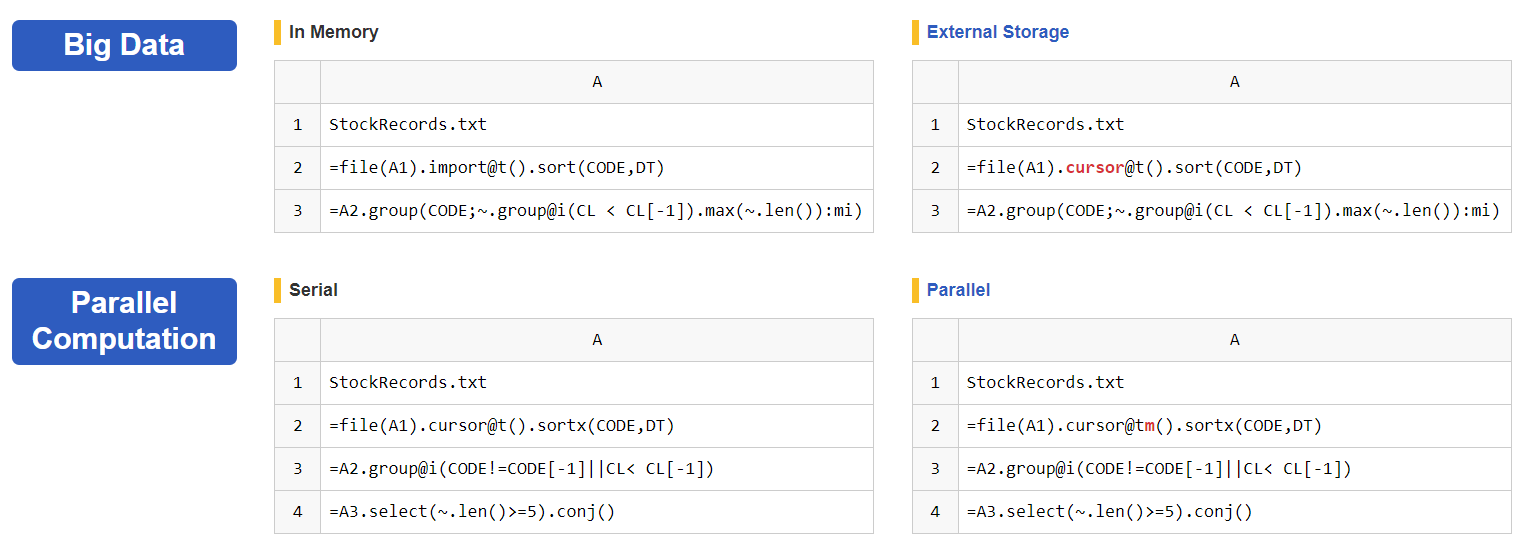
Easy Big Data and Parallel Support
---
Lightweight and Portable

---
# Resource
- [Read the e-book "SPL Programming"](https://www.esproc.com/html/SPL-programming-book.html)
- [Watch the video "SPL video course"](https://www.esproc.com/html/SPL-programming-course.html)
- [Download esProc Desktop](https://www.esproc.com/download-desktop/)
- [Community - c.esproc.com](https://c.esproc.com/)