https://github.com/stefanprodan/istio-hpa
Configure horizontal pod autoscaling with Istio metrics and Prometheus
https://github.com/stefanprodan/istio-hpa
autoscaling hpa istio kubernetes prometheus
Last synced: 6 days ago
JSON representation
Configure horizontal pod autoscaling with Istio metrics and Prometheus
- Host: GitHub
- URL: https://github.com/stefanprodan/istio-hpa
- Owner: stefanprodan
- License: mit
- Created: 2019-02-26T10:07:33.000Z (over 6 years ago)
- Default Branch: master
- Last Pushed: 2021-04-06T15:31:23.000Z (over 4 years ago)
- Last Synced: 2025-04-15T16:26:04.122Z (6 months ago)
- Topics: autoscaling, hpa, istio, kubernetes, prometheus
- Language: Dockerfile
- Homepage:
- Size: 290 KB
- Stars: 113
- Watchers: 3
- Forks: 44
- Open Issues: 8
-
Metadata Files:
- Readme: README.md
- License: LICENSE
Awesome Lists containing this project
README
# istio-hpa
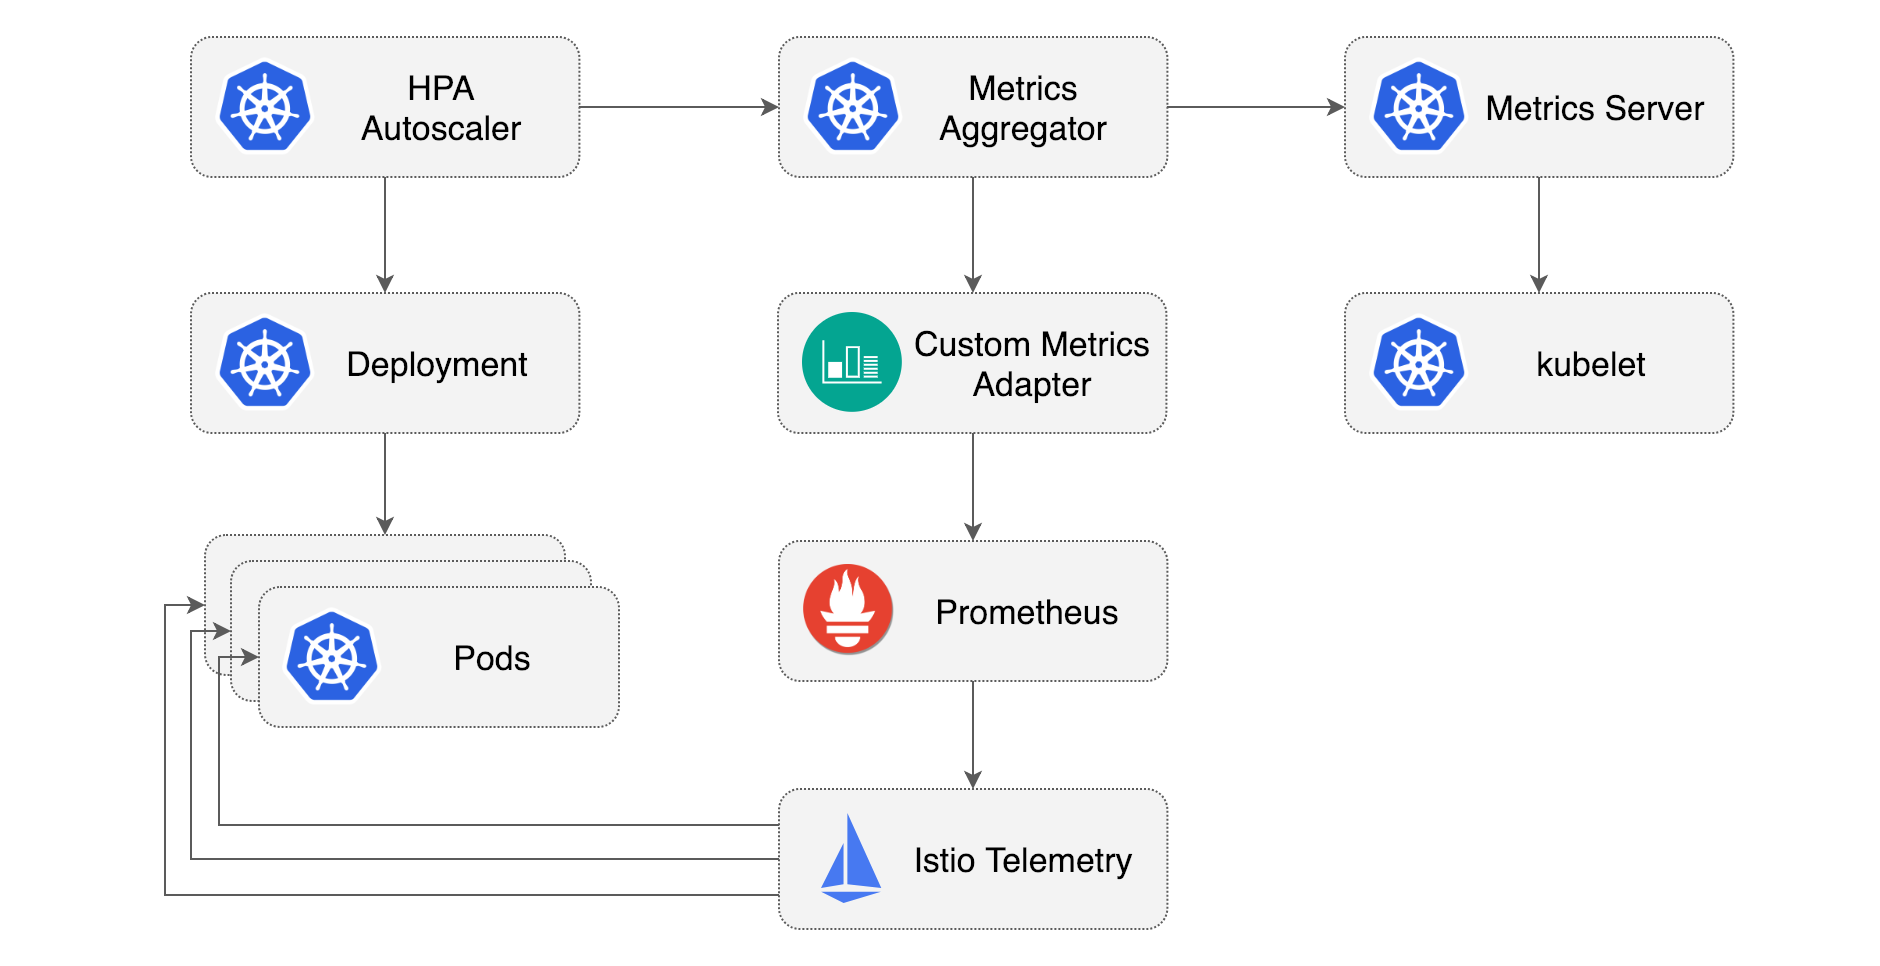
One of the advantages of using a service mesh like Istio is the builtin monitoring capability. You don't have
to instrument your web apps in order to monitor the L7 traffic. The Istio telemetry service collects
stats like HTTP request rate, response status codes and duration form the Envoy sidecars
that are running alongside your apps.
Besides monitoring these metrics can be used to drive autoscaling and
[canary deployments](https://github.com/stefanprodan/flagger).
What follows is a step-by-step guide on configuring HPA v2 with metrics provided by Istio Mixer.
When installing Istio make sure that the telemetry service and Prometheus are enabled.
If you're using the GKE Istio add-on, you'll have to deploy Prometheus as described
[here](https://docs.flagger.app/install/flagger-install-on-google-cloud#install-prometheus).
In order to use the Istio metrics together with the Horizontal Pod Autoscaler you'll need an adapter that
can run Prometheus queries. Zalando made a general purpose metrics adapter for Kubernetes called
[kube-metrics-adapter](https://github.com/zalando-incubator/kube-metrics-adapter).
The Zalando adapter scans the HPA objects, executes promql queries (specified with annotations) and
stores the metrics in memory.
### Installing the custom metrics adapter
Clone the [istio-hpa](https://github.com/stefanprodan/istio-hpa) repository:
```bash
git clone https://github.com/stefanprodan/istio-hpa
cd istio-hpa
```
Deploy the metrics adapter in the `kube-system` namespace:
```bash
kubectl apply -f ./kube-metrics-adapter/
```
When the adapter starts, it will generate a self-signed cert and will register itself
under the `custom.metrics.k8s.io` group.
The adapter is configured to query the Prometheus instance that's running in the `istio-system` namespace.
Verify the install by checking the adapter logs:
```bash
kubectl -n kube-system logs deployment/kube-metrics-adapter
```
### Installing the demo app
You will use [podinfo](https://github.com/stefanprodan/k8s-podinfo),
a small Golang-based web app to test the Horizontal Pod Autoscaler.
First create a `test` namespace with Istio sidecar injection enabled:
```bash
kubectl apply -f ./namespaces/
```
Create the podinfo deployment and ClusterIP service in the `test` namespace:
```bash
kubectl apply -f ./podinfo/deployment.yaml,./podinfo/service.yaml
```
In order to trigger the auto scaling, you'll need a tool to generate traffic.
Deploy the load test service in the `test` namespace:
```bash
kubectl apply -f ./loadtester/
```
Verify the install by calling the podinfo API.
Exec into the load tester pod and use `hey` to generate load for a couple of seconds:
```bash
export loadtester=$(kubectl -n test get pod -l "app=loadtester" -o jsonpath='{.items[0].metadata.name}')
kubectl -n test exec -it ${loadtester} -- sh
~ $ hey -z 5s -c 10 -q 2 http://podinfo.test:9898
Summary:
Total: 5.0138 secs
Requests/sec: 19.9451
Status code distribution:
[200] 100 responses
$ exit
```
The podinfo [ClusterIP service](https://github.com/stefanprodan/istio-hpa/blob/master/podinfo/service.yaml)
exposes port 9898 under the `http` name. When using the http prefix, the Envoy sidecar will
switch to L7 routing and the telemetry service will collect HTTP metrics.
### Querying the Istio metrics
The Istio telemetry service collects metrics from the mesh and stores them in Prometheus. One such metric is
`istio_requests_total`, with it you can determine the rate of requests per second a workload receives.
This is how you can query Prometheus for the req/sec rate received by podinfo in the last minute, excluding 404s:
```sql
sum(
rate(
istio_requests_total{
destination_workload="podinfo",
destination_workload_namespace="test",
reporter="destination",
response_code!="404"
}[1m]
)
)
```
The HPA needs to know the req/sec that each pod receives. You can use the container memory usage metric
from kubelet to count the number of pods and calculate the Istio request rate per pod:
```sql
sum(
rate(
istio_requests_total{
destination_workload="podinfo",
destination_workload_namespace="test"
}[1m]
)
) /
count(
count(
container_memory_usage_bytes{
namespace="test",
pod=~"podinfo.*"
}
) by (pod)
)
```
### Configuring the HPA with Istio metrics
Using the req/sec query you can define a HPA that will scale the podinfo workload based on the number of requests
per second that each instance receives:
```yaml
apiVersion: autoscaling/v2beta1
kind: HorizontalPodAutoscaler
metadata:
name: podinfo
namespace: test
annotations:
metric-config.object.istio-requests-total.prometheus/per-replica: "true"
metric-config.object.istio-requests-total.prometheus/query: |
sum(
rate(
istio_requests_total{
destination_workload="podinfo",
destination_workload_namespace="test"
}[1m]
)
) /
count(
count(
container_memory_usage_bytes{
namespace="test",
pod=~"podinfo.*"
}
) by (pod)
)
spec:
maxReplicas: 10
minReplicas: 1
scaleTargetRef:
apiVersion: apps/v1
kind: Deployment
name: podinfo
metrics:
- type: Object
object:
metricName: istio-requests-total
target:
apiVersion: v1
kind: Pod
name: podinfo
targetValue: 10
```
The above configuration will instruct the Horizontal Pod Autoscaler to scale up the deployment when the average traffic
load goes over 10 req/sec per replica.
Create the HPA with:
```bash
kubectl apply -f ./podinfo/hpa.yaml
```
Start a load test and verify that the adapter computes the metric:
```
kubectl -n kube-system logs deployment/kube-metrics-adapter -f
Collected 1 new metric(s)
Collected new custom metric 'istio-requests-total' (44m) for Pod test/podinfo
```
List the custom metrics resources:
```bash
kubectl get --raw "/apis/custom.metrics.k8s.io/v1beta1" | jq .
```
The Kubernetes API should return a resource list containing the Istio metric:
```json
{
"kind": "APIResourceList",
"apiVersion": "v1",
"groupVersion": "custom.metrics.k8s.io/v1beta1",
"resources": [
{
"name": "pods/istio-requests-total",
"singularName": "",
"namespaced": true,
"kind": "MetricValueList",
"verbs": [
"get"
]
}
]
}
```
After a couple of seconds the HPA will fetch the metric from the adapter:
```bash
kubectl -n test get hpa/podinfo
NAME REFERENCE TARGETS MINPODS MAXPODS REPLICAS
podinfo Deployment/podinfo 44m/10 1 10 1
```
### Autoscaling based on HTTP traffic
To test the HPA you can use the load tester to trigger a scale up event.
Exec into the tester pod and use `hey` to generate load for a 5 minutes:
```bash
kubectl -n test exec -it ${loadtester} -- sh
~ $ hey -z 5m -c 10 -q 2 http://podinfo.test:9898
```
Press ctrl+c then exit to get out of load test terminal if you wanna stop prematurely.
After a minute the HPA will start to scale up the workload until the req/sec per pod drops under the target value:
```bash
watch kubectl -n test get hpa/podinfo
NAME REFERENCE TARGETS MINPODS MAXPODS REPLICAS
podinfo Deployment/podinfo 25272m/10 1 10 3
```
When the load test finishes, the number of requests per second will drop to zero and the HPA will
start to scale down the workload.
Note that the HPA has a back off mechanism that prevents rapid scale up/down events,
the number of replicas will go back to one after a couple of minutes.
By default the metrics sync happens once every 30 seconds and scaling up/down can only happen if there was
no rescaling within the last 3-5 minutes. In this way, the HPA prevents rapid execution of conflicting decisions
and gives time for the Cluster Autoscaler to kick in.
### Wrapping up
Scaling based on traffic is not something new to Kubernetes, an ingress controllers such as
NGINX can expose Prometheus metrics for HPA. The difference in using Istio is that you can autoscale
backend services as well, apps that are accessible only from inside the mesh.
I'm not a big fan of embedding code in Kubernetes yaml but the Zalando metrics adapter is flexible enough
to allow this kind of custom autoscaling.
If you have any suggestion on improving this guide please submit an issue or PR on GitHub at
[stefanprodan/istio-hpa](https://github.com/stefanprodan/istio-hpa). Contributions are more than welcome!