Ecosyste.ms: Awesome
An open API service indexing awesome lists of open source software.
https://github.com/stevecondylios/r-shiny-on-heroku
Tutorial: How to deploy an R Shiny App on Heroku
https://github.com/stevecondylios/r-shiny-on-heroku
heroku heroku-app r-shiny tutorial
Last synced: 3 months ago
JSON representation
Tutorial: How to deploy an R Shiny App on Heroku
- Host: GitHub
- URL: https://github.com/stevecondylios/r-shiny-on-heroku
- Owner: stevecondylios
- Created: 2020-06-05T20:44:51.000Z (over 4 years ago)
- Default Branch: master
- Last Pushed: 2020-06-05T21:29:25.000Z (over 4 years ago)
- Last Synced: 2024-08-06T03:04:02.654Z (6 months ago)
- Topics: heroku, heroku-app, r-shiny, tutorial
- Language: R
- Homepage: https://calm-depths-94227.herokuapp.com/
- Size: 6.84 KB
- Stars: 13
- Watchers: 3
- Forks: 8
- Open Issues: 0
-
Metadata Files:
- Readme: README.md
Awesome Lists containing this project
README
# Tutorial: Deploy your R Shiny App on the Web using Heroku
There are numerous ways of getting your R Shiny app on to the web. Some are expensive, others are tedious, and most are finicky. Heroku is neither. Here's a guide as to how to deploy your app to the web using Heroku.
## Heroku - what is it?
Heroku allows you to think far less about dev-ops, letting you focus on building awesome apps.
With Heroku, you don't have to manually provision infrastructure (reliving you of things like: starting EC2s from images, configuring security groups, setting port ranges, shelling in, installing dependencies, configuring a database, load balancing, scheduling, and any other configurations required to run your app 😅).
Heroku is mostly declarative meaning we tell it what we're after, rather than having to think carefully about how achieve each deployment step - Heroku takes care of this for us.
## A simple example
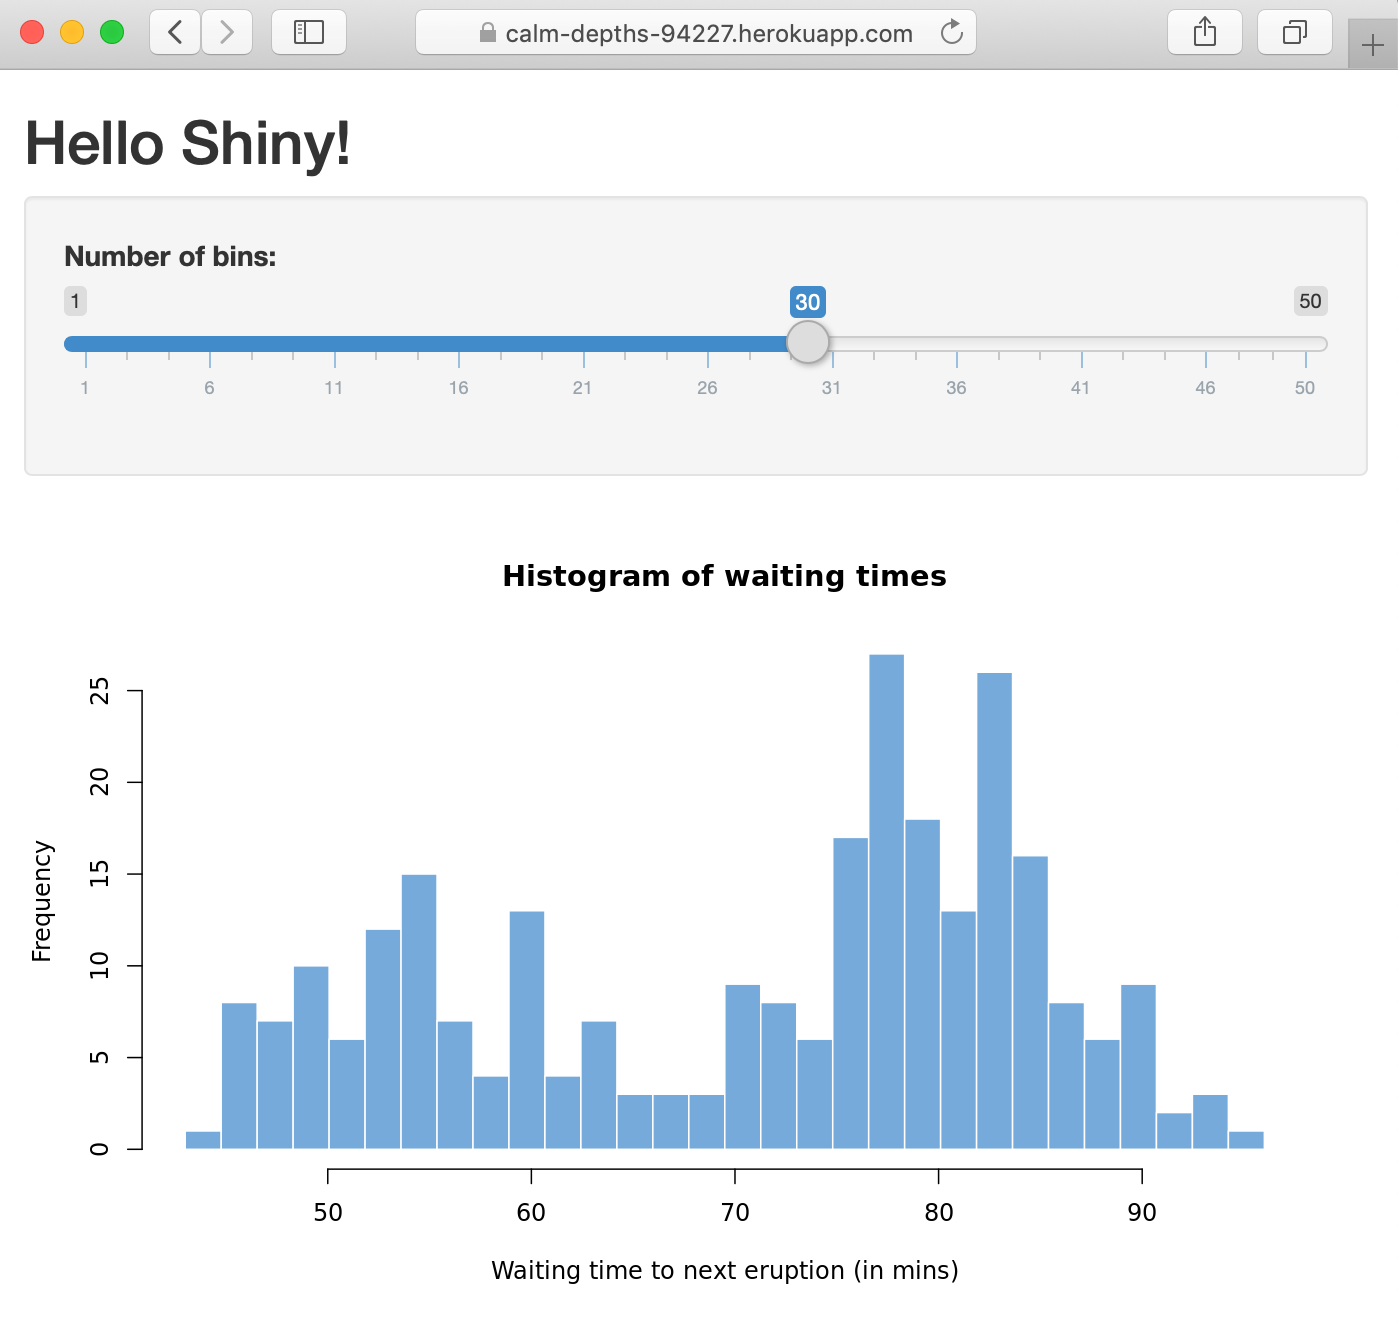
Here is a very simple R Shiny app - let's take a quick look:
Here's `server.R`
```R
# Define server logic required to draw a histogram ----
server <- function(input, output) {
# Histogram of the Old Faithful Geyser Data ----
# with requested number of bins
# This expression that generates a histogram is wrapped in a call
# to renderPlot to indicate that:
#
# 1. It is "reactive" and therefore should be automatically
# re-executed when inputs (input$bins) change
# 2. Its output type is a plot
output$distPlot <- renderPlot({
x <- faithful$waiting
bins <- seq(min(x), max(x), length.out = input$bins + 1)
hist(x, breaks = bins, col = "#75AADB", border = "white",
xlab = "Waiting time to next eruption (in mins)",
main = "Histogram of waiting times")
})
}
```
And here's `ui.R`
```R
library(shiny)
# Define UI for app that draws a histogram ----
ui <- fluidPage(
# App title ----
titlePanel("Hello Shiny!"),
# Sidebar layout with input and output definitions ----
sidebarLayout(
# Sidebar panel for inputs ----
sidebarPanel(
# Input: Slider for the number of bins ----
sliderInput(inputId = "bins",
label = "Number of bins:",
min = 1,
max = 50,
value = 30)
),
# Main panel for displaying outputs ----
mainPanel(
# Output: Histogram ----
plotOutput(outputId = "distPlot")
)
)
)
```
Let's make sure it runs locally with `runApp()`. Once we see that it works, it's time to move it on to the web.
## Deployment
For simple apps without a database, there are just three easy steps.
1. Create run.R
In addition to your app's server.R and ui.R files, we'll need one more file. This one will be executed when the app is deployed and it will start your app. Create a file called run.R and add the following content:
```R
library(shiny)
port <- Sys.getenv('PORT')
shiny::runApp(
appDir = getwd(),
host = '0.0.0.0',
port = as.numeric(port)
)
```
Your app should now have three files, like so:

2. Initialize a git repository
Initialize a git repository with `git init`, then commit your code with
```
git add . && git commit -m "First"
```
3. Create app and deploy app
```
heroku create --buildpack https://github.com/virtualstaticvoid/heroku-buildpack-r.git
git push heroku master
```
About 30 seconds later, your app will be live on the web. The terminal output should resemble this (note the url for your app toward the bottom):

## You're done!
Navigate to the url and see your app in all it's glory!