https://github.com/steviecurran/ab-testing-toolkit
A/B testing toolkit
https://github.com/steviecurran/ab-testing-toolkit
ab-testing confidence-intervals decision-making hypothesis-testing normal-distribution sample-tests statistics students-t t-score z-score
Last synced: 25 days ago
JSON representation
A/B testing toolkit
- Host: GitHub
- URL: https://github.com/steviecurran/ab-testing-toolkit
- Owner: steviecurran
- Created: 2024-06-16T22:36:58.000Z (about 2 years ago)
- Default Branch: main
- Last Pushed: 2026-04-18T07:38:34.000Z (2 months ago)
- Last Synced: 2026-04-18T09:31:14.800Z (2 months ago)
- Topics: ab-testing, confidence-intervals, decision-making, hypothesis-testing, normal-distribution, sample-tests, statistics, students-t, t-score, z-score
- Language: Jupyter Notebook
- Homepage:
- Size: 2.96 MB
- Stars: 0
- Watchers: 1
- Forks: 0
- Open Issues: 0
-
Metadata Files:
- Readme: README.md
Awesome Lists containing this project
README
### A/B Testing Toolkit: Comparing Two Means
In A/B testing, the goal is to determine whether an observed difference between groups is statistically significant and practically meaningful, as commonly required in product experiments and business decision-making.
In many real-world scenarios, small differences between groups can be statistically significant, particularly with large datasets. This tool helps distinguish meaningful effects from random variation.
The notebook (*CI-2_means.ipynb*) compares two groups using confidence intervals and hypothesis testing, avoiding manual calculations and statistical tables that are prone to error.
The notebook is interactive and includes options to:
- Load a dataset from .csv or .dat files or input the means and standard deviations directly
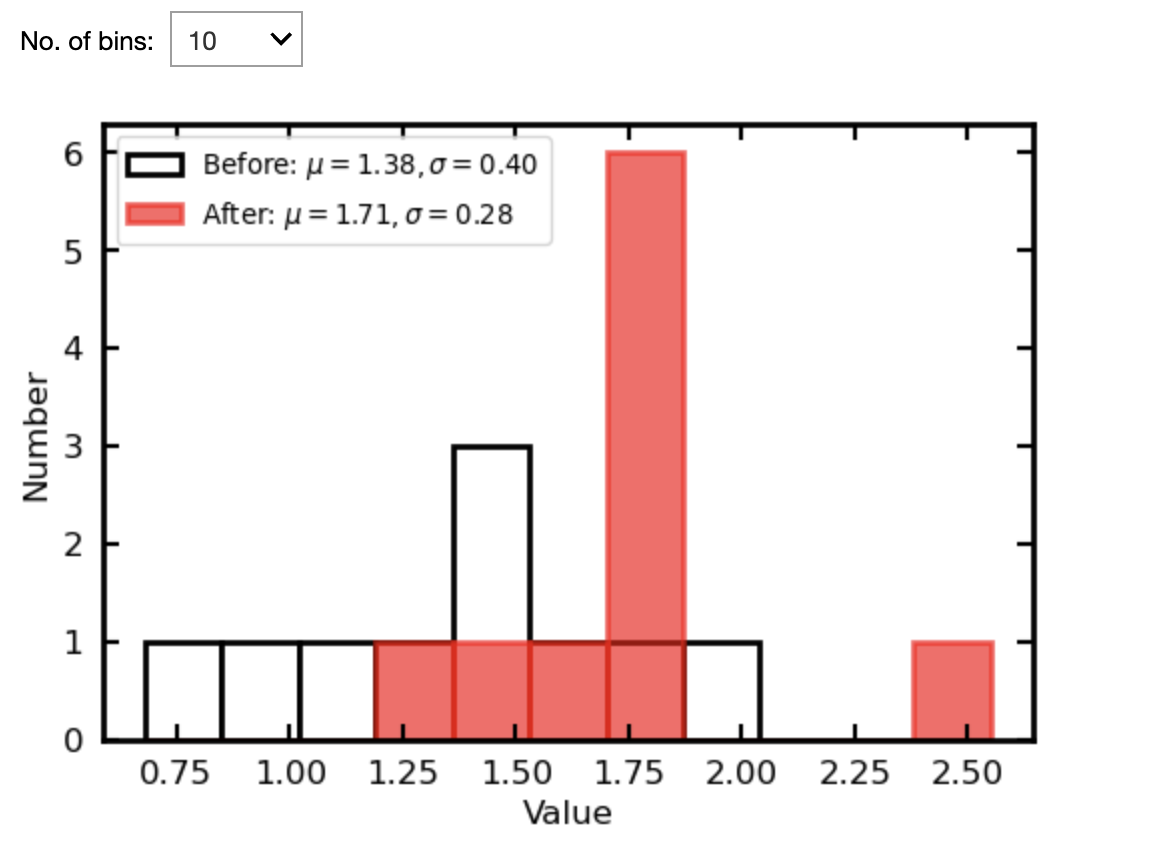
- For the full data option, plot a histogram showing the distributions of the two classes
- Adjust the confidence levels from the default 95%, offering more stringent testing
- Run a one or two tailed test
- Change the t- to z-statistic threshold from the default n = 30
- Switch between equal (pooled) and inequal (Welch’s method) variances
**Interpretation**
This toolkit enables rapid comparison of group means and supports statistical decision-making by quantifying uncertainty and significance.
**Quick Start**
Run the notebook using a simulated dataset, or to see a full workflow without interaction, change
USE_DEFAULTS = False
to
USE_DEFAULTS = True
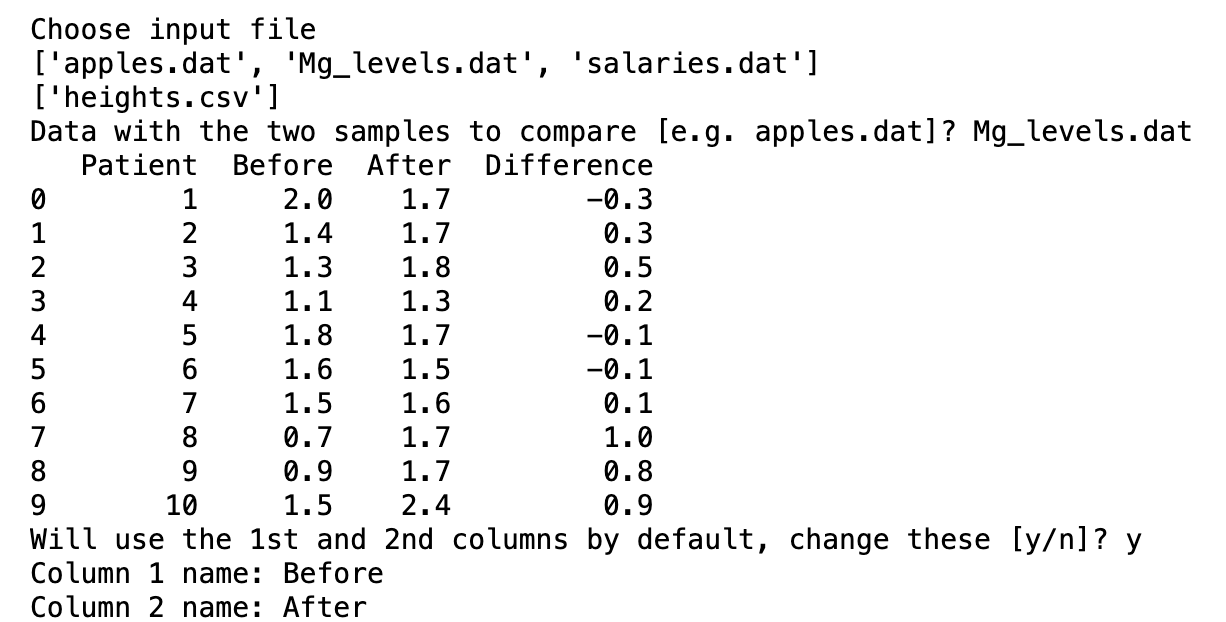
**Example 1: Raw data of a small sample**
The file *Mg_levels.dat* contains the levels of magnesium in a sample of people before and after taking a supplement. We wish to test the null hypothesis that the supplement does not increase the magnesium levels of the patients
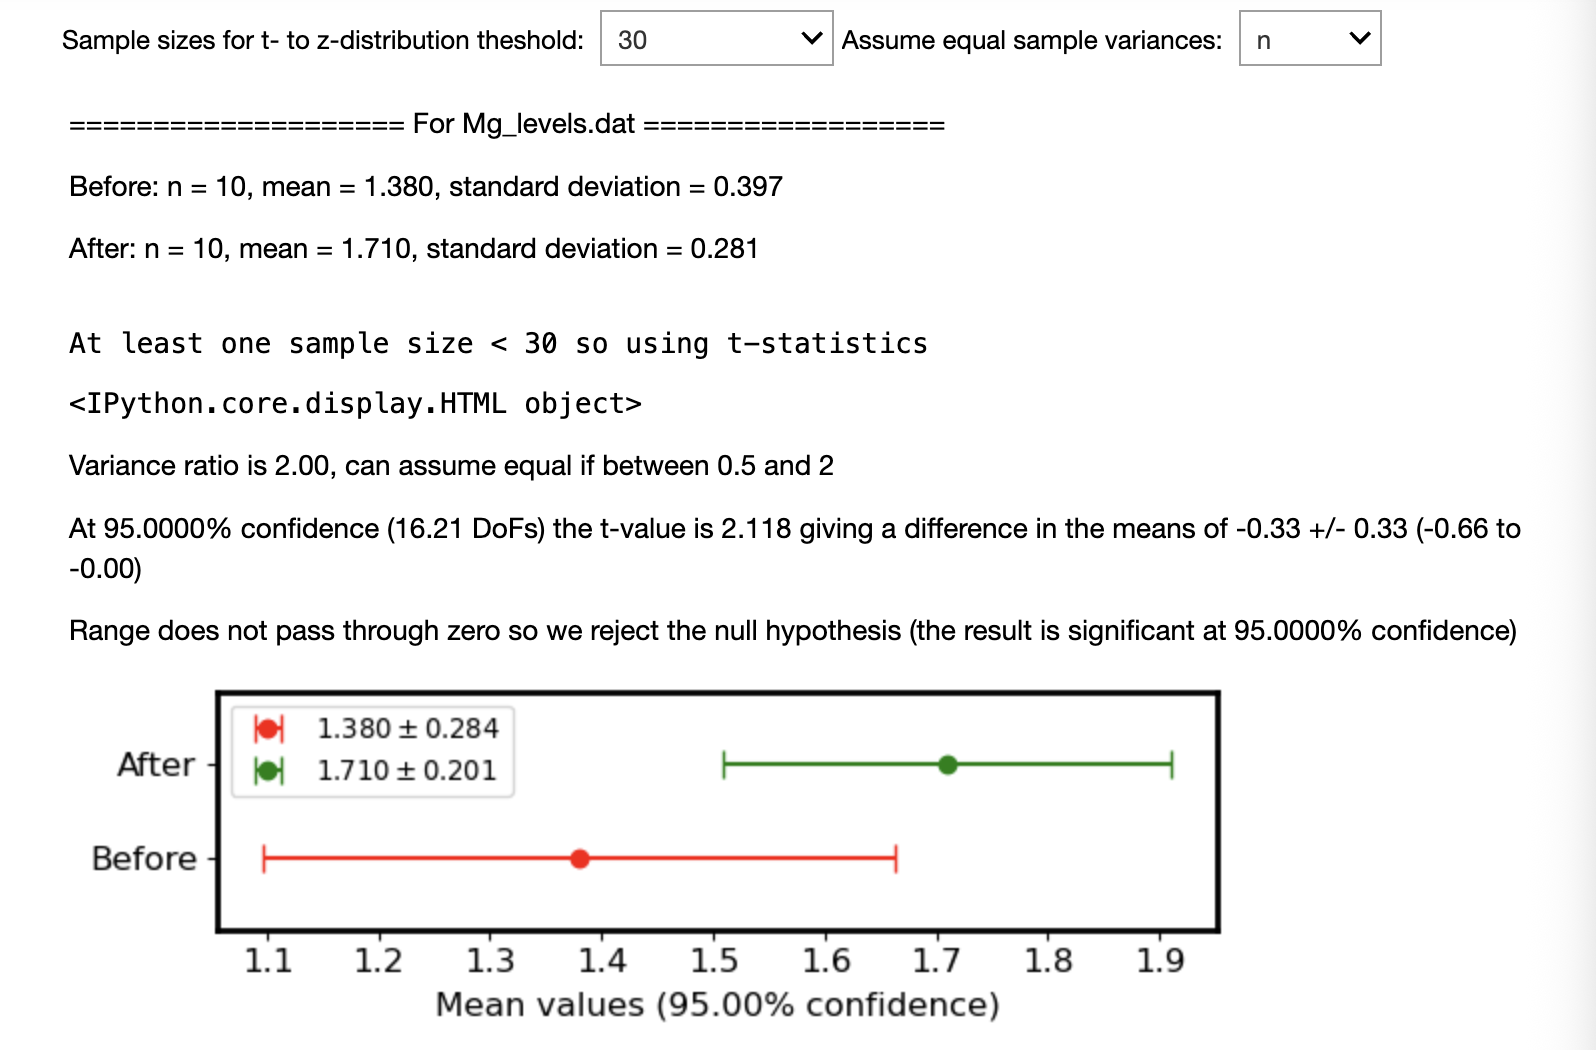
At the 95% confidence level, we reject the null hypothesis and conclude that the supplement increases magnesium levels.
Using the condifence level dropdown it is straightforward to show that the null hypothesis cannot be rejected with 99% confidence.
*Note: This example is treated as a two-sample test. In practice, a paired test may be more appropriate for before/after measurements.*
**Example 2: Large sample test**
We can use the medical data below to demonstrate the toolkit on a large sample where we input the summary data only.
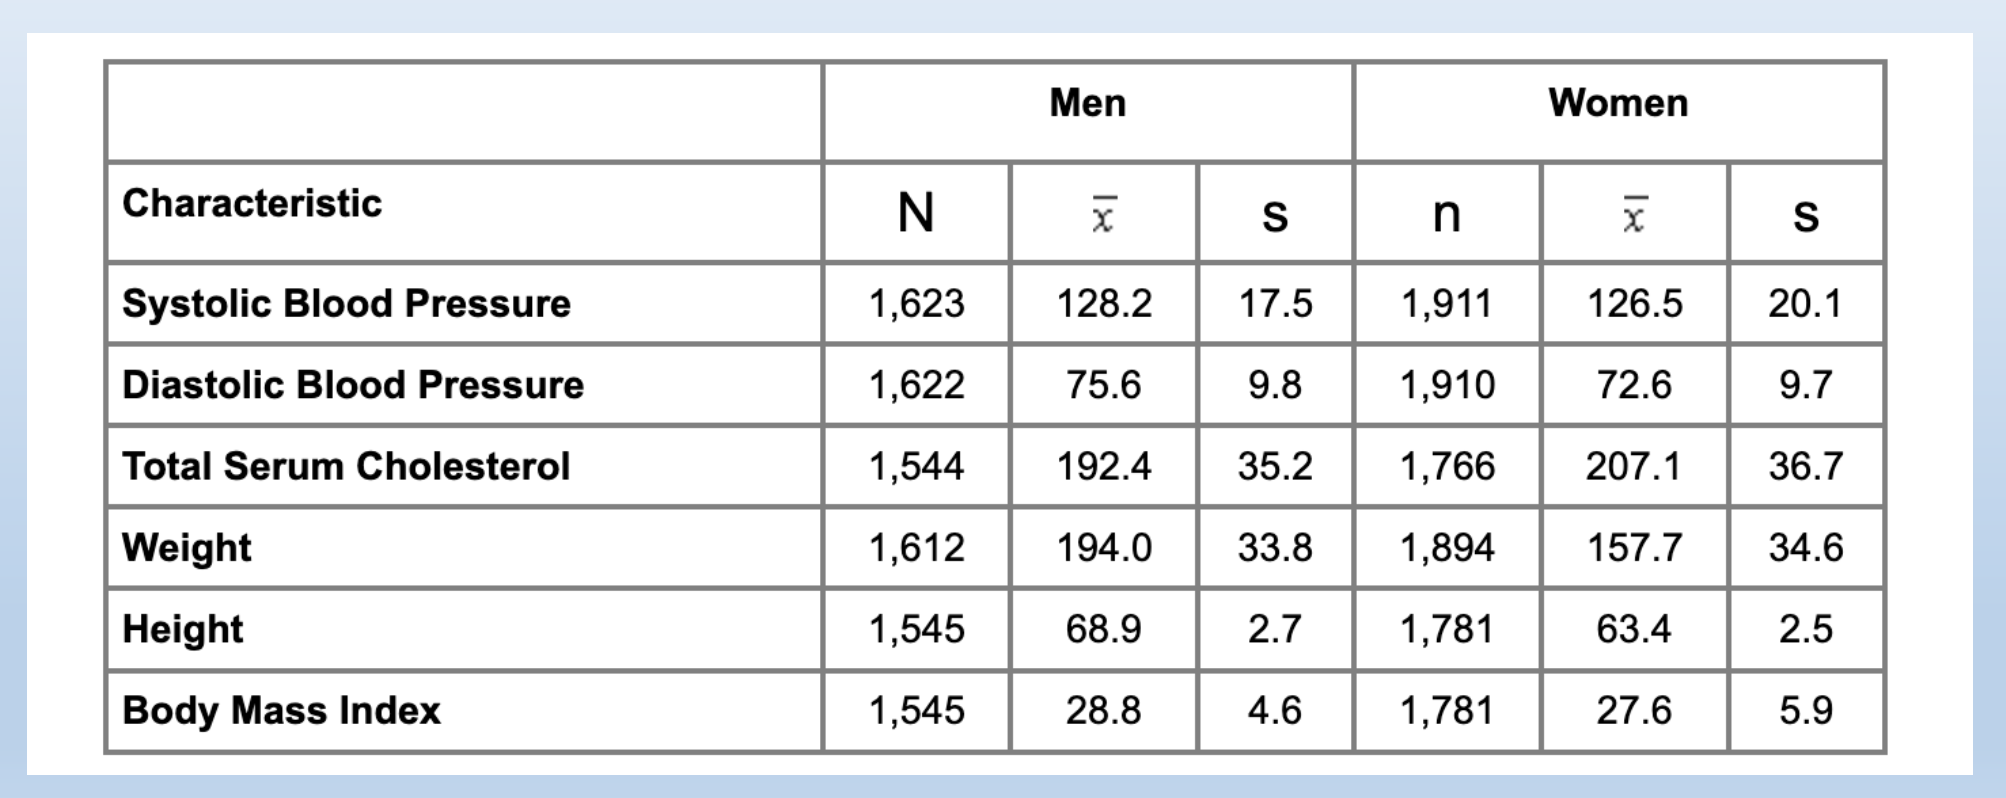
For example, for the *systolic blood pressure*
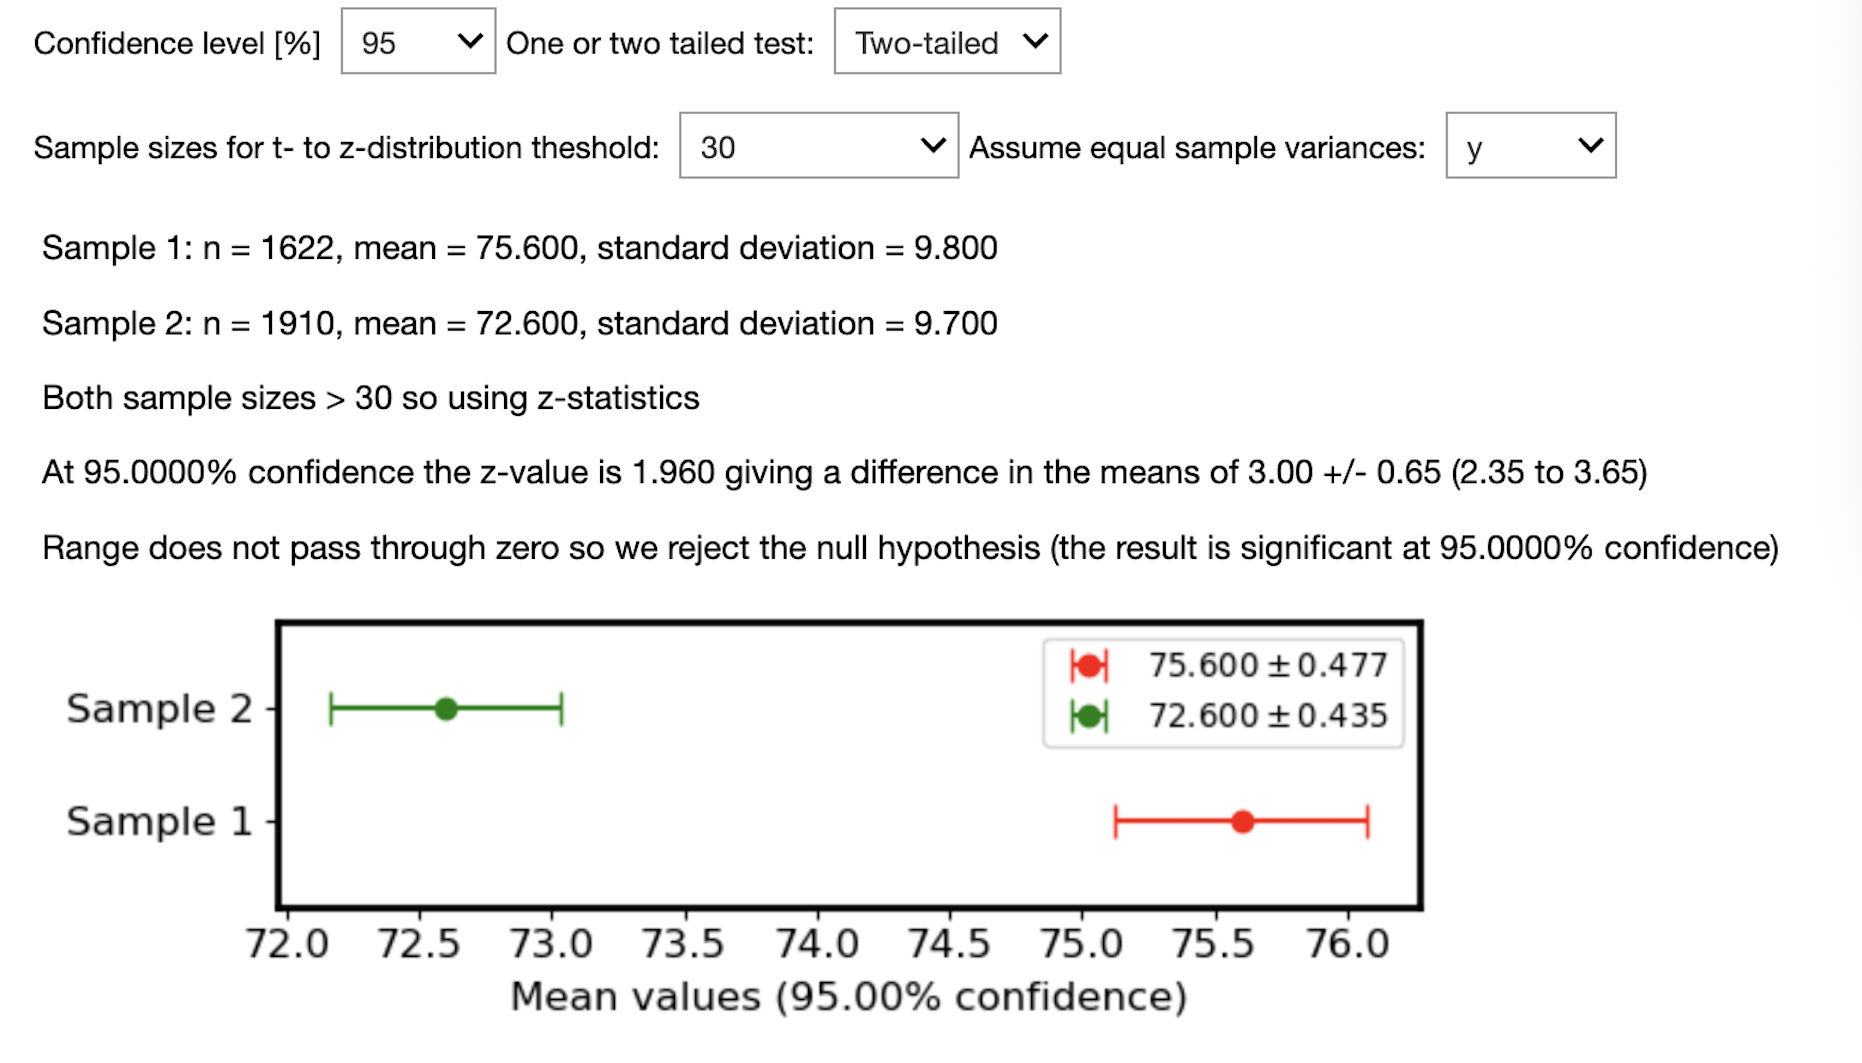
Here *Men* have been entered as Sample 1 and *Women* as Sample 2.
Although the difference in means is small relative to the variability, the large sample size allows us to detect a statistically significant difference. This result remains statistically significant even at very high confidence levels (e.g. 99.9%).