https://github.com/steviecurran/prediction-plot
Code to performs machine learning (k-nearest neighbours regression) and plot the predicted versus measured values
https://github.com/steviecurran/prediction-plot
astrophysics c data-analysis high-redshift machine-learning pgplot python statistics tensorflow visualization
Last synced: 2 months ago
JSON representation
Code to performs machine learning (k-nearest neighbours regression) and plot the predicted versus measured values
- Host: GitHub
- URL: https://github.com/steviecurran/prediction-plot
- Owner: steviecurran
- Created: 2023-03-23T21:19:10.000Z (over 3 years ago)
- Default Branch: main
- Last Pushed: 2025-02-18T21:41:44.000Z (over 1 year ago)
- Last Synced: 2025-03-04T04:15:23.296Z (over 1 year ago)
- Topics: astrophysics, c, data-analysis, high-redshift, machine-learning, pgplot, python, statistics, tensorflow, visualization
- Language: C
- Homepage: https://ui.adsabs.harvard.edu/abs/2022MNRAS.514....1C/abstract
- Size: 244 KB
- Stars: 0
- Watchers: 1
- Forks: 0
- Open Issues: 0
-
Metadata Files:
- Readme: README.md
Awesome Lists containing this project
README
# prediction-plot
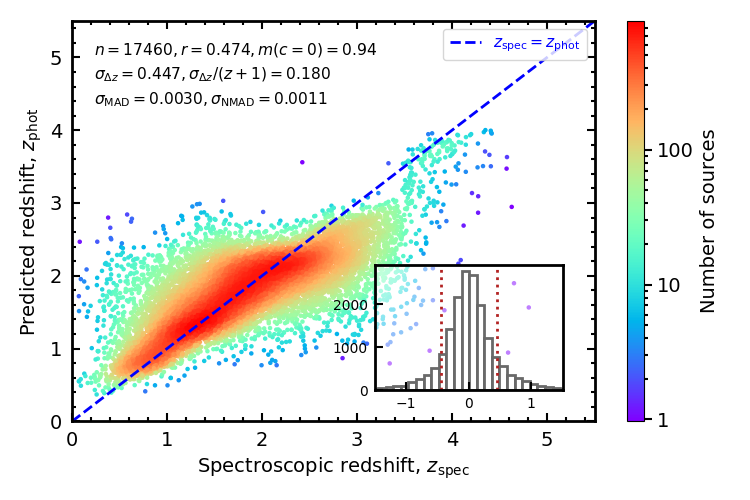
Code to perform machine learning (k-nearest neighbours regression) and plot the predicted versus measured values. This is all contained within kNN.py and supersedes the all of the C code above (thus not requiring me to write my own grey-scale function, etc.).
## Previous C version
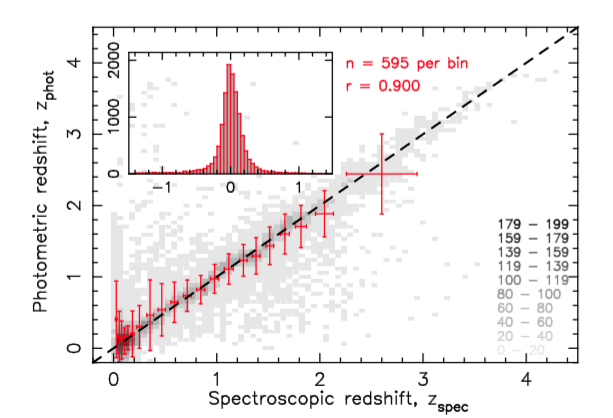
Useful for large datasets, as produces a grey scale and error bars of equally binned data instead of individal points.
Also returns a sub-plot showing the distribution of the difference in the predicted and measured values and gives the mean difference, the standard deviation and outlier fraction.