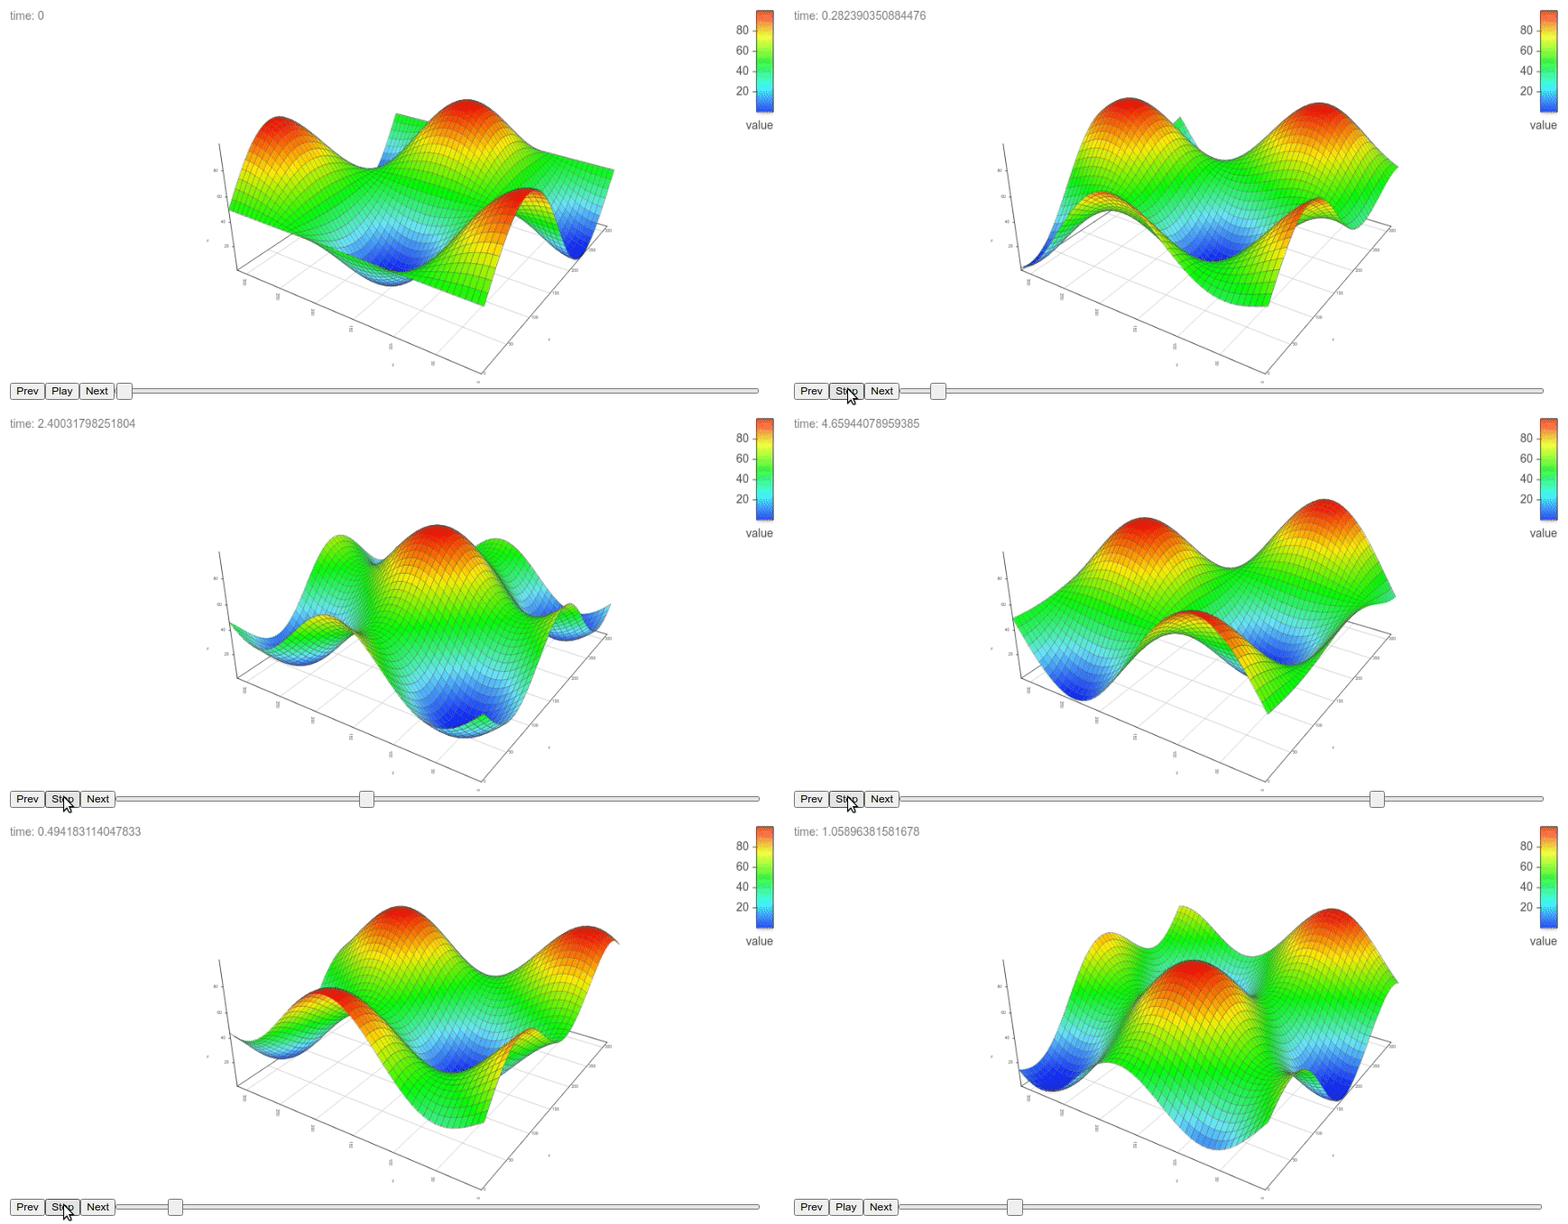
https://github.com/stla/graph3d
Create interactive visualization charts to draw data in three dimensional graphs. The graphs can be included in Shiny apps and R markdown documents, or viewed from the R console and 'RStudio' Viewer. Based on the 'vis.js' Graph3d module and the 'htmlwidgets' R package.
https://github.com/stla/graph3d
charts graphics javascript r
Last synced: 2 months ago
JSON representation
Create interactive visualization charts to draw data in three dimensional graphs. The graphs can be included in Shiny apps and R markdown documents, or viewed from the R console and 'RStudio' Viewer. Based on the 'vis.js' Graph3d module and the 'htmlwidgets' R package.
- Host: GitHub
- URL: https://github.com/stla/graph3d
- Owner: stla
- License: other
- Created: 2019-08-09T17:04:56.000Z (almost 6 years ago)
- Default Branch: master
- Last Pushed: 2020-11-12T19:44:34.000Z (over 4 years ago)
- Last Synced: 2025-03-28T03:24:22.839Z (3 months ago)
- Topics: charts, graphics, javascript, r
- Language: R
- Homepage:
- Size: 12.3 MB
- Stars: 4
- Watchers: 2
- Forks: 2
- Open Issues: 0
-
Metadata Files:
- Readme: README.md
- License: LICENSE.note
Awesome Lists containing this project
- awesome-shiny-extensions - graph3d - R wrapper of the JavaScript library vis-graph3d. (Visualization / Scatterplot)
README
# graph3d
