https://github.com/stolk/ThreadTracer
Lightweight inline profiler that measures wall-time, cpu-time and premptive context switches for threads.
https://github.com/stolk/ThreadTracer
Last synced: 11 months ago
JSON representation
Lightweight inline profiler that measures wall-time, cpu-time and premptive context switches for threads.
- Host: GitHub
- URL: https://github.com/stolk/ThreadTracer
- Owner: stolk
- License: mit
- Created: 2017-10-30T02:27:01.000Z (over 8 years ago)
- Default Branch: master
- Last Pushed: 2022-06-07T16:12:20.000Z (almost 4 years ago)
- Last Synced: 2024-08-04T02:09:49.560Z (over 1 year ago)
- Language: C
- Size: 30.3 KB
- Stars: 72
- Watchers: 6
- Forks: 4
- Open Issues: 0
-
Metadata Files:
- Readme: README.md
- License: LICENSE
Awesome Lists containing this project
- AwesomeCppGameDev - ThreadTracer - time, cpu-time and premptive context switches for threads. (C++)
README
# ThreadTracer
## Summary
Lightweight inline profiler that measures wall-time, cpu-time and premptive context switches for threads.
## Features
ThreadTracer is an inline profiler that is special in the following ways:
* Fully supports multi threaded applications.
* Will never cause your thread to go to sleep because of profiling.
* Will not miss events.
* Will detect if threads were context-switched by scheduler, preemptively or voluntarily.
* Computes duty-cycle for each scope: not just how long it ran, but also how much of that time, it was scheduled on a core.
* Small light weight system, written in C. Just one header and one small implementation file.
* Zero dependencies.
## Limitations
* Doesn't show a live profile, but creates a report after the run, [viewable with Google Chrome](https://www.gamasutra.com/view/news/176420/Indepth_Using_Chrometracing_to_view_your_inline_profiling_data.php).
* Currently does not support asynchronous events that start on one thread, and finish on another.
## Usage
```
#include
// Each thread that will be generating profiling events needs to be made known to the system.
// If you sign in with threadid TT_CALLING_THREAD, the threadid of calling thread will be used.
tt_signin( TT_CALLING_THREAD, "mainthread" );
// C Programs need to wrap sections of code with a begin and end macro.
TT_BEGIN( "simulation" );
simulate( dt );
TT_END( "simulation" );
// C++ can also use a scoped tag. Event automatically ends when it goes out of scope.
void draw_all(void)
{
TT_SCOPE( "draw" );
draw_world();
if ( !overlay )
return;
draw_info();
}
// When you are done profiling, typically at program end, or earlier, you can generate the profile report.
tt_report(NULL);
```
## Platforms
ThreadTracer has been tested on:
* Linux amd64
* Linux x86
* Linux RISCV
* FreeBSD amd64
## Building
Just add threadtracer.c to your project, and compile your sources with ```-D_GNU_SOURCE``` flag so that RUSAGE_THREAD support is available for the getrusage() call.
## Viewing the report
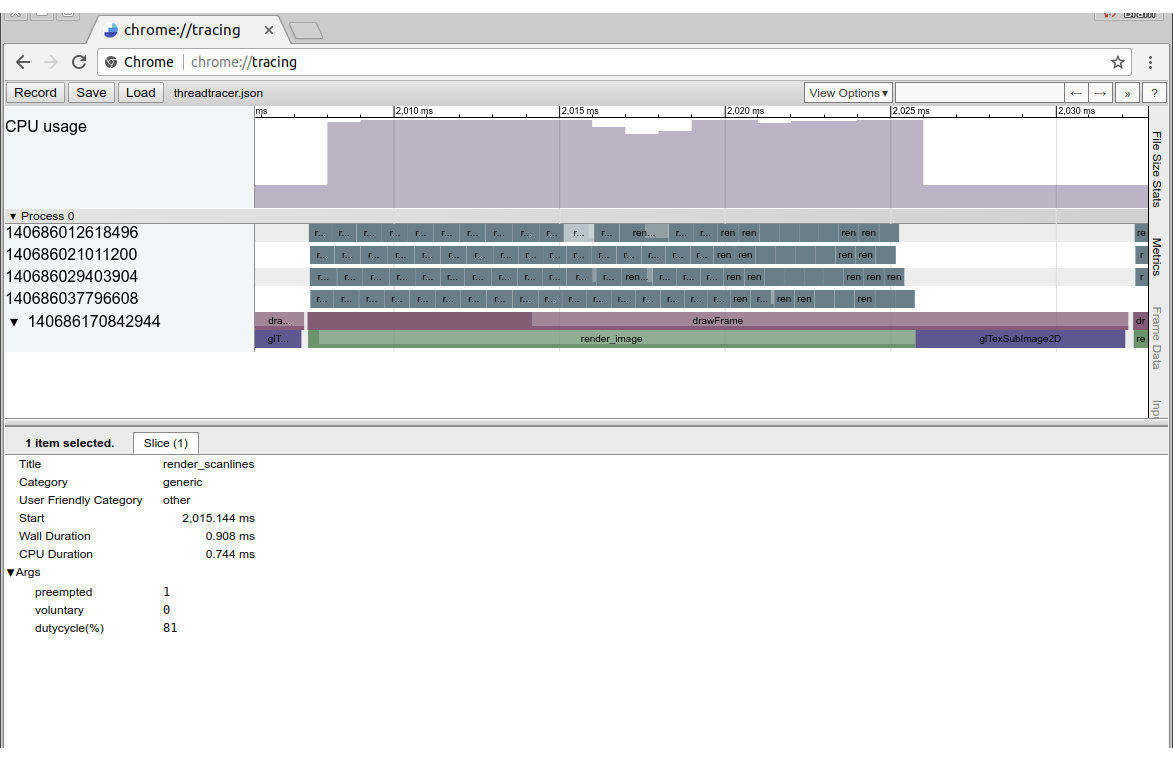
Start the Google Chrome browser, and in the URL bar, type ```chrome://tracing``` and then load the genererated threadtracer.json file.

Note that for the highlighted task, the detail view shows that the thread got interrupted once preemptively, which causes it to run on a CPU core for only 81% of the time that the task took to complete.
The shading of the time slices shows the duty cycle: how much of the time was spend running on a core.
## Skipping samples at launch.
To avoid recording samples right after launch, you can skip the first seconds of recording with an environment variable. To skip the first five seconds, do:
```
$ THREADTRACERSKIP=5 ./foo
ThreadTracer: clock resolution: 1 nsec.
ThreadTracer: skipping the first 5 seconds before recording.
ThreadTracer: Wrote 51780 events (6 discarded) to threadtracer.json
```
## Acknowledgements
* [chrome://tracing](https://www.chromium.org/developers/how-tos/trace-event-profiling-tool) for their excellent in-browser visualization.
* [Remotery](https://github.com/Celtoys/Remotery) and [Minitrace!](https://github.com/hrydgard/minitrace) for the inspiration, and showing how powerful inline profiling can be.
* [Frogtoss](https://www.frogtoss.com/) for contributing and testing.