https://github.com/suresh-chelani/crop-data-visualization
This project implements data visualization tasks using TypeScript, Vite, Apache ECharts, and Mantine v7. The goal is to process agricultural data, handle missing values, and render a table and a bar chart based on the dataset.
https://github.com/suresh-chelani/crop-data-visualization
apache-echarts data-visualization mantine-v7 typescript vite
Last synced: over 1 year ago
JSON representation
This project implements data visualization tasks using TypeScript, Vite, Apache ECharts, and Mantine v7. The goal is to process agricultural data, handle missing values, and render a table and a bar chart based on the dataset.
- Host: GitHub
- URL: https://github.com/suresh-chelani/crop-data-visualization
- Owner: Suresh-Chelani
- Created: 2025-01-05T06:52:07.000Z (over 1 year ago)
- Default Branch: main
- Last Pushed: 2025-01-05T07:09:19.000Z (over 1 year ago)
- Last Synced: 2025-01-12T08:36:28.963Z (over 1 year ago)
- Topics: apache-echarts, data-visualization, mantine-v7, typescript, vite
- Language: TypeScript
- Homepage: https://crop-data-visualization.netlify.app/
- Size: 222 KB
- Stars: 0
- Watchers: 1
- Forks: 0
- Open Issues: 0
-
Metadata Files:
- Readme: README.md
Awesome Lists containing this project
README
# Crop Data Visualization Project
This project implements data visualization tasks using TypeScript, Vite, Apache ECharts, and Mantine v7. The goal is to process agricultural data, handle missing values, and render a table and a bar chart based on the dataset.
### My UI look like:
## **Landing Page UI**
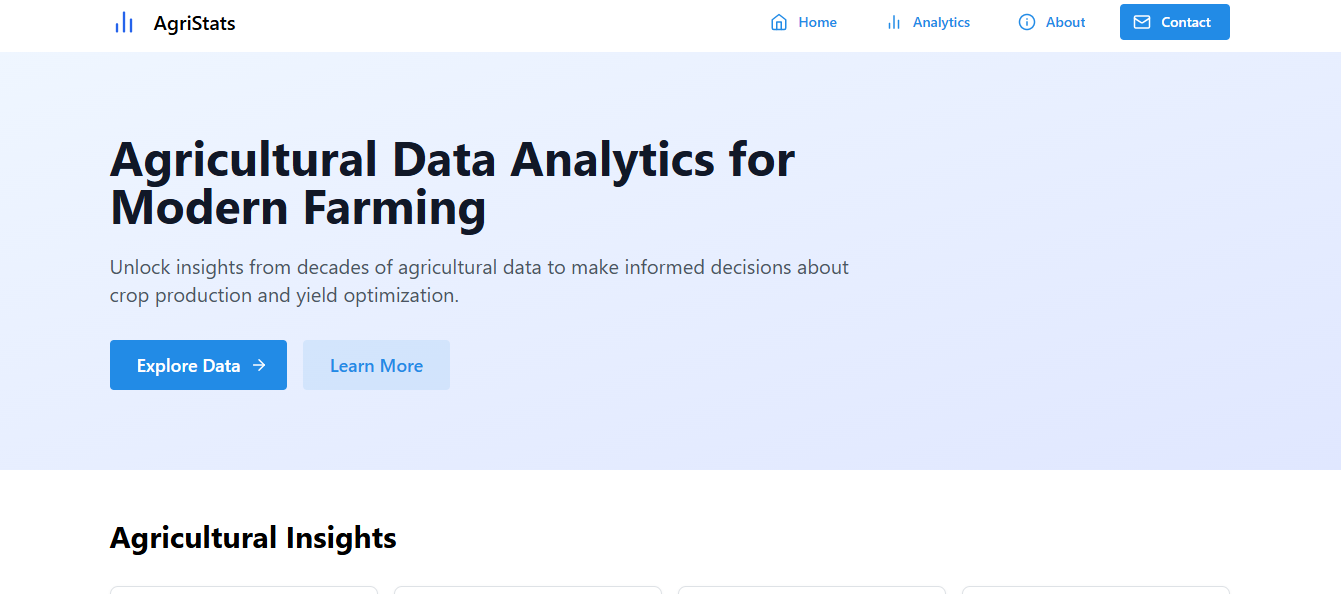
### [LIVE DEMO](https://crop-data-visualization.netlify.app/)
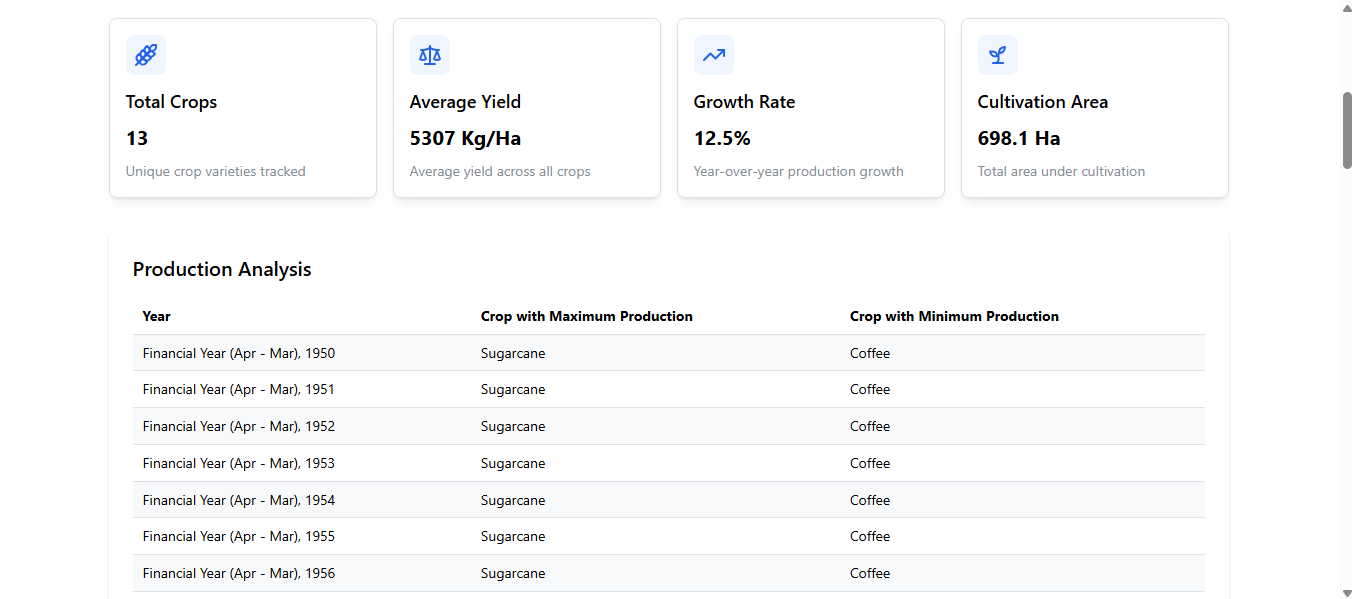
## **Production Analysis Table**
This table shows the crop with the maximum and minimum production for each year.
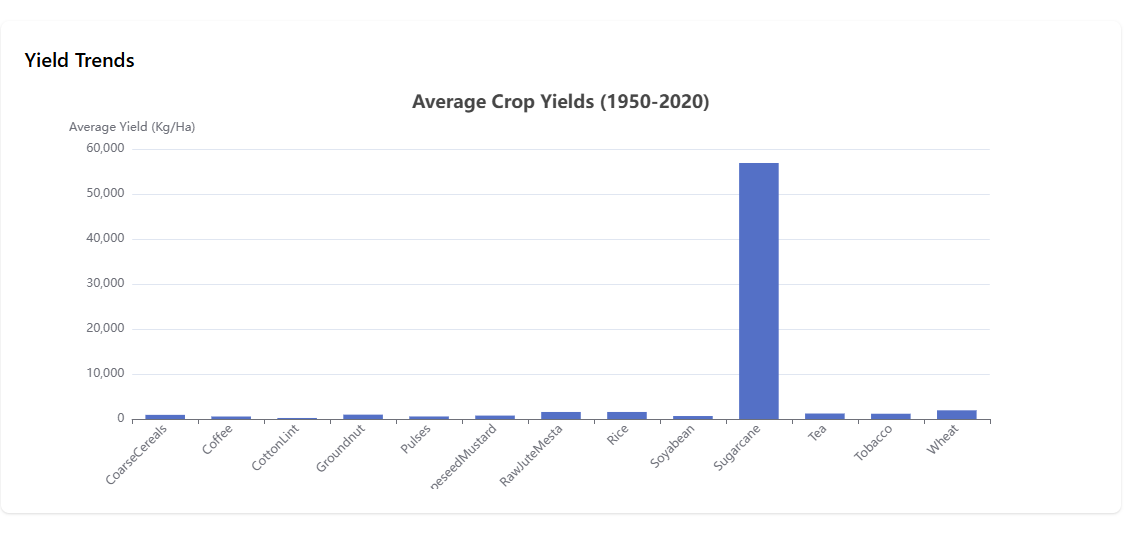
## **Average Yield Bar Chart**
This bar chart displays the average yield of crops across all years (1950-2020).
## **Technologies Used**
- **TypeScript**: For strictly typed JavaScript.
- **Vite**: Development environment with fast build times.
- **Apache ECharts**: For creating the bar chart visualizations.
- **Mantine v7**: For creating the table component.
---
## **Features**
1. **Missing Values Handling**: All missing or empty values in the dataset are replaced with `0` before calculations or rendering.
2. **Table Component**:
- Displays the crop with maximum and minimum production for each year.
3. **Bar Chart Component**:
- Displays the average yield of crops (1950–2020) using a bar chart.
---
## **Installation and Setup**
Follow the steps below to set up and run the project:
### **Step 1: Clone the Repository**
```bash
git clone https://github.com/Suresh-Chelani/Crop-Data-Visualization.git
cd Crop-Data-Visualization
```
### **Step 2: Install Dependencies**
yarn install
### **Step 3: Run the Development Server**
yarn dev
### Usage
1. The application will automatically open in your default browser.
2. You will see:
1. A table showing the crop with the maximum and minimum production for each year.
2. A bar chart showing the average yield of crops across all years.
### Scripts
1. yarn dev: Starts the development server and opens the browser.
2. yarn build: Builds the project for production.
3. yarn preview: Previews the production build.
## Dependencies
1. Vite: ^4.0.0
2. Apache ECharts: ^5.4.0
3. Mantine v7: ^7.0.0
4. TypeScript: ^4.0.0
## License
This project is licensed under the MIT License.
## Acknowledgments
1. Dataset provided for the project assignment.
2. Frameworks and tools used: Vite, Mantine v7, Apache ECharts.