https://github.com/swrobel/meta-surf-forecast
🌊 Modern swell buoy charts + Aggregated surf forecast from Surfline & Spitcast APIs
https://github.com/swrobel/meta-surf-forecast
forecast-data ndbc ndbc-buoy-data spitcast surf surf-forecast surfing surfline
Last synced: 7 months ago
JSON representation
🌊 Modern swell buoy charts + Aggregated surf forecast from Surfline & Spitcast APIs
- Host: GitHub
- URL: https://github.com/swrobel/meta-surf-forecast
- Owner: swrobel
- License: mit
- Created: 2016-01-24T02:04:58.000Z (over 10 years ago)
- Default Branch: main
- Last Pushed: 2025-05-09T03:55:14.000Z (about 1 year ago)
- Last Synced: 2025-05-13T12:08:45.397Z (about 1 year ago)
- Topics: forecast-data, ndbc, ndbc-buoy-data, spitcast, surf, surf-forecast, surfing, surfline
- Language: Ruby
- Homepage: https://metasurfforecast.com
- Size: 4.11 MB
- Stars: 316
- Watchers: 49
- Forks: 61
- Open Issues: 4
-
Metadata Files:
- Readme: README.md
- License: LICENSE
Awesome Lists containing this project
README
# Meta Surf Forecast
- [Meta Surf Forecast](#meta-surf-forecast)
- [Purposes](#purposes)
- [Developer Setup](#developer-setup)
- [Prerequisites](#prerequisites)
- [Steps](#steps)
- [Tips](#tips)
- [Adding Spots](#adding-spots)
- [Data Sources](#data-sources)
- [Surfline](#surfline)
- [New API (v2)](#new-api-v2)
- [Responses](#responses)
- [Requests](#requests)
- [Old API (v1 - no longer supported)](#old-api-v1---no-longer-supported)
- [Spitcast](#spitcast)
- [MagicSeaweed (no longer supported)](#magicseaweed-no-longer-supported)
- [The Magic](#the-magic)
- [Surf quality ratings](#surf-quality-ratings)
- [Surfline v2](#surfline-v2)
- [Spitcast](#spitcast-1)
- [Timestamps](#timestamps)
- [TODO](#todo)
## Purposes
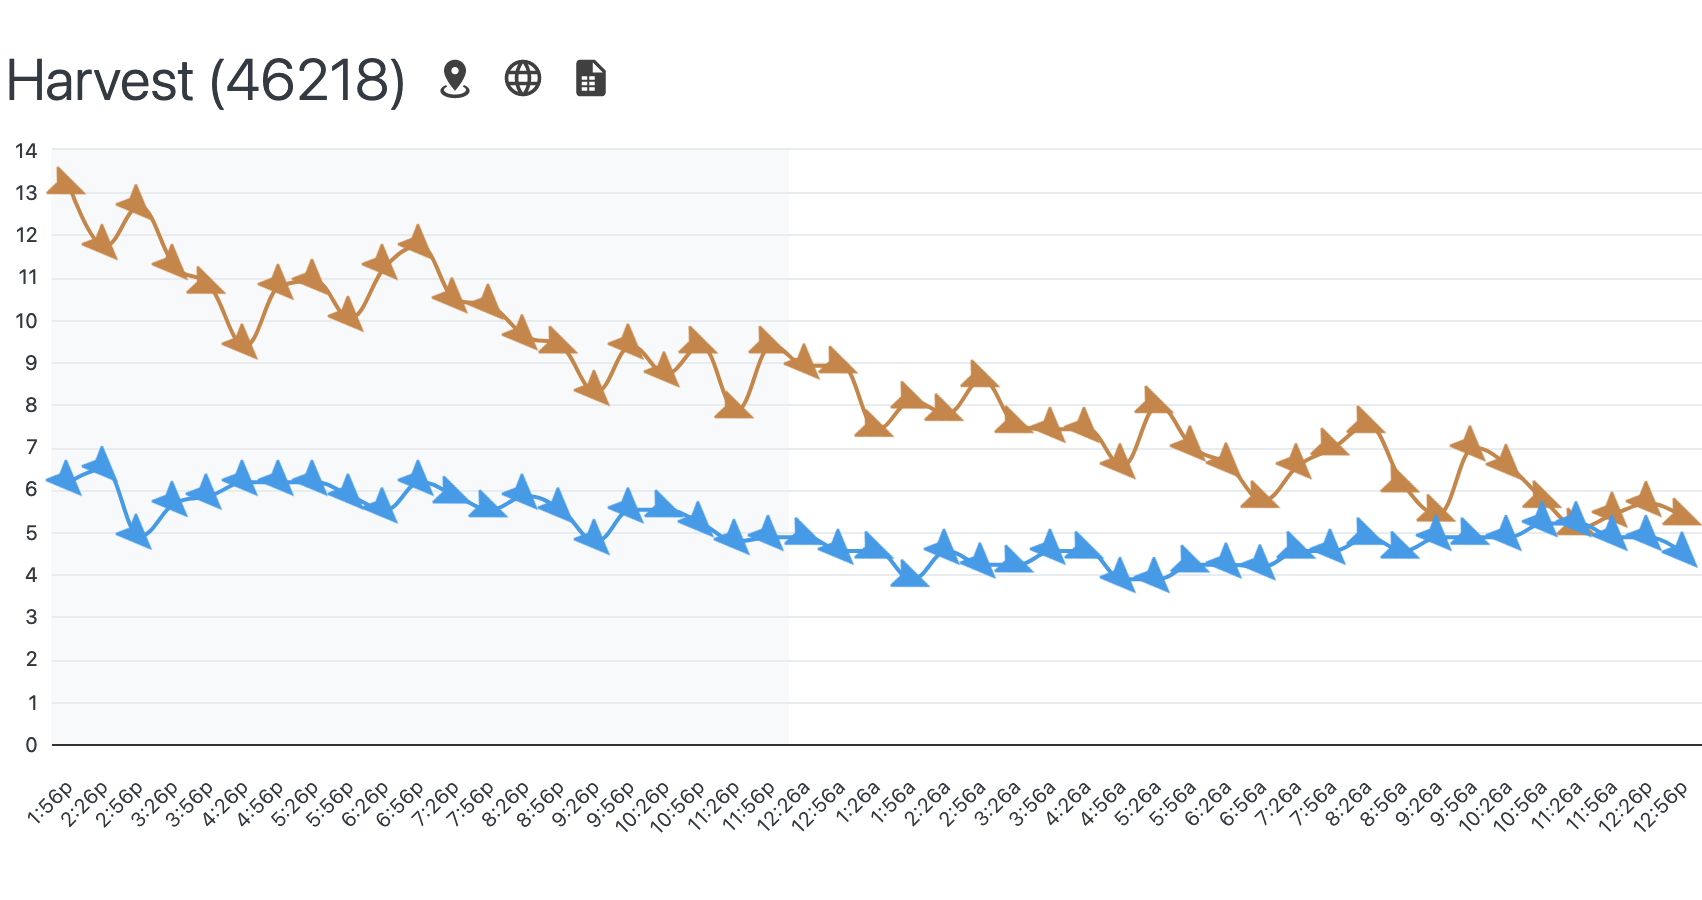
1. Display a chart of approximate wave height (swell height * period * 0.1) for the last 24 hours from [NDBC Buoys](https://www.ndbc.noaa.gov/)
1. Query the [Surfline](https://www.surfline.com/) & [Spitcast](https://www.spitcast.com/) APIs to display an aggregated surf forecast.

## Developer Setup
### Prerequisites
* `ruby 3.4.x`
* `node 22.x`
* `yarn 1.x`
* `postgresql`
### Steps
1. Install dependencies using [Homebrew](https://brew.sh/): `brew bundle`
1. If on Linux: `pg_ctl -D /home/linuxbrew/.linuxbrew/var/postgres start`
1. `gem install bundler -v=$(cat Gemfile.lock | tail -1 | tr -d " ")`
1. `bundle`
1. `yarn`
1. `bin/rails db:create db:schema:load:with_data db:seed`
1. Grab some data: `bin/rails buoys:update forecasts:update`
1. `bin/foreman start -f Procfile.dev`
1. Open http://localhost:5001
1. Any changes you make to view files will auto-reload the browser
### Tips
* You will not get Surfline forecast data without a valid Surfline premium login. Add your credentials to `.env.development`:
```
SURFLINE_EMAIL=xxx
SURFLINE_PASSWORD=yyy
```
Then run `bin/rails forecasts:update` again
* When running migrations, use `bin/rails db:migrate:with_data` to include Data Migrations
## Adding Spots
Contributing new spots is easy! Make sure you're signed into your [Github account](https://github.com/join) and edit the [seeds file](https://github.com/swrobel/meta-surf-forecast/edit/main/db/seeds.rb):
1. Create a new Region/Subregion if necessary. For example, Los Angeles is created like so:
```ruby
CA = Region.find_or_create_by(name: 'California')
LA = Subregion.find_or_create_by(name: 'Los Angeles', region: CA)
LA.timezone = 'America/Los_Angeles'
LA.save!
```
You can get valid timezone names from [this list](https://gist.github.com/swrobel/77626ff3d4967ca65c3028dcb336d57a).
1. Use [this tool](https://boundingbox.klokantech.com/) to draw a bounding box around the area you want to find spots for.
1. Choose CSV from the dropdown at the bottom & copy the coordinates string.
1. Run `rails console`, then run `SpotFinder.new('{string}').formatted_spots`.
1. Copy the output and paste it into the spots array in `seeds.rb`, then make sure to assign each spot to the right subregion & delete extraneous fields (`match_type`, `distance`).
1. It's strongly encouraged to add all spots for a particular county or region rather than just a single one. Be a pal!
1. Submit a pull request and I'll get it on the site ASAP!
Use the following as a template. Add `spitcast_v2_id
```ruby
{
name: 'County Line',
lat: 34.051,
lon: -118.964,
surfline_v2_id: '590927576a2e4300134fbed8',
subregion: LA,
},
```
## Data Sources
### [Surfline](https://www.surfline.com/)
#### New API (v2)
##### Responses
Surfline's new API is undocumented but easy to reverse engineer using their new website's code. Thankfully its structure is much more sane than the old API.
##### Requests
`https://services.surfline.com/kbyg/spots/forecasts/{type}?{params}`
For reference, I believe `kbyg` stands for "Know Before You Go," which is their tagline.
Type|Data
----|----
rating|array of human-readable and numeric (0-6) ratings
wave|array of min/max sizes & optimal scores
wind|array of wind directions/speeds & optimal scores
tides|array of types & heights
weather|array of sunrise/set times, array of temperatures/weather conditions
Param|Values|Effect
-----|------|------
spotId|string|Surfline spot id that you want data for. A typical Surfline URL is `https://www.surfline.com/surf-report/venice-breakwater/590927576a2e4300134fbed8` where `590927576a2e4300134fbed8` is the `spotId`
days|integer|Number of forecast days to get (Max 6 w/o access token, Max 17 w/ premium token)
intervalHours|integer|Minimum of 1 (hour)
maxHeights|boolean|`true` seems to remove min & optimal values from the wave data output
accesstoken|string|Auth token to get premium data access (optional)
Anywhere there is an `optimalScore` the value can be interpreted as follows:
Value|Meaning
-----|-------
0|Suboptimal
1|Good
2|Optimal
However, I have never seen a score of 1 in any of their API responses (only 0 or 2), which is unfortunate when it comes to granularity of ratings. Hopefully this changes in the future.
#### Old API (v1 - no longer supported)
Surfline's old API is undocumented and unauthenticated, but was used via javascript on their website, so it was fairly easy to reverse-engineer. However, they have updated their site & apps to use the new API, and it appears that they've stopped including some critical data in the responses for the old API, so it's disabled in this app for now (and probably forever).
It returned JSON, but with a very odd structure, with each item that is time-sensitive containing an array of daily arrays of values that correspond to timestamps provided in a separate set of arrays. For example (lots of data left out for brevity):
```json
"Surf": {
"dateStamp": [
[
"January 24, 2016 04:00:00",
"January 24, 2016 10:00:00",
"January 24, 2016 16:00:00",
"January 24, 2016 22:00:00"
],
[
"January 25, 2016 04:00:00",
"January 25, 2016 10:00:00",
"January 25, 2016 16:00:00",
"January 25, 2016 22:00:00"
]
],
"surf_min": [
[
2.15,
1.8,
1.4,
1
],
[
0.7,
0.4,
0.3,
0.3
]
],
}
```
Requests are structured as follows:
`https://api.surfline.com/v1/forecasts/{spot_id}?{params}`
This is a breakdown of the params available:
Param|Values|Effect
-----|------|------
spot_id|integer|Surfline spot id that you want data for. A typical legacy Surfline URL is `https://www.surfline.com/surf-report/venice-beach-southern-california_4211/` where 4211 is the `spot_id`. You can also get this from a v2 API response's `legacyId` property.
resources|string|Any comma-separated list of "surf,analysis,wind,weather,tide,sort". There could be more available that I haven't discovered. "Sort" gives an array of swells, periods & heights that are used for the tables on [spot forecast pages](https://www.surfline.com/surf-forecasts/spot/venice-beach_4211/). To see the whole list, just set 'all'.
days|integer|Number of days of forecast to get. This seems to cap out at 16 for Wind and 25 for Surf.
getAllSpots|boolean|`false` returns an object containing the single spot you requested, `true` returns an array of data for all spots in the same region as your spot, in this case "South Los Angeles"
units|string|`e` returns American units (ft/mi), `m` uses metric
usenearshore|boolean|The best that I can gather, you want this set to `true` to use the [more accurate nearshore models](https://www.surfline.com/surf-science/what-is-lola---forecaster-blog_61031/) that take into account how each spot's unique bathymetry affects the incoming swells.
interpolate|boolean|Provide "forecasts" every 3 hours instead of ever 6. These interpolations seem to be simple averages of the values of the 6-hour forecasts.
showOptimal|boolean|Includes arrays of 0's & 1's indicating whether each wind & swell forecast is optimal for this spot or not. Unfortunately the optimal swell data is only provided if you include the "sort" resource - it is not included in the "surf" resource.
callback|string|jsonp callback function name
### [Spitcast](https://www.spitcast.com/)
Spitcast has a [documented API](https://github.com/jackmullis/spitcast-api-docs).
I've also asked Jack from Spitcast a few questions and added his responses below:
* Why does the site show a size range, but the API only returns one `size` value?
> I actually take the API number and create the max by adding 1/6 the height (in feet), and then create the min by subtracting 1/6 the height."
* All possible values for shape:
* Poor
* Poor-Fair
* Fair
* Fair-Good
* Good
### [MagicSeaweed](https://magicseaweed.com/) (no longer supported)
MagicSeaweed was acquired by Surfline an shut down in 2023. Prior to this, MagicSeaweed had a [well-documented JSON API](https://magicseaweed.com/developer/forecast-api) that required requesting an API key via email. This was a straightforward process and they got back to me quickly with my key.
I've asked MagicSeaweed a few questions and added their responses below:
* "Our API provides 5 days of forecast data, with segments of data provided for each 3 hour interval during that 5 day time span."
* "Our data is updated every 3 hours."
## The Magic
### Surf quality ratings
All of the forecasting services (including Surfline v1 vs v2) use different systems for rating waves. I've attempted to normalize them all to a 0-6 (6-point) scale as best as possible, which is perhaps easier to understand when mapped onto the commonly-used Poor-Good scale. At the top-end, Very Good is the typical top end, while Epic is allowed for in the rare occasions where Surfline's rating goes above 5:
Value|Meaning
-----|-------
0|Poor
1|Poor - Fair
2|Fair
3|Fair - Good
4|Good
5|Very Good
6+|Epic
Each forecasting service is massaged onto that scale as follows:
#### Surfline v2
[5-point ratings](https://support.surfline.com/hc/en-us/articles/36277684017819-Surf-Ratings-Colors), which equate to decimal values (0-4). These are massaged by multiplying by 5/4 to get a 0-5 scale.
The scale can go above 4, but the top 2 values require a human forecaster override, so they are rarely seen.

Value|Meaning
-----|-------
0|Very Poor
1|Poor
2|Poor - Fair
3|Fair
4|Fair - Good
5|Good
6|Epic
#### Spitcast
Value|Meaning
-----|-------
0.0|Poor
0.5|Poor-Fair
1.0|Fair
1.5|Good
These are massaged by multiplying by 5/1.5 (essentially 3.3̅) to get a 0-5 scale.
For record-keeping, these are the formulae for formerly-supported services:
* **MagicSeaweed:** integer `fadedRating` (0-5) & `solidRating` (0-5). I simply subtract fadedRating (which is essentially the negative effect of wind) from solidRating.
* **Surfline v1:** decimal ratings (0-1) for up to 6 different swells at each spot, as well as an `optimalWind` boolean. I take the max swell rating at any given time for that spot, multiply it by 5, and then halve it if the wind is not optimal.
### Timestamps
It took me a long time to land on a solution here, but I've finally settled on storing all timestamps in the database in the spot's local time. This defies Rails convention, but makes intuitive sense. If you pull up the forecasts table and look at the timestamp, that's the actual local time at that spot that it's forecast for (even though Rails & Postgres both think it's being stored in UTC). This is typically the format that the forecasting service gives it to us in, and what users want to see it in, so there's no point in doing all sorts of fancy conversion when it should be the same all the way through the pipeline. Now, you may ask, why am I still using the Rails default of `TIMESTAMP WITHOUT TIMEZONE`, and the answer is that shockingly enough, `TIMESTAMP WITH TIMEZONE` [doesn't actually store timezone data](https://stackoverflow.com/a/9576170/337446)!
## TODO
* [ ] Use [SoFar API](https://docs.sofarocean.com/spotter-and-smart-mooring/spotter-data/latest-data) to get data from additional buoys
* [ ] Figure out a way to convey forecast certainty in charts (ie: most forecasts are in agreement, or they disagree by a wide margin)
* [ ] Fetch & display tide/wind/water temperature data from [NOAA](https://tidesandcurrents.noaa.gov/waterlevels.html?id=9410840) (they actually have a decent [API](https://tidesandcurrents.noaa.gov/api/)!)
* [x] Update Surfline v2 API to use their new [7-point rating scale](https://support.surfline.com/hc/en-us/articles/14006471584411-Surfline-s-surf-rating) ([thanks @smmuirhead100](https://github.com/swrobel/meta-surf-forecast/pull/61)!)
* [x] Improve charts:
* [x] Fix timestamp formatting.
* [x] Account for min/max size forecast. Currently charts just reflect the max.
* [x] Display forecast quality ratings. Perhaps color each bar different depending on how good the rating is. Surfline also has an `optimal_wind` boolean that is being crudely integrated into the [`display_swell_rating`](https://github.com/swrobel/meta-surf-forecast/blob/main/app/models/surfline.rb#L5) method - improvements welcome.
* [x] Fetch & display [recent buoy trends](https://www.ndbc.noaa.gov/show_plot.php?station=46025&meas=wvht&uom=E&time_diff=-7&time_label=PDT) that are relevant to each spot to give an idea of when swell is actually arriving.
* [x] Refresh data on a schedule based on when new data is available (refreshing all forecast sources hourly)
* [x] Support multiple timezones as opposed to Pacific Time only
* [x] New Surfline API
* [x] Stop manually seeding the db and figure out a way to pull all spots from each data source and automatically associate them to a canonical spot record (probably using geocoding)
* [x] Dark Theme
* [x] Remove asset pipeline & process CSS w/ webpacker