https://github.com/taiyun/corrplot
A visual exploratory tool on correlation matrix
https://github.com/taiyun/corrplot
corrplot cran r r-package visualization
Last synced: 8 months ago
JSON representation
A visual exploratory tool on correlation matrix
- Host: GitHub
- URL: https://github.com/taiyun/corrplot
- Owner: taiyun
- License: other
- Created: 2011-12-04T15:15:45.000Z (over 14 years ago)
- Default Branch: master
- Last Pushed: 2024-10-14T05:33:58.000Z (over 1 year ago)
- Last Synced: 2025-10-21T20:56:57.602Z (8 months ago)
- Topics: corrplot, cran, r, r-package, visualization
- Language: R
- Homepage: https://github.com/taiyun/corrplot
- Size: 36.4 MB
- Stars: 335
- Watchers: 13
- Forks: 89
- Open Issues: 20
-
Metadata Files:
- Readme: README.md
- Changelog: NEWS.md
- License: LICENSE
Awesome Lists containing this project
- fucking-awesome-R - corrplot - A graphical display of a correlation matrix or general matrix. It also contains some algorithms to do matrix reordering. (Graphic Displays)
- awesome-R - corrplot - A graphical display of a correlation matrix or general matrix. It also contains some algorithms to do matrix reordering. (Graphic Displays)
- Road2R - corrplot - Visualization of a Correlation Matrix. (Table of Contents / Visualization)
- awesome-R - corrplot - A graphical display of a correlation matrix or general matrix. It also contains some algorithms to do matrix reordering. (Graphic Displays)
README
[](https://github.com/taiyun/corrplot/actions)
[](https://app.codecov.io/github/taiyun/corrplot?branch=master)
[](https://cran.r-project.org/package=corrplot)
[](https://www.r-pkg.org/pkg/corrplot)
## Summary
R package **corrplot** provides a visual exploratory tool on correlation matrix that
supports automatic variable reordering to help detect hidden patterns among variables.
corrplot is very easy to use and provides a rich array of plotting options in
visualization method, graphic layout, color, legend, text labels, etc.
It also provides p-values and confidence intervals to help users determine the
statistical significance of the correlations.
For examples, see its
[online vignette](https://taiyun.github.io/corrplot/).
This package is licensed under the MIT license, and available on CRAN:
.
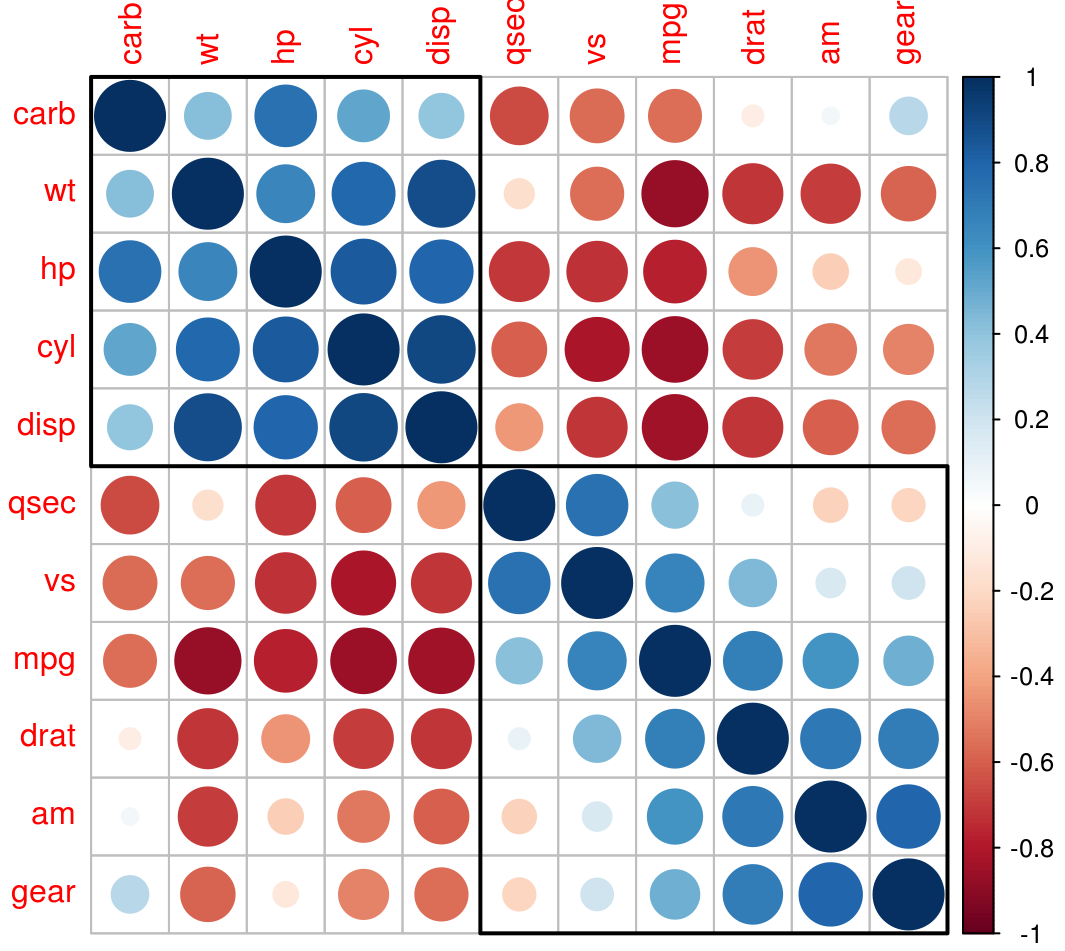
## Basic example
```r
library(corrplot)
M = cor(mtcars)
corrplot(M, order = 'hclust', addrect = 2)
```
## Download and Install
To download the release version of the package on CRAN, type the following at the R command line:
```r
install.packages('corrplot')
```
To download the development version of the package, type the following at the R command line:
```r
devtools::install_github('taiyun/corrplot', build_vignettes = TRUE)
```
## How to cite
To cite `corrplot` properly, call the R built-in command
`citation('corrplot')` as follows:
```r
citation('corrplot')
```
## Reporting bugs and other issues
If you encounter a clear bug, please file a minimal reproducible example on
[github](https://github.com/taiyun/corrplot/issues).